Examples
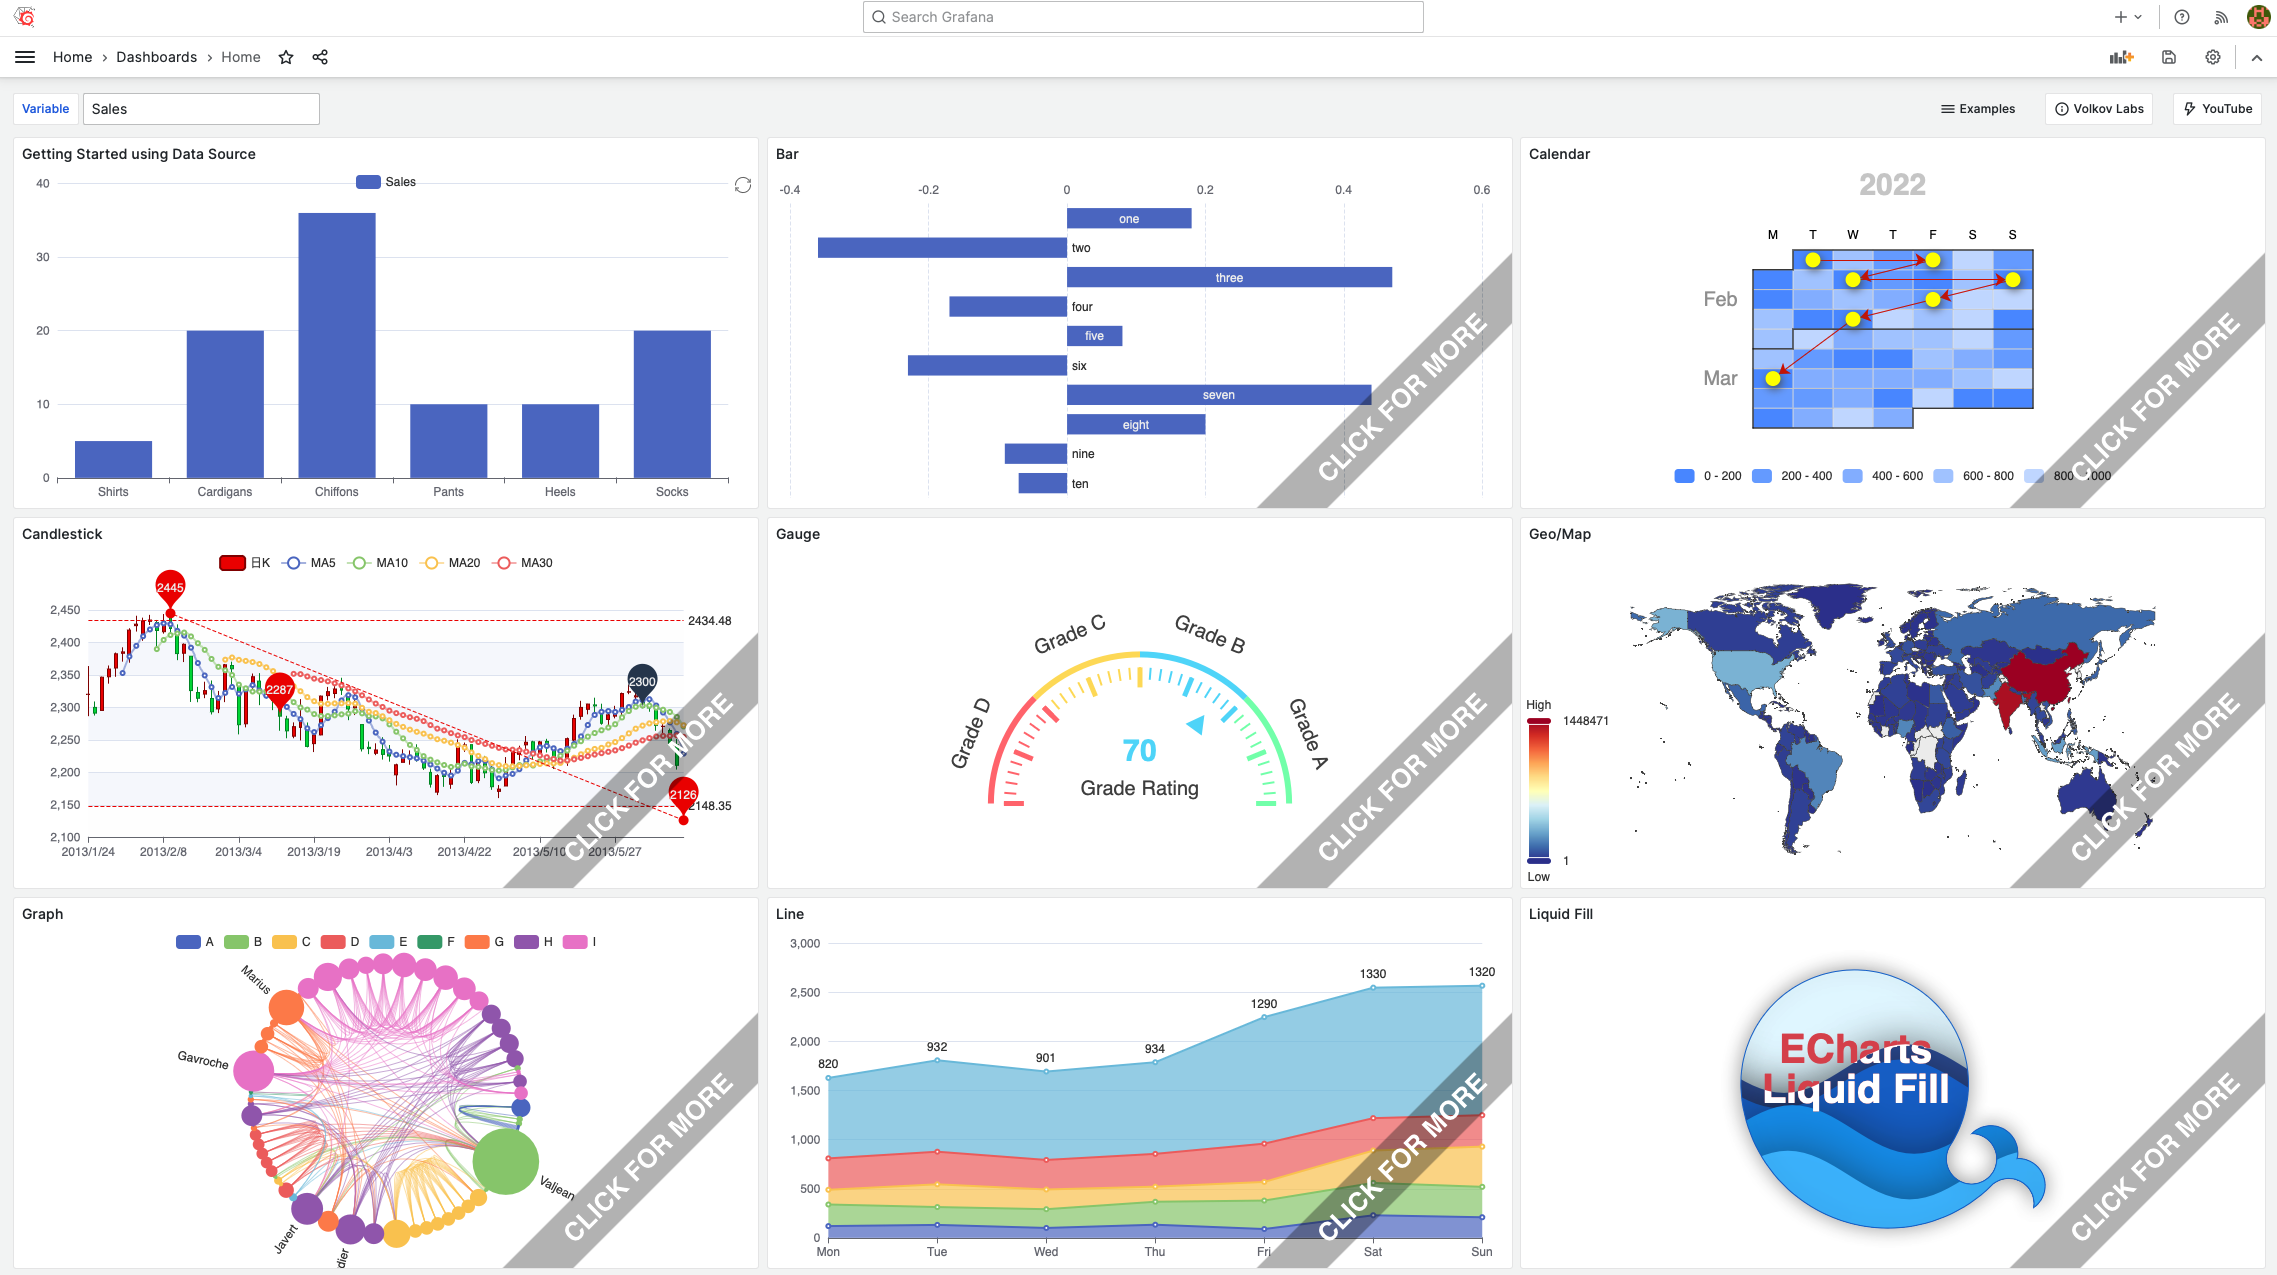
Take a try of 100+ ready-to-use chart examples at our demo site for the Business Charts panel.
Get started
-
Open echarts.volkovlabs.io with chart examples.
-
Locate the chart that looks similar to the one you want to build.
-
Open this chart in the edit mode (click on the three vertical dots located at the top-right corner and select the Edit menu).
- On the right-hand side find the Code section, then Function parameter. It is the so-called Charts function.
- Review and experiment with the code it contains. The chart dashboard is in the read-only mode so you cannot save your changes on our server.
- Copy the Charts function code (everything in the Function parameter).
-
Paste the copied code into the code editor of your Business Charts visualization panel.
-
You should see the rendered chart instantly.
- You may need to refresh the chart to update its state.