Data Flow
To get a glimpse under the hood, please review the following comparison.
A visualization panel versus the Business Variable panel
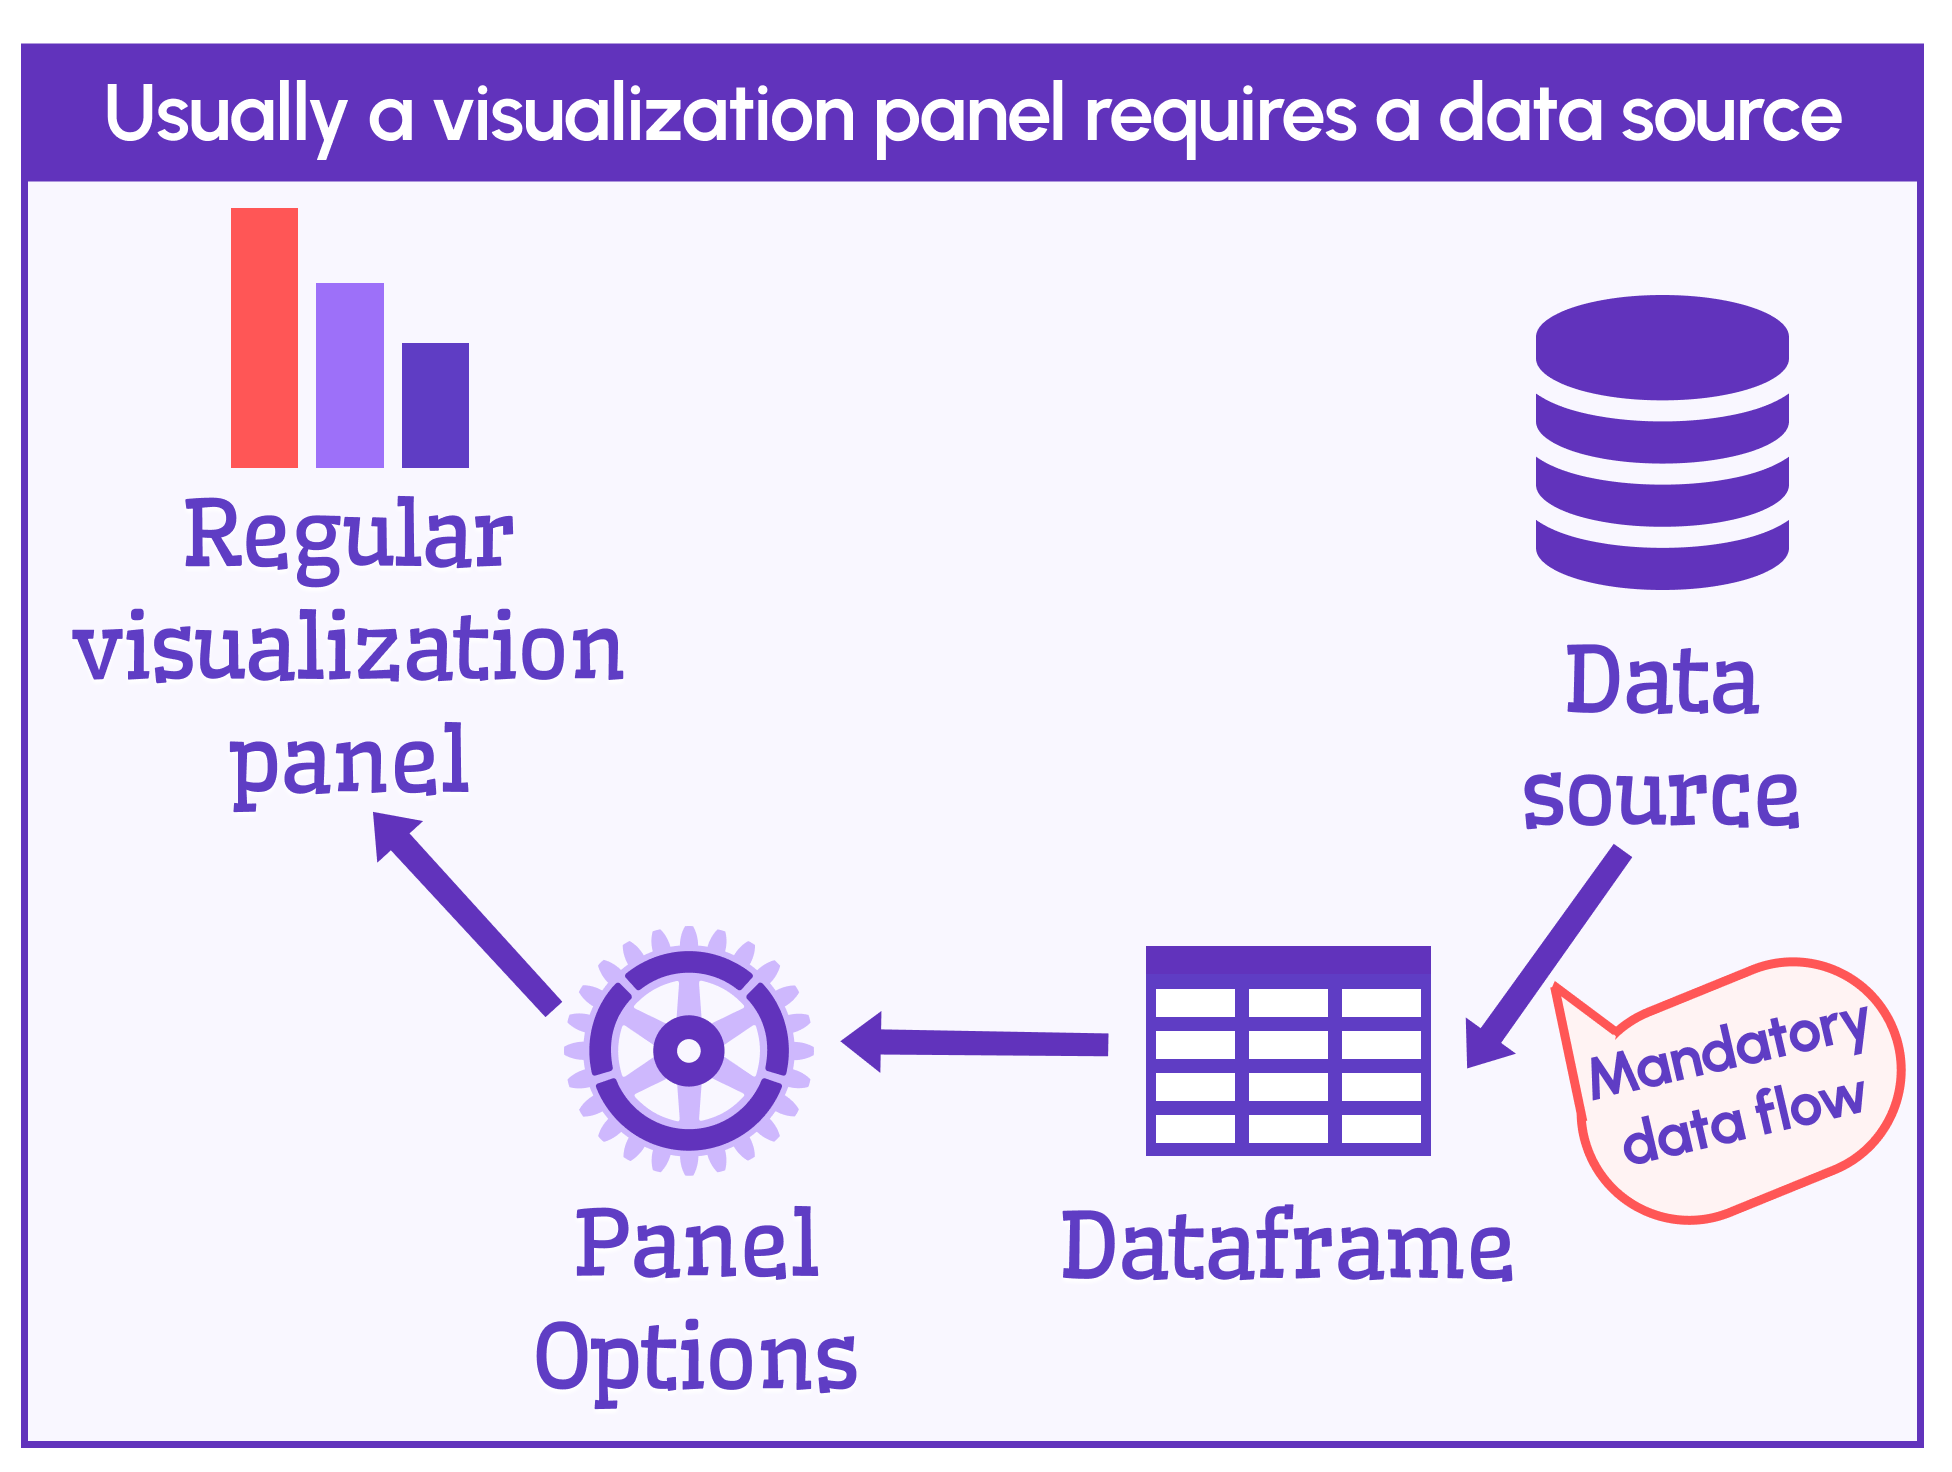
Below are two schemas for comparison. The first one highlights the data flow for any regular Grafana visualization panel. Usually, a panel requires a data source that would fetch the data for further display by the panel.
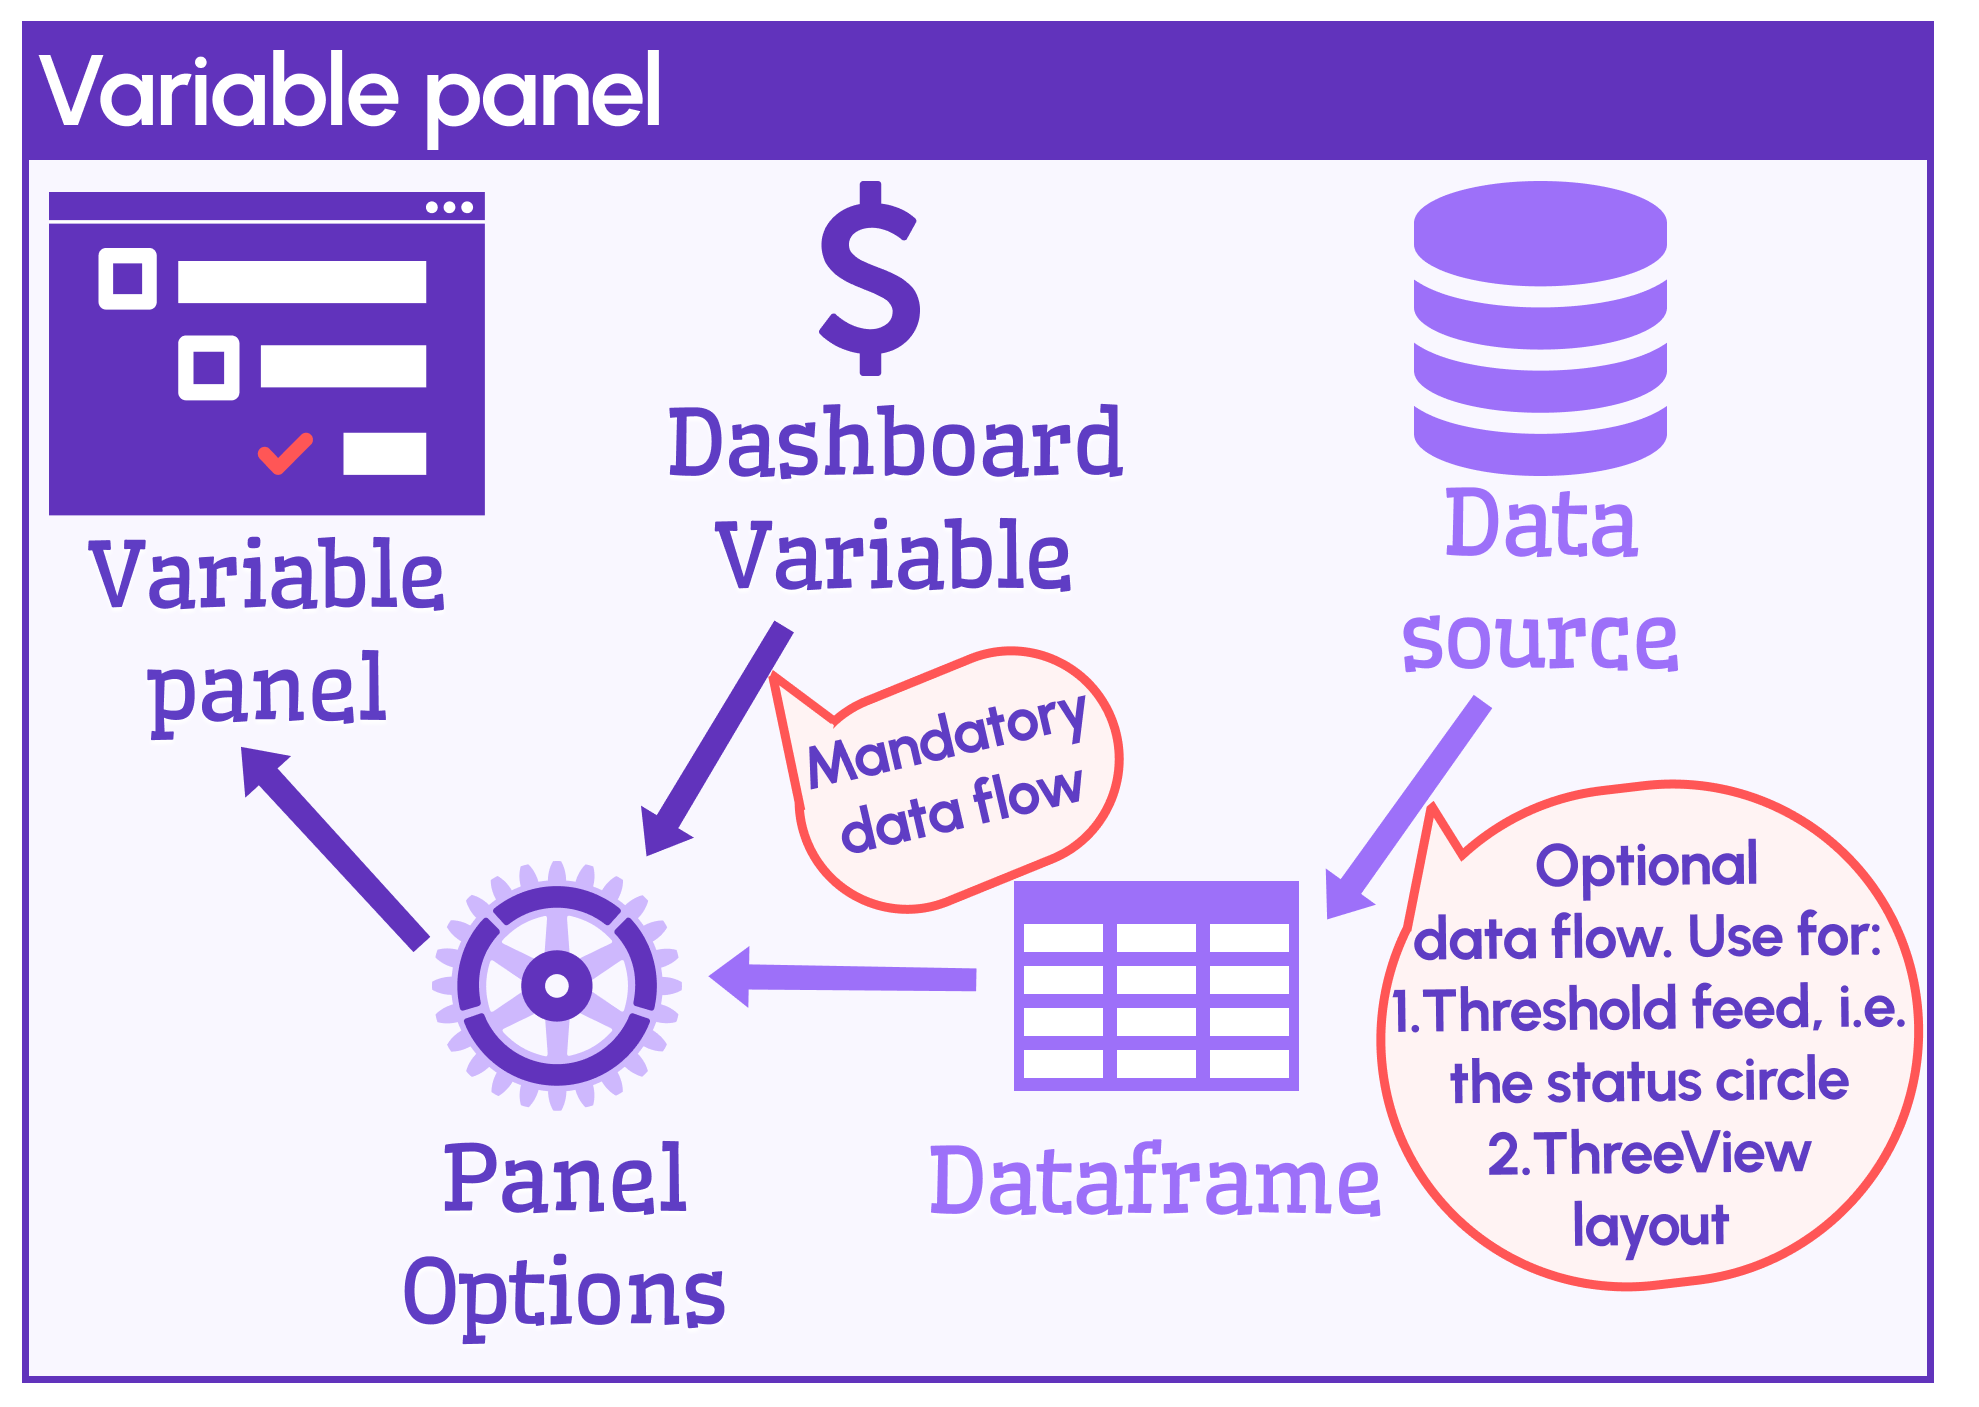
The Business Variable panel does not require a data source. It works with your dashboard variable which already is a set of values. So, in a way, the Business Variable panel uses your dashboard variable as a data source.
However, optionally, the data source can be used for two purposes:
- First, for a color status next to your variable, you need a numeric value to evaluate using thresholds.
- Second, for the TreeView format, ensure to provide node relation via the connected data source.