Thresholds
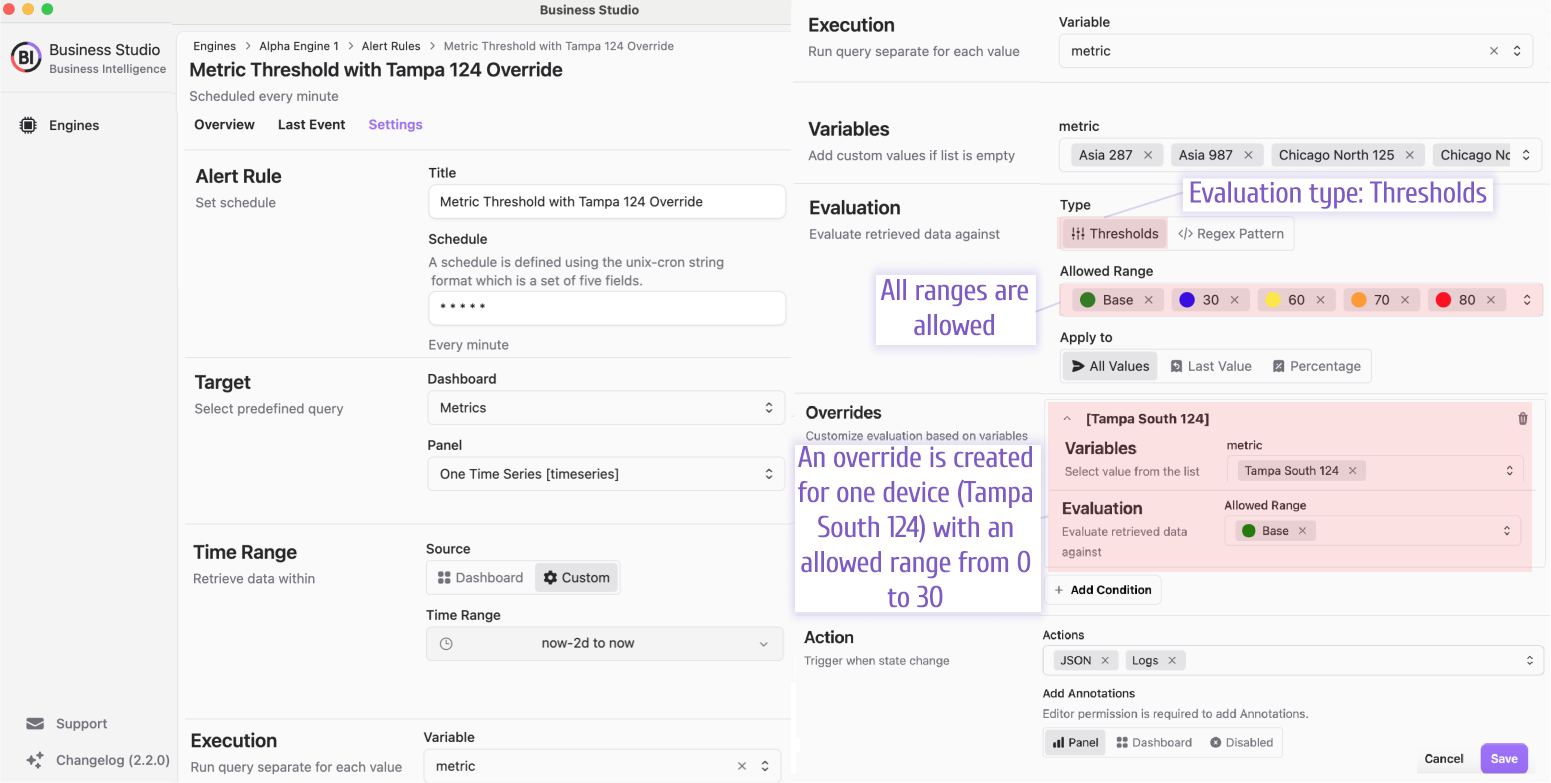
To support higher high and lower low ranges, we pointed the Business Alerting to the Thresholds color for reading the allowable range of data. The Business Engine uses the Thresholds colors as a guide in the creation of alert records and calls the assigned actions.
The allowable range of data is a way to set what is normal, not requiring anyone's attention. No alerts/actions are needed when the data is within the allowable range.
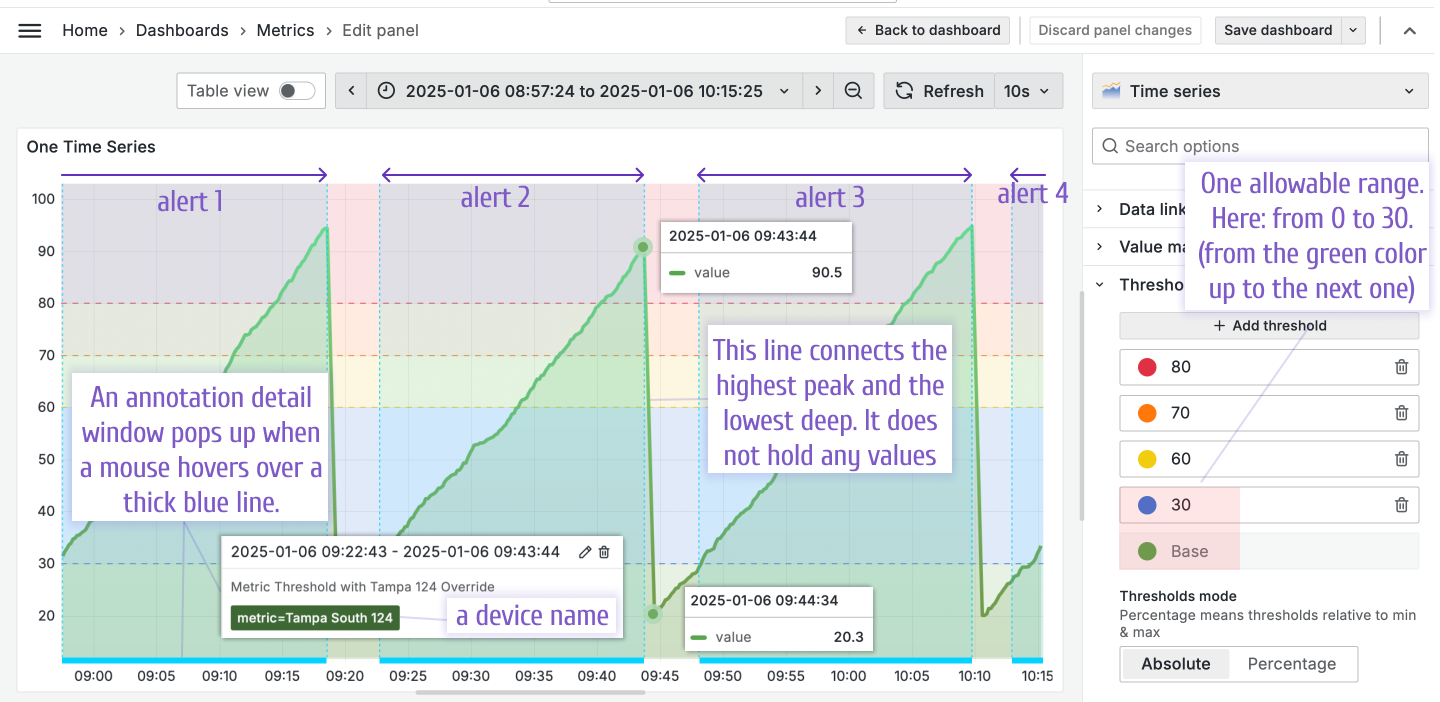
In the illustration below, three alert records have been created due to the data being outside the allowable range four times.

Alert rule configuration
The alert rule configuration in the Business Studio looks as follows.

All devices, except the Tampa South 124, have all ranges of metrics allowed. The Tampa South 124 device generates an annotation when a metric value is above 30.
Annotations
The alert records (annotations) are displayed as light blue highlighted areas on the graph.
The detailed annotation window pops up if you hover a mouse over a thick blue line (as illustrated above).
They highlight all time ranges when the data values (here, it is temperature) went outside the allowable range. In this example, the allowable range is from 0 to 30 (set in the Thresholds category).
Please note that no values (no registered temperature data) exist between the highest peak and the lowest deep on the graph. The temperature changes abruptly from max to min.
- The temperature for all four alerts goes above
30, - For the second alert, it goes up to
90.5degrees (illustrated with a tooltip).
Annotations ranges
Depends on the Apply to evaluation parameters annotations will be created as a range or a single line.
Evaluating using All value or Percentage will create an annotations range.