Getting Started
The Business Intelligence platform leverages Docker containers for modularity and scalability. This guide presents a comprehensive setup that integrates the platform with additional tools to simulate a near-real-world scenario. For a simpler introduction, refer to the Quick Start section.
Follow these steps to replicate this setup in your environment, then adapt as needed.
The Business Engine requires Grafana 11. The platform maintains compatibility with the latest Grafana version.
Solution Overview
Once configured, this solution provides:
- Business Studio: A central interface to manage Business Engines, alert rules, actions, and configurations
- Grafana Instance: Preconfigured with three dashboards:
- Business Engine performance metrics
- Two dashboards for production data
Tutorial Video
Daria walks through the installation process and demonstrates creating your first alert action and linking it to an alert rule.
Docker Containers
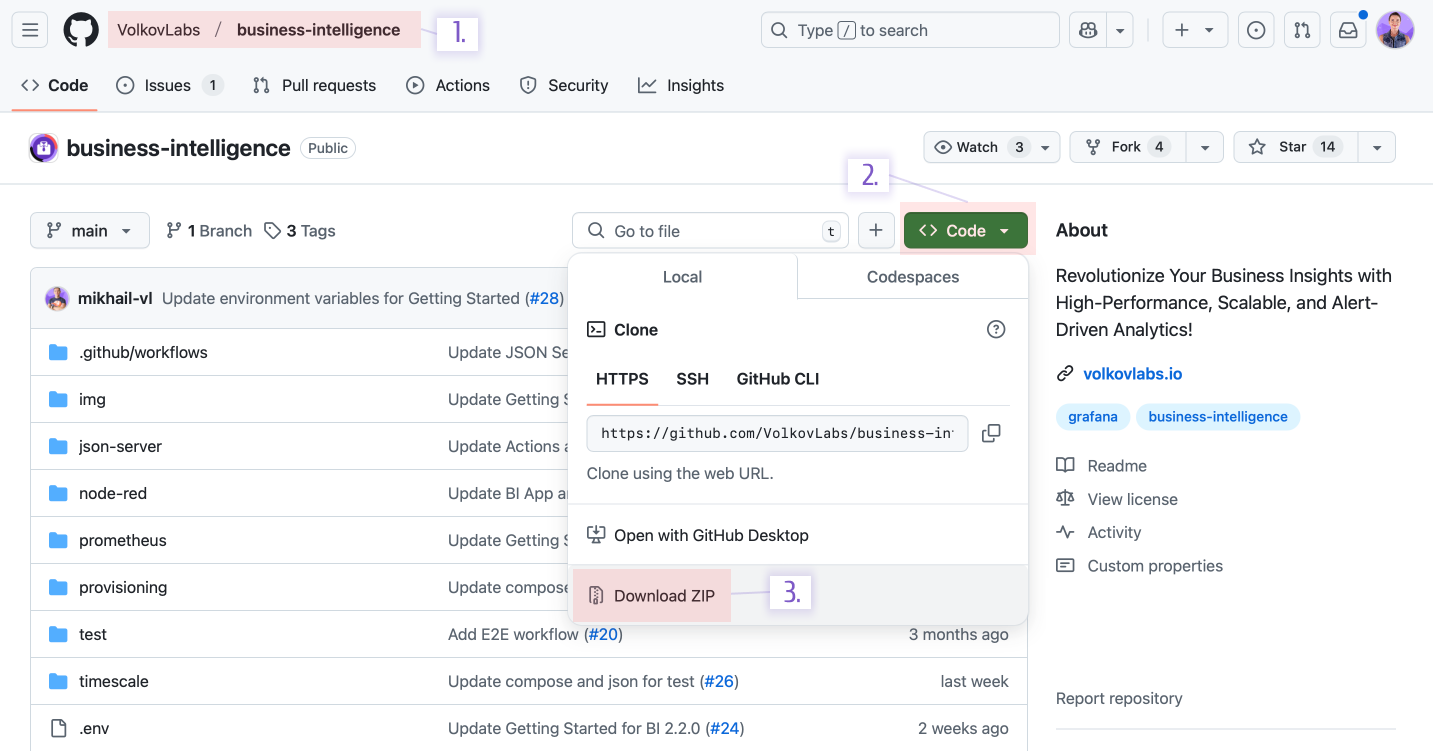
Download all required Docker containers configuration from the GitHub repository.
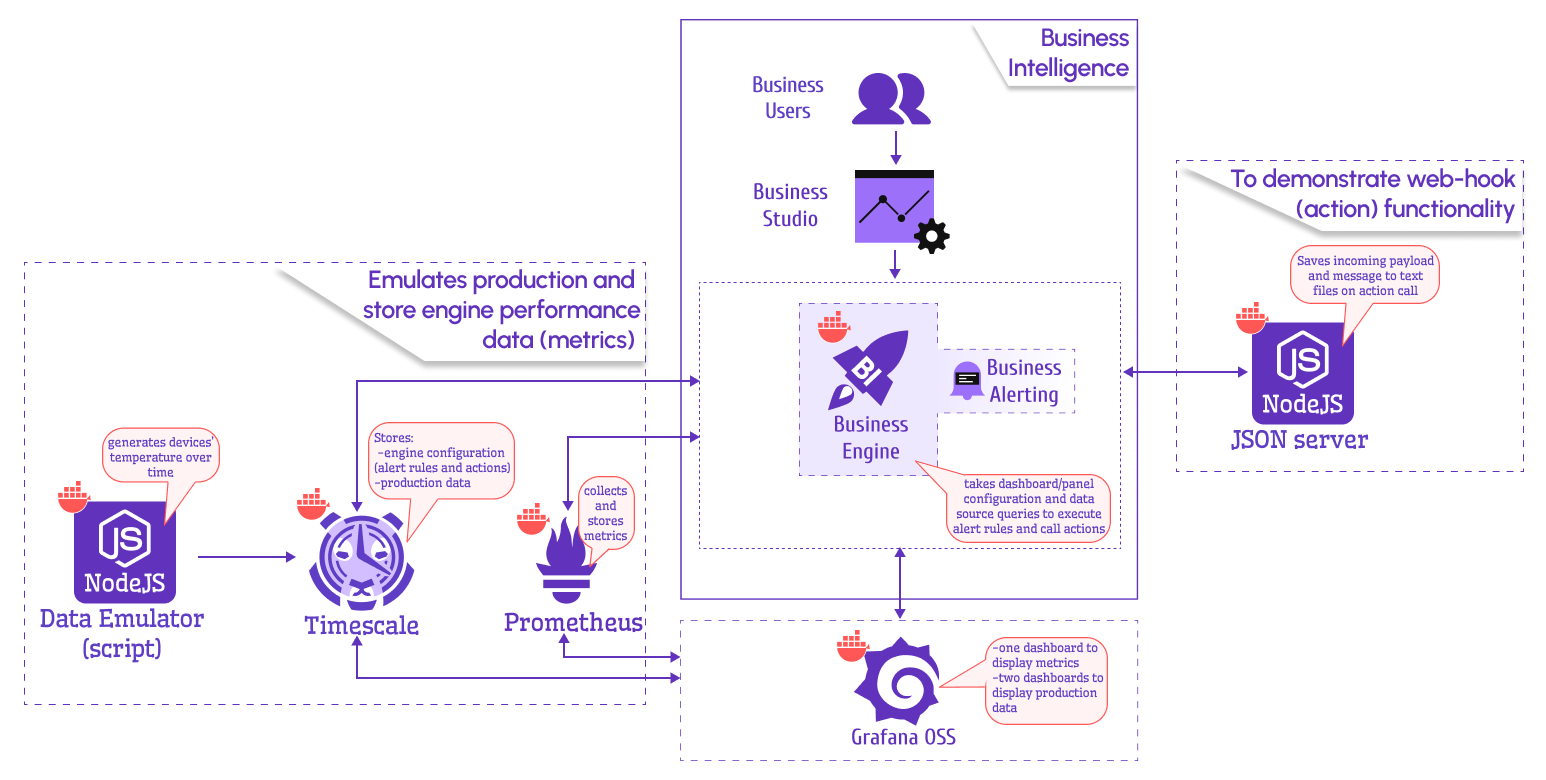
The downloaded package includes a docker-compose.yml file with these containers:
- Grafana: Preprovisioned with dashboards and data sources
- Timescale: Stores Business Engine configuration and production data
- Data Emulator: Node.js script generating sample production data, also demonstrating variable functionality
- Prometheus: Collects and stores Business Engine performance metrics
- JSON Server: Node.js-based action example, saving alert payloads to files
- Business Engine: Uses a service account token to access Grafana HTTP APIs, evaluate alert rules, and trigger actions
Here’s the docker-compose.yml file for reference (no need to copy—it’s in the downloaded package):
loading...
Starting the Platform
After downloading the package, navigate to its directory and follow these steps.
Grafana
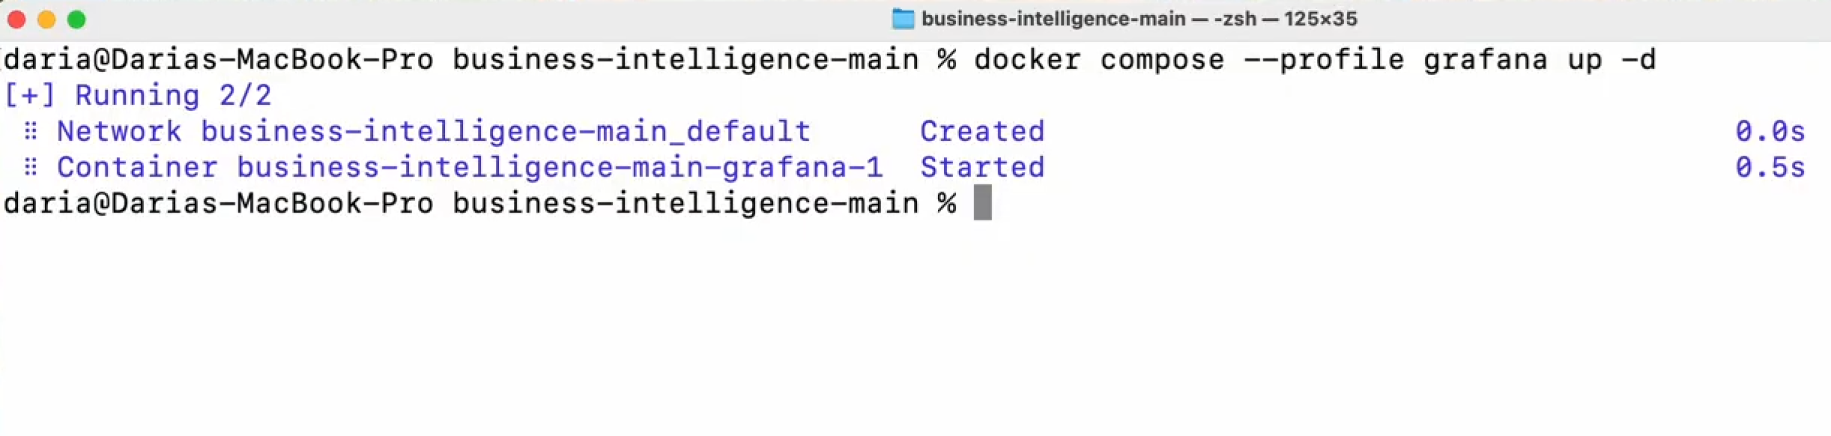
- Launch the Grafana container:
docker compose --profile grafana up -d
-
Access Grafana at:
http://localhost:3000Log in with username
adminand passwordadmin. -
Create a service account with
ViewerorEditorrole (Editorenables annotations):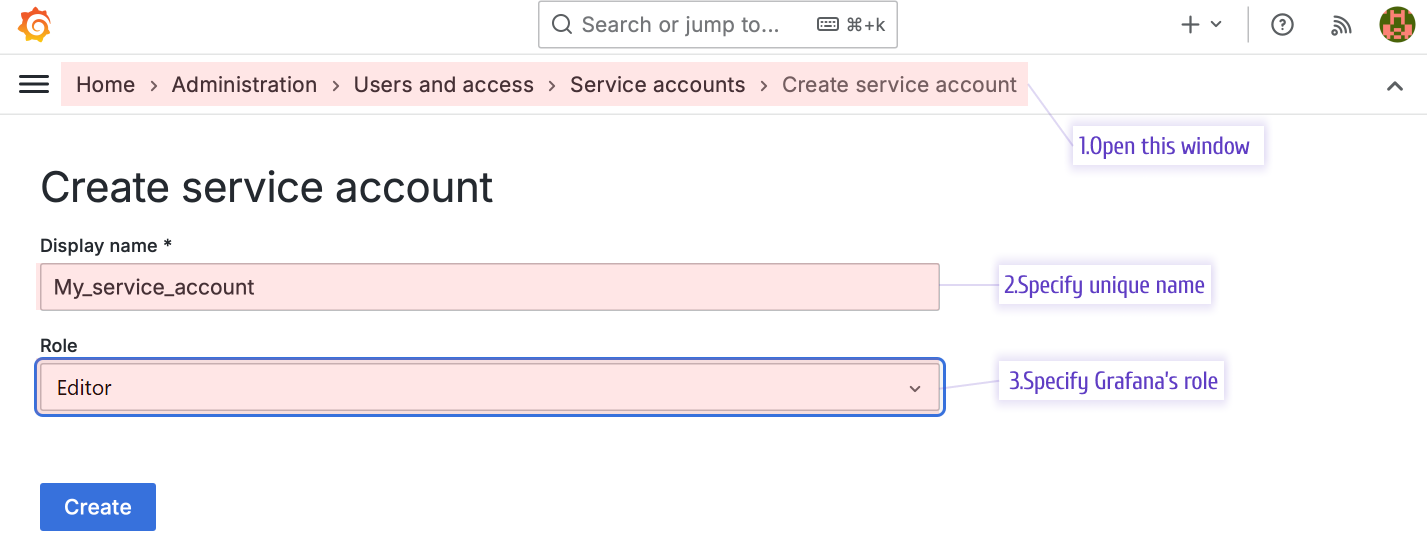
Create a Service Account -
Generate a token:
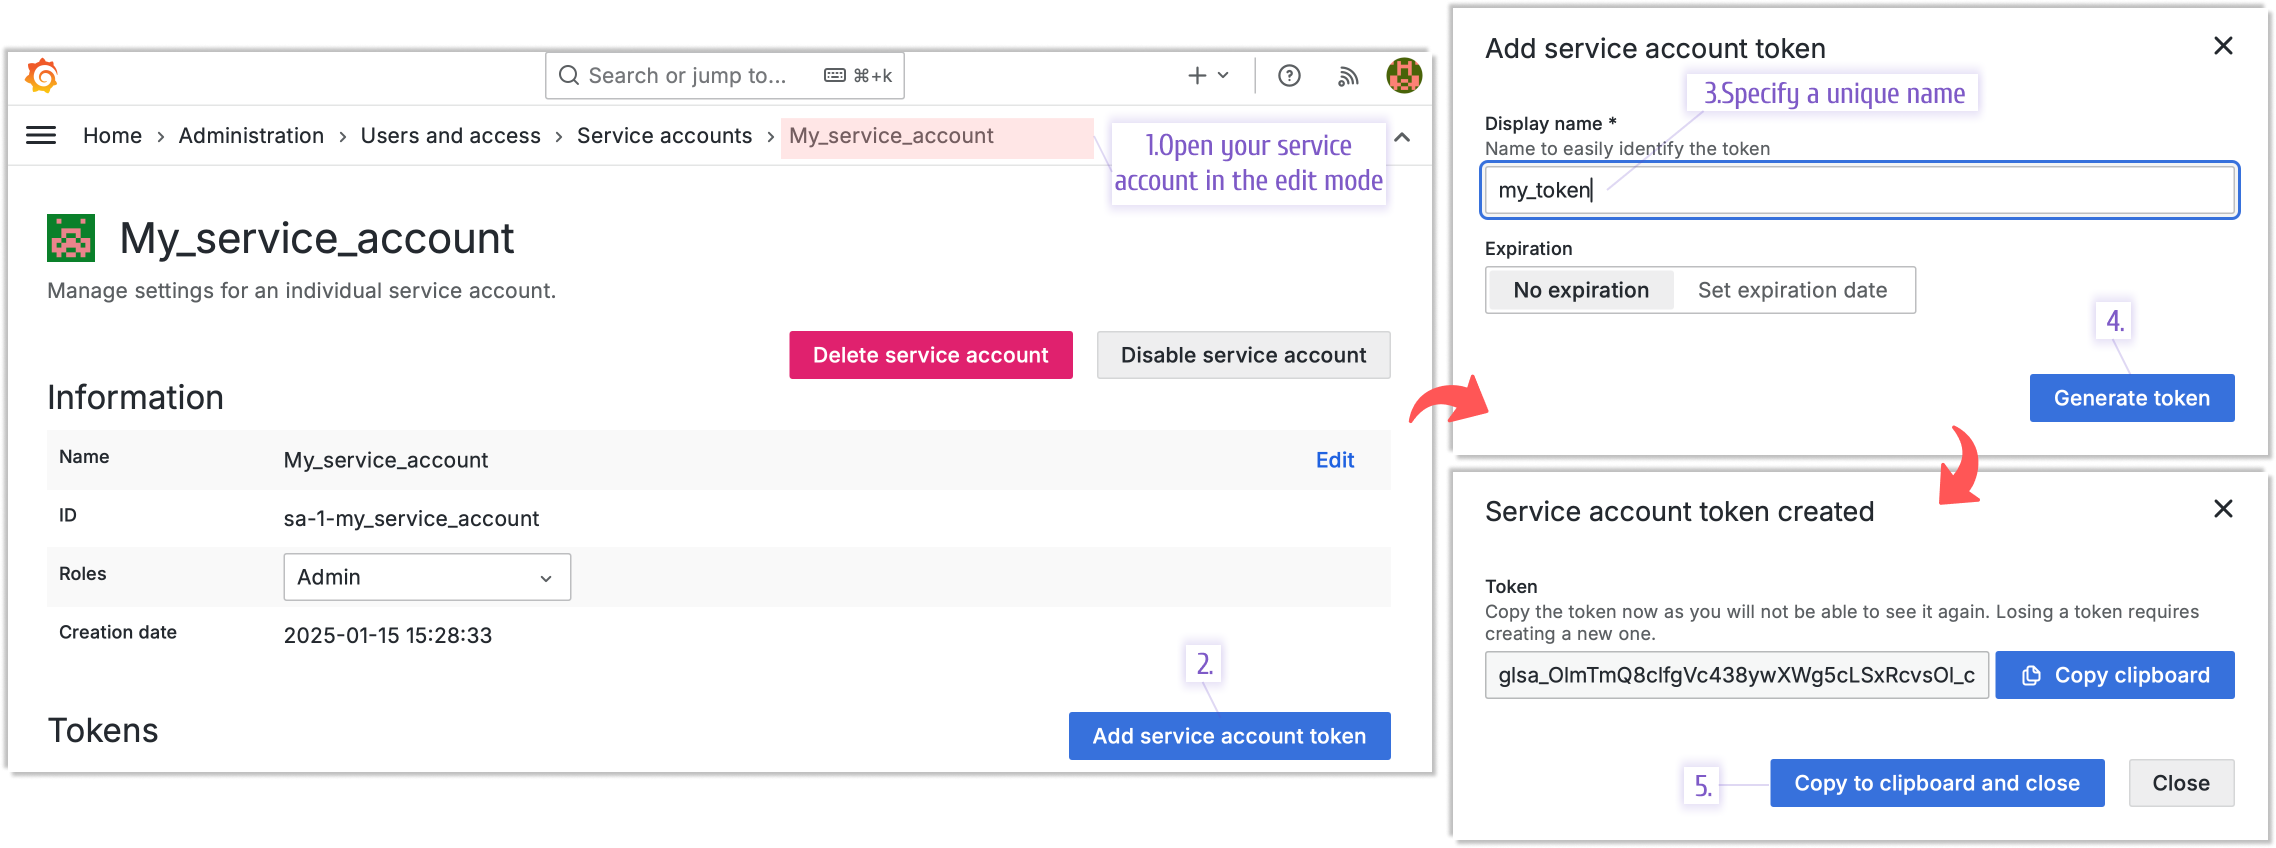
Generate a Service Account Token -
Update the
GRAFANA_TOKENindocker-compose.yml: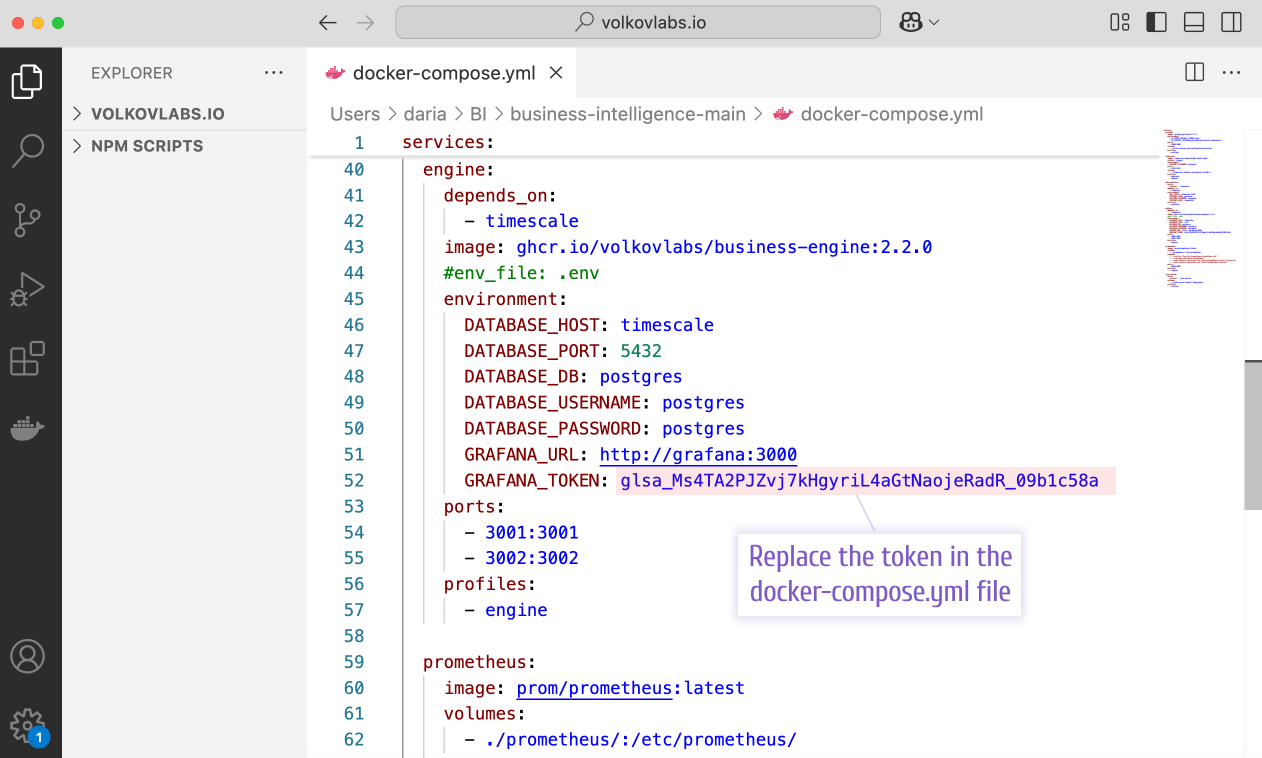
Update GRAFANA_TOKEN in docker-compose.yml
Starting with version 2.4.0, configure Grafana token and URL directly in Business Studio, bypassing environment variable edits.
Business Engine, Timescale, and Prometheus
- Start these containers using the
engineprofile:docker compose --profile engine up -d
JSON Server (Optional)
- Launch the JSON Server to test action triggers (optional, but recommended):
This enables saving alert payloads to log files, explored later.
docker compose --profile actions up -d
Business Studio
- Download Business Studio from the Release Notes, then install and open it.
Working with the Platform
Business Studio
Configure actions and alert rules:
- Set up an HTTP Request Action using
http://json-server:3000(if started) to log events and messages - Use the preprovisioned
Test Dashboardto create alert rules with thresholds and regex patterns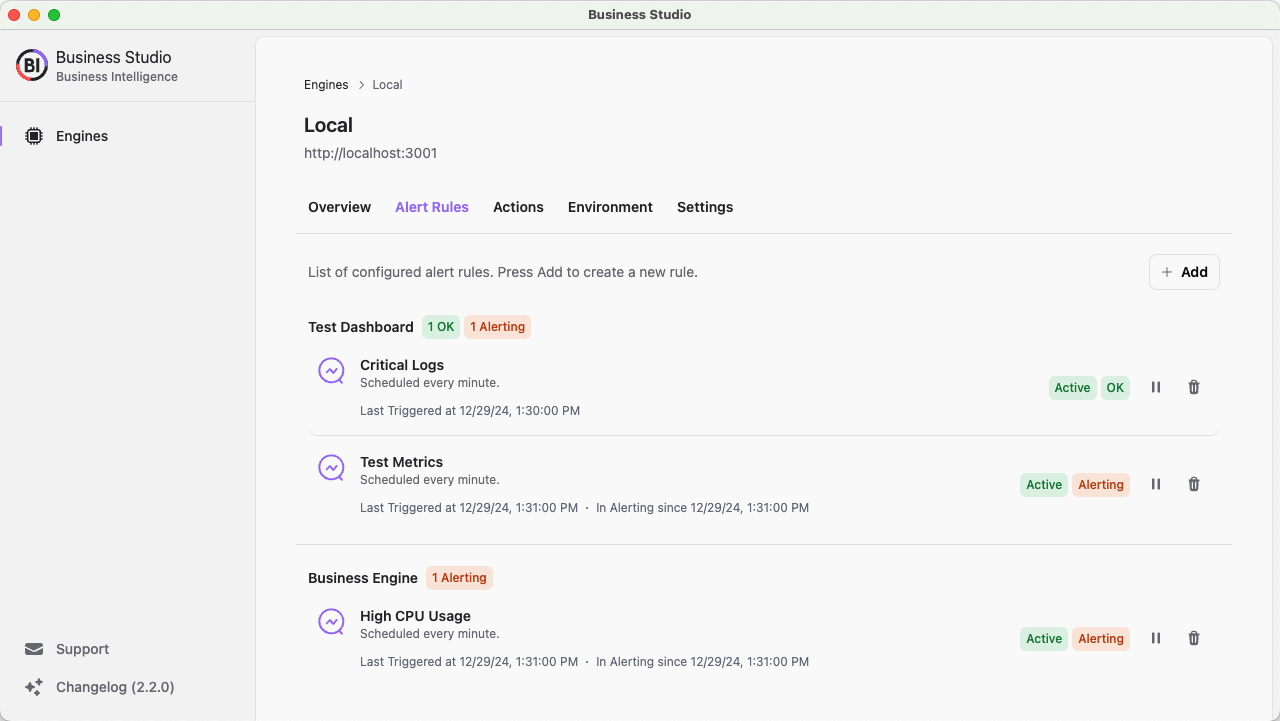
Alert Rules Configured via Business Studio
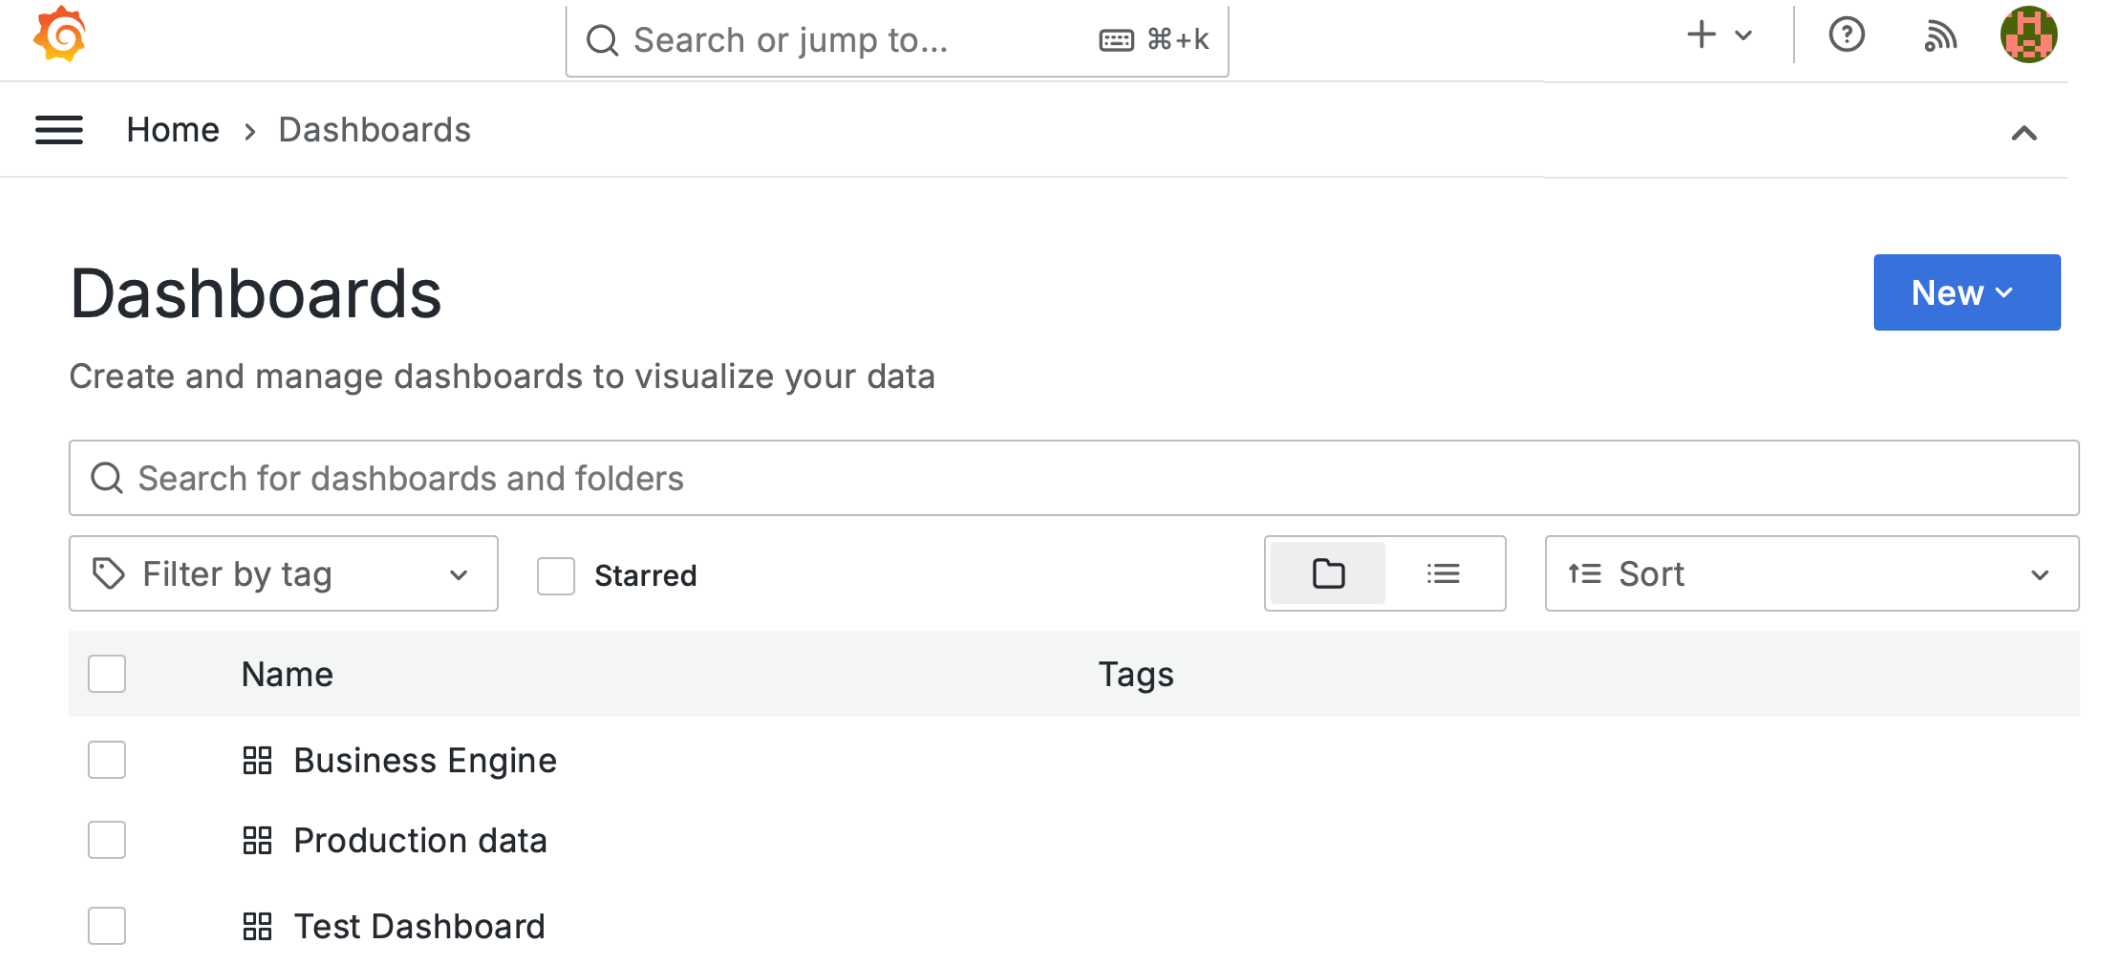
Grafana Dashboards
Access three preprovisioned dashboards in Grafana:
Business Engine Dashboard
Displays metrics collected by Prometheus, filterable by instance and alert rule variables:
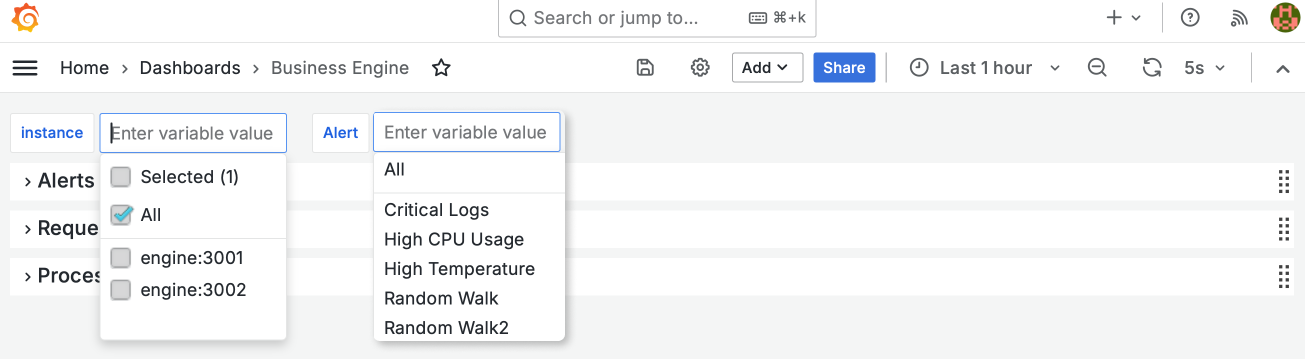
Rows of Analytics:
-
Alerts:
- Alert Results
- Alert Latency
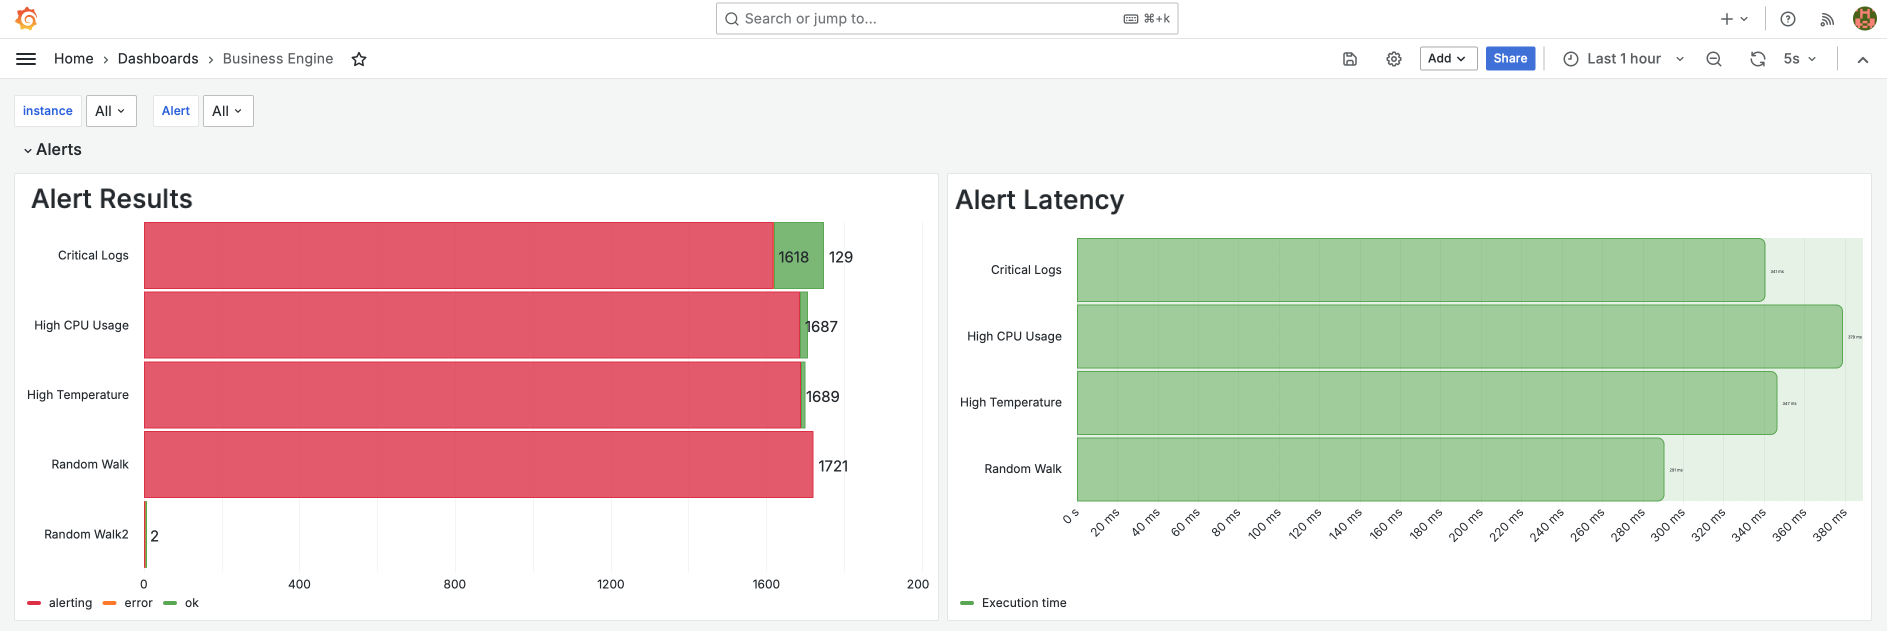
Alerts Analytics
-
Requests:
- Business Engine API Requests
- Business Engine Latency
- Grafana API Requests
- Grafana Latency
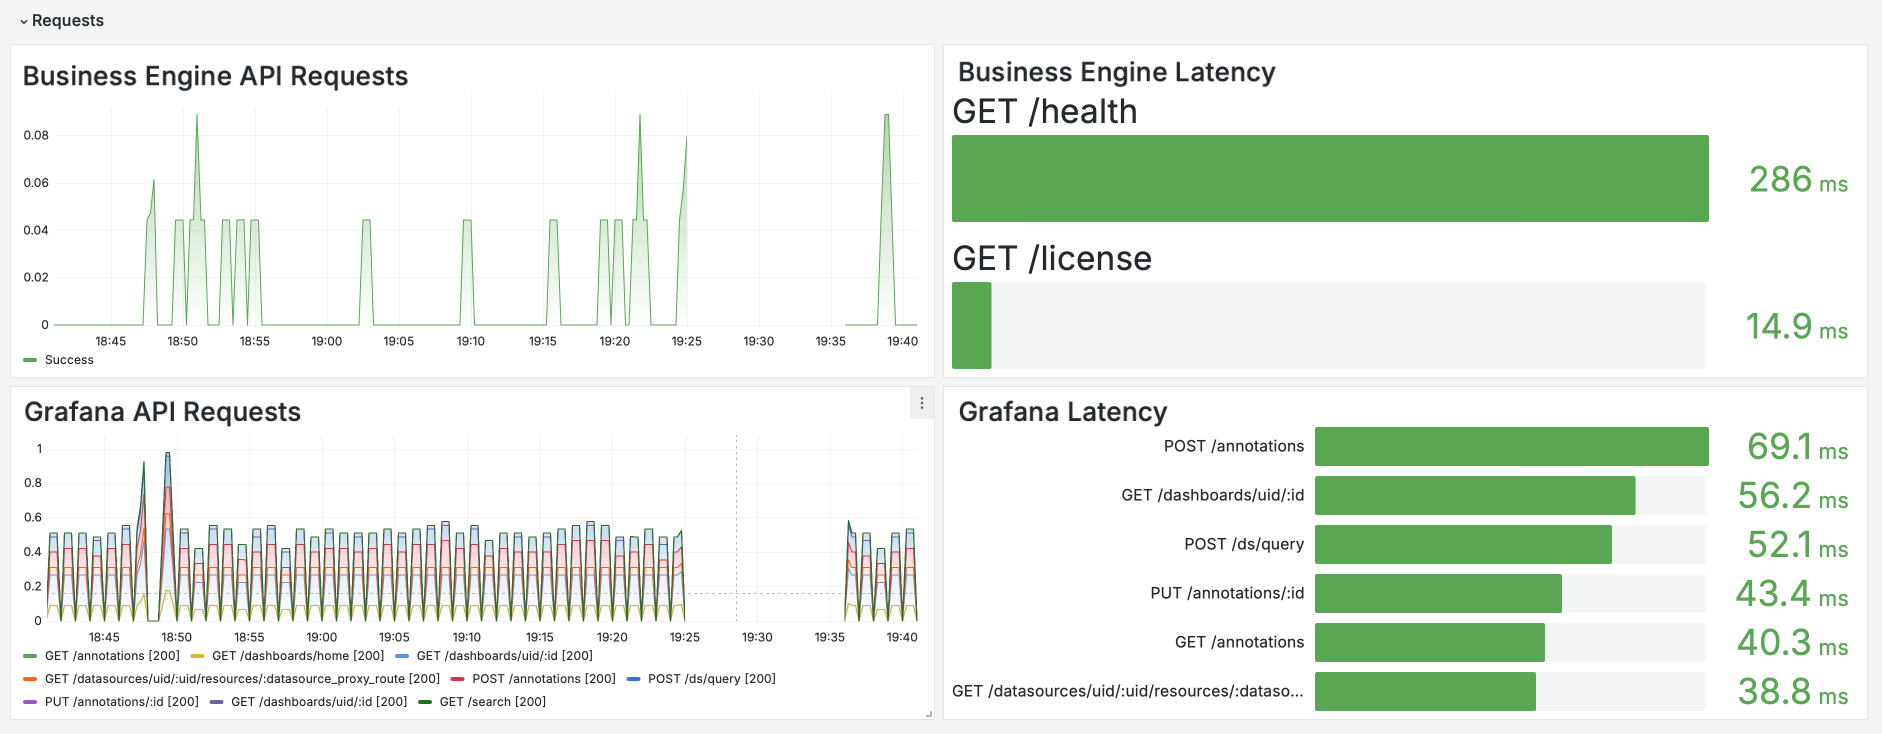
Requests Analytics
-
Processes:
- CPU Usage
- Event Loop Lag
- Memory Usage
- Active Handlers/Requests Total
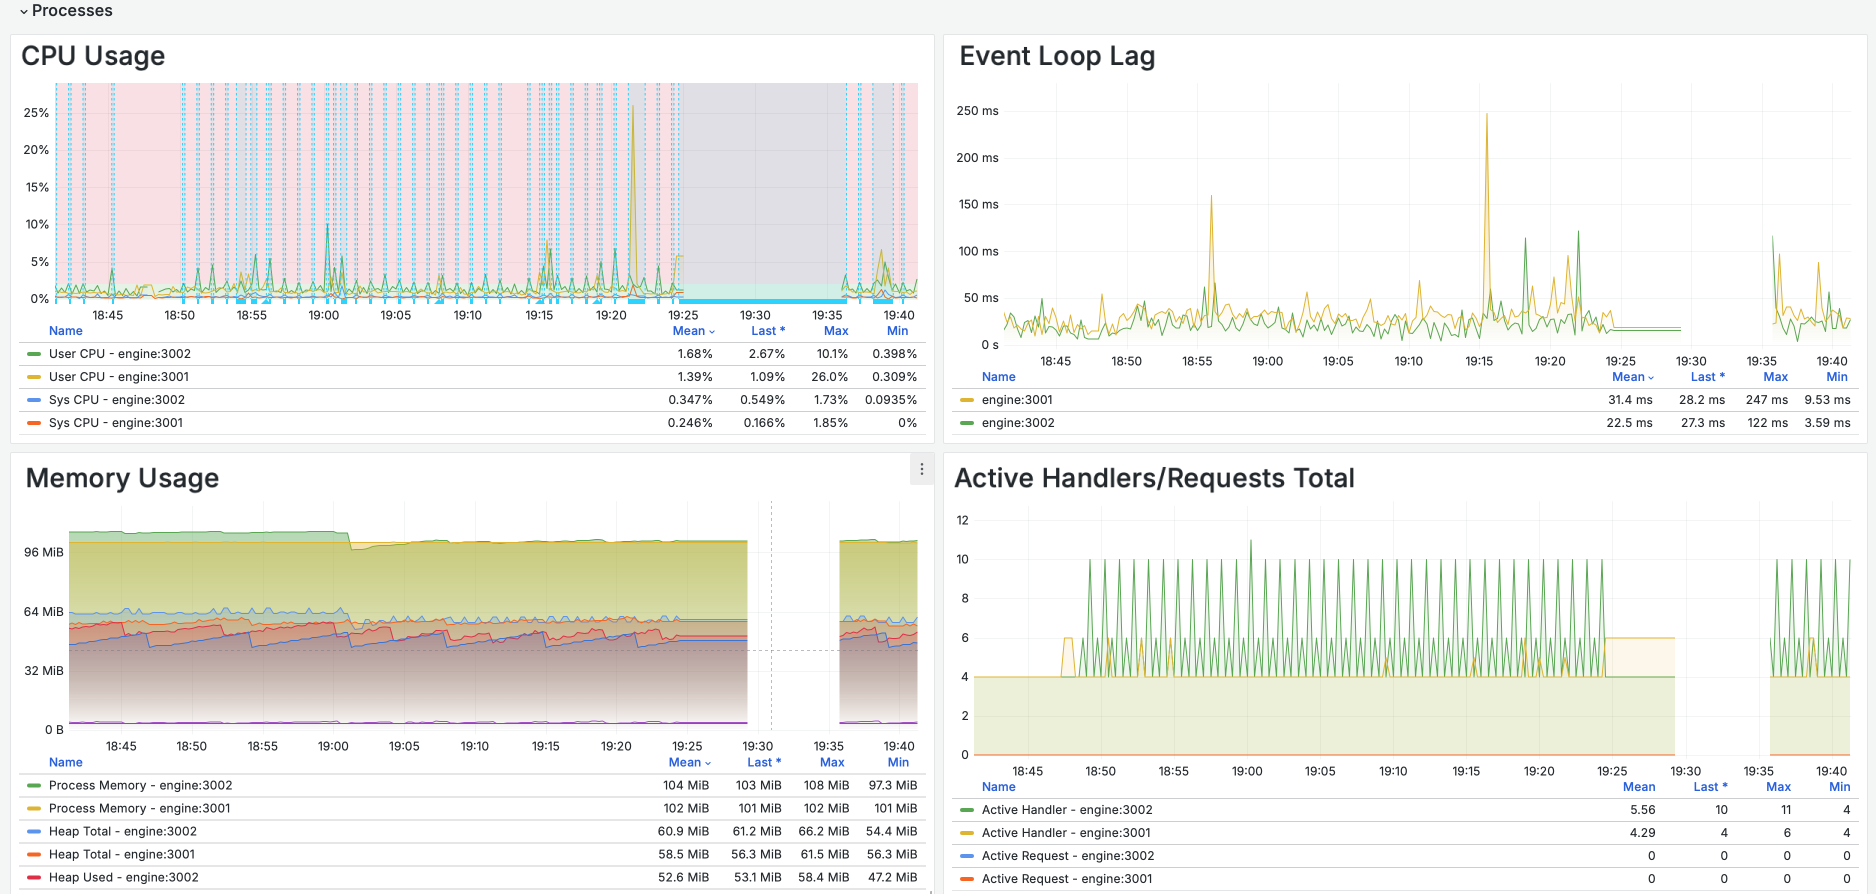
Processes Analytics
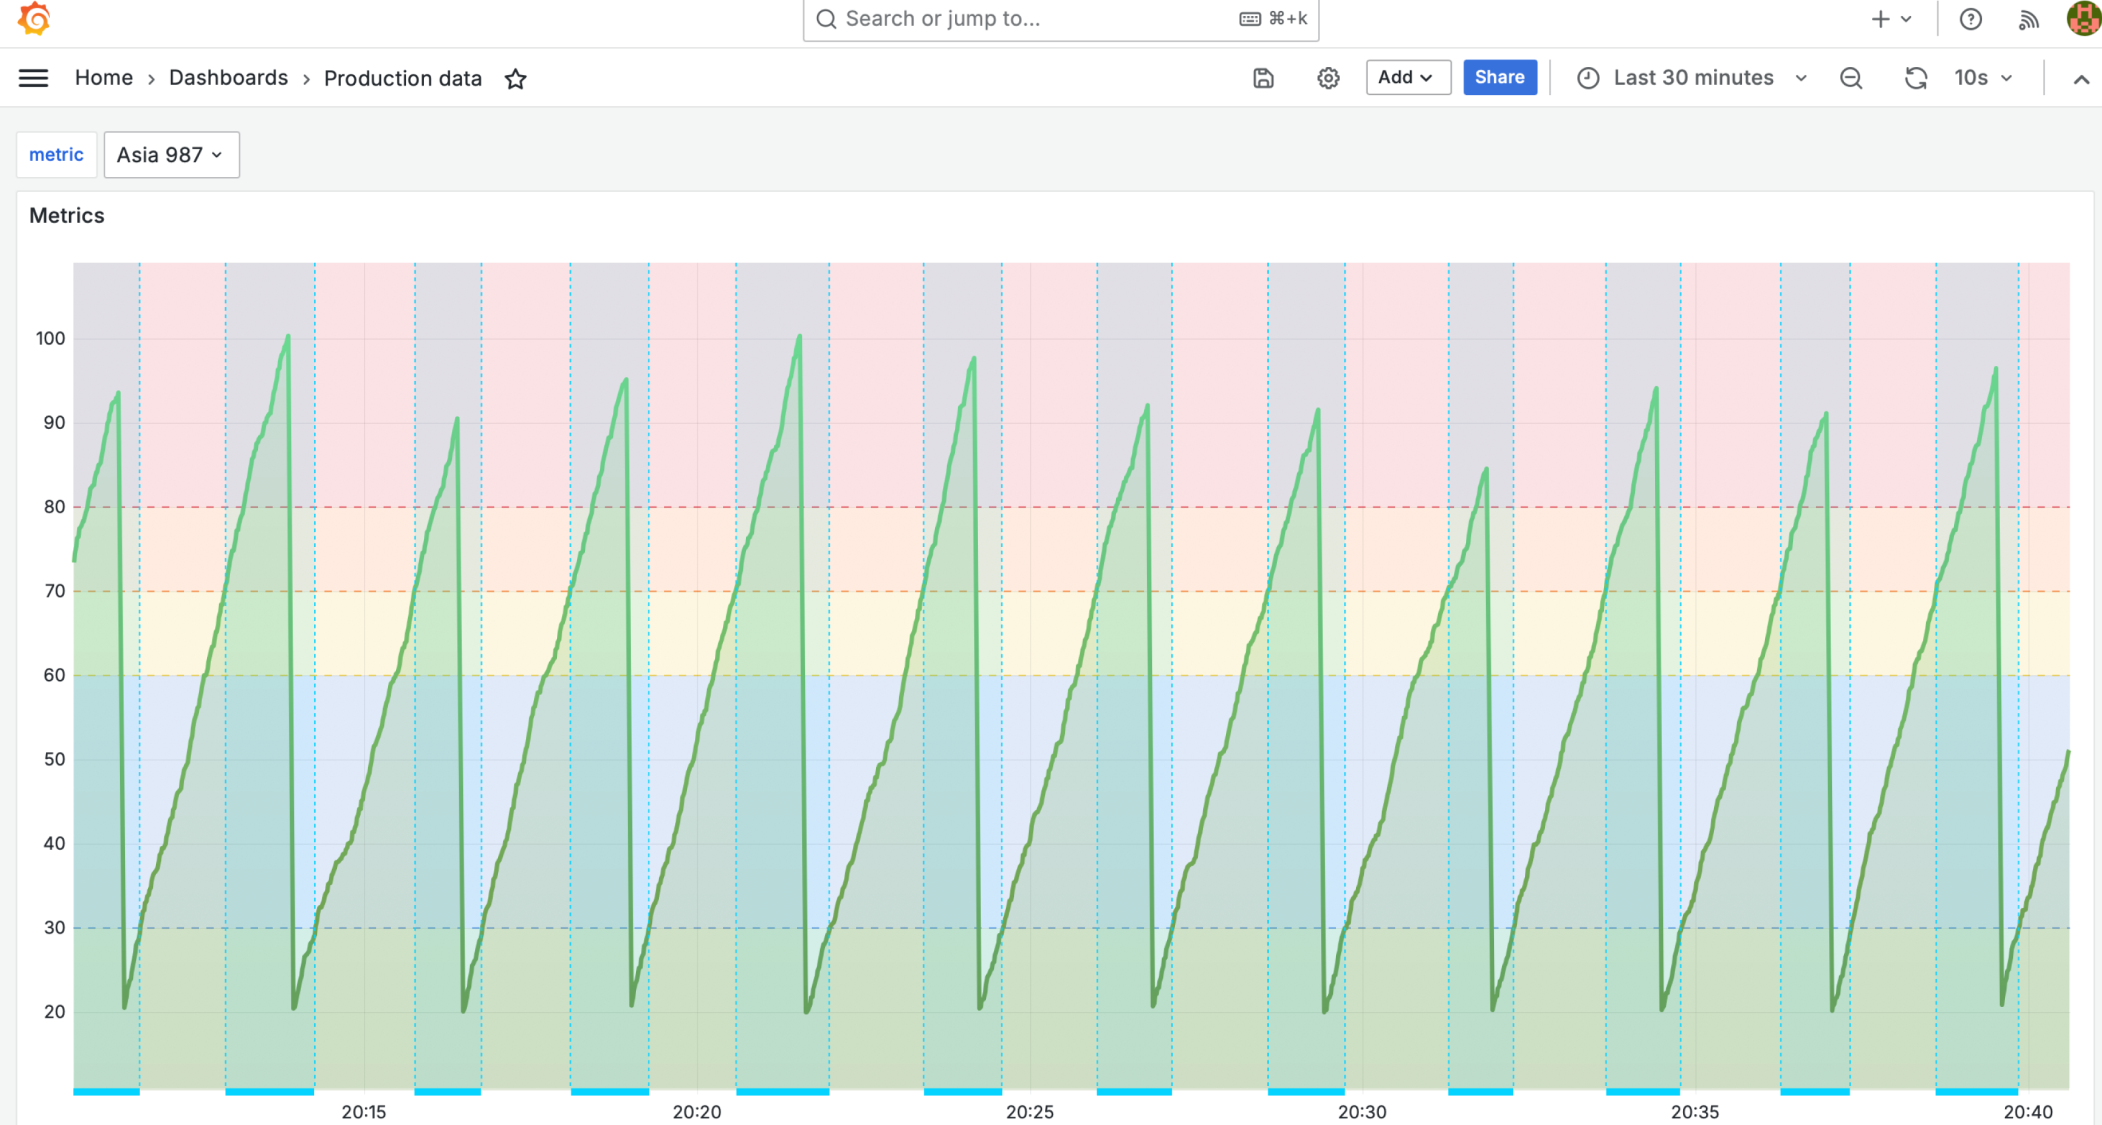
Production Data Dashboard
Features a time-series chart of device temperatures from the Data Emulator, switchable via the metric variable. Thick blue lines mark alert triggers, with actions logged by the JSON Server.
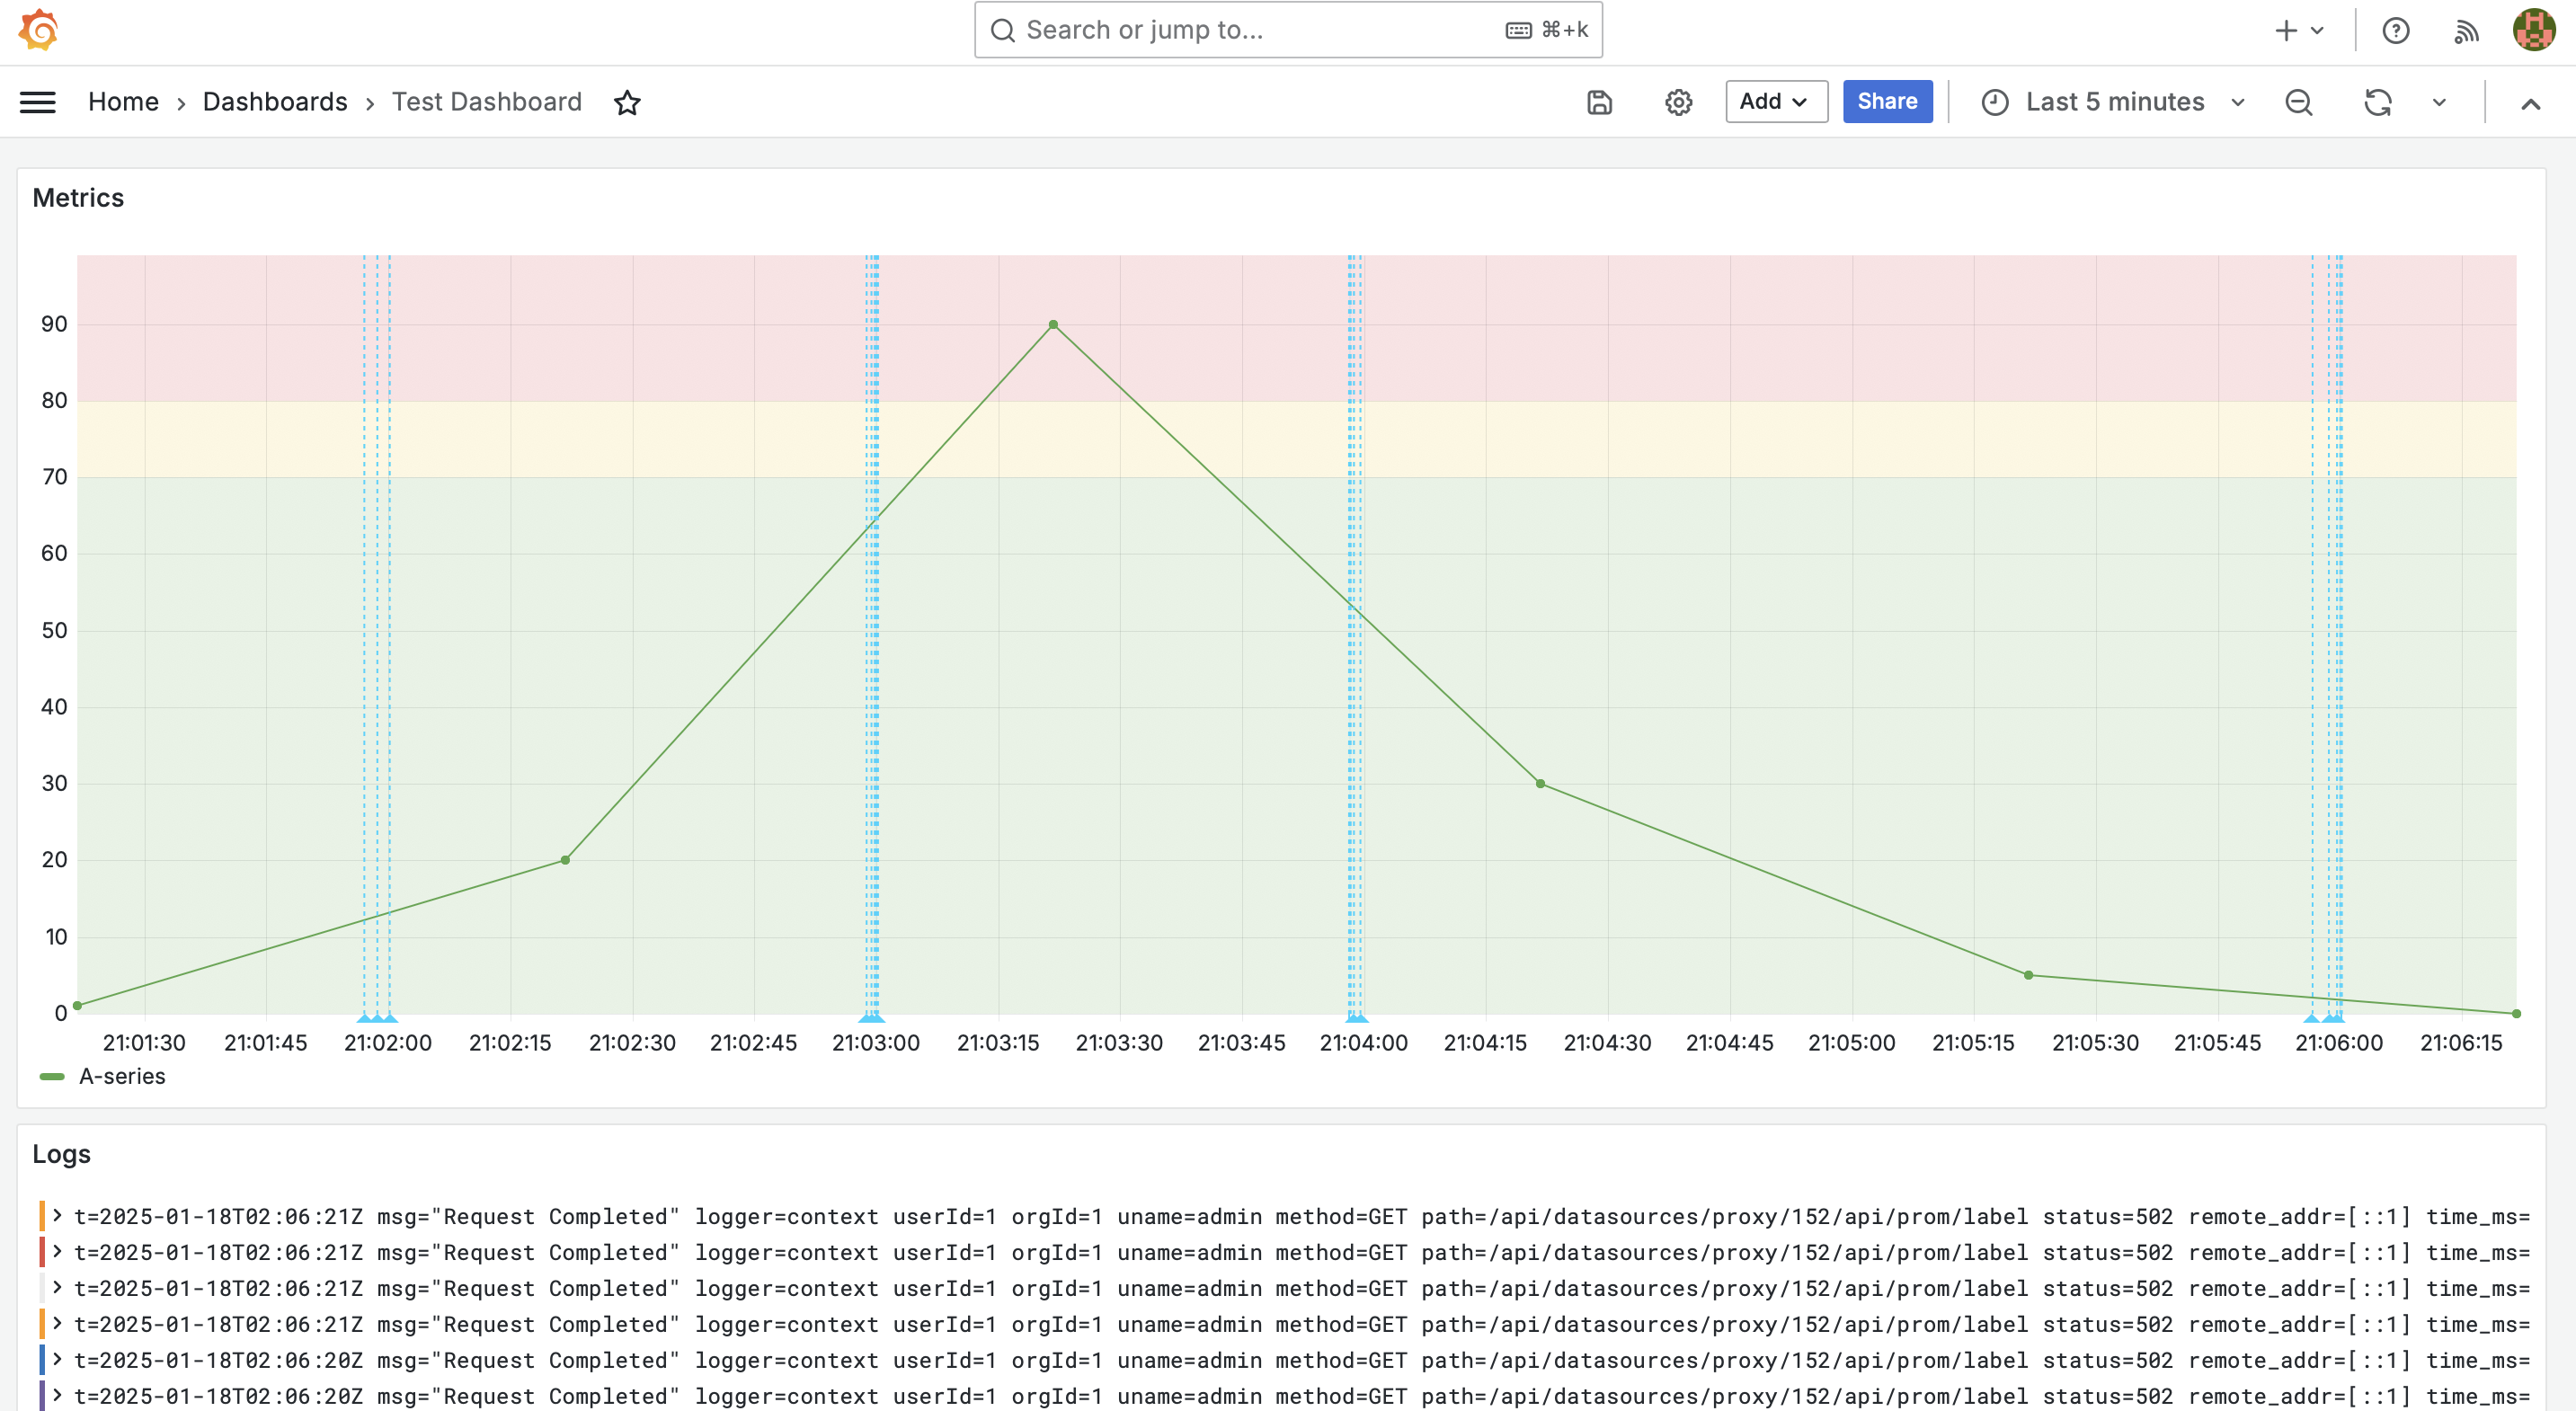
Test Dashboard
Includes a time-series chart and a log chart:
Stopping the Platform
To stop and remove all containers:
docker compose --profile engine down
docker compose --profile actions down
docker compose --profile grafana down