Maps breaking changes, examples, and documentation updates in Business Charts 4.0.0

We are happy to announce the release of the Business Charts panel 4.0.0. This release includes the following updates:
- Introduced breaking changes with loading GeoJSON maps, which are disabled by default.
- Documentation and examples were updated and moved to our documentation and Plugin Examples.
We are very excited about the new release and will continue improving the plugin by adding support for annotations and custom themes.
Getting Started
You can install the Business Charts panel from the Grafana Plugins catalog or using the Grafana command line tool.
For the latter, please use the following command.
grafana cli plugins install volkovlabs-echarts-panel
Tutorial
This is the first video we created about Business Charts after the plugin rebranding. It features dazzling chart examples followed by a high-level plugin architecture. Knowing the basics of plugin architecture will help you create your custom charts.
To get you started quicker we prepared the web resource with numerous ready-to-use examples. In the video, Daria demonstrates how to work with this resource.
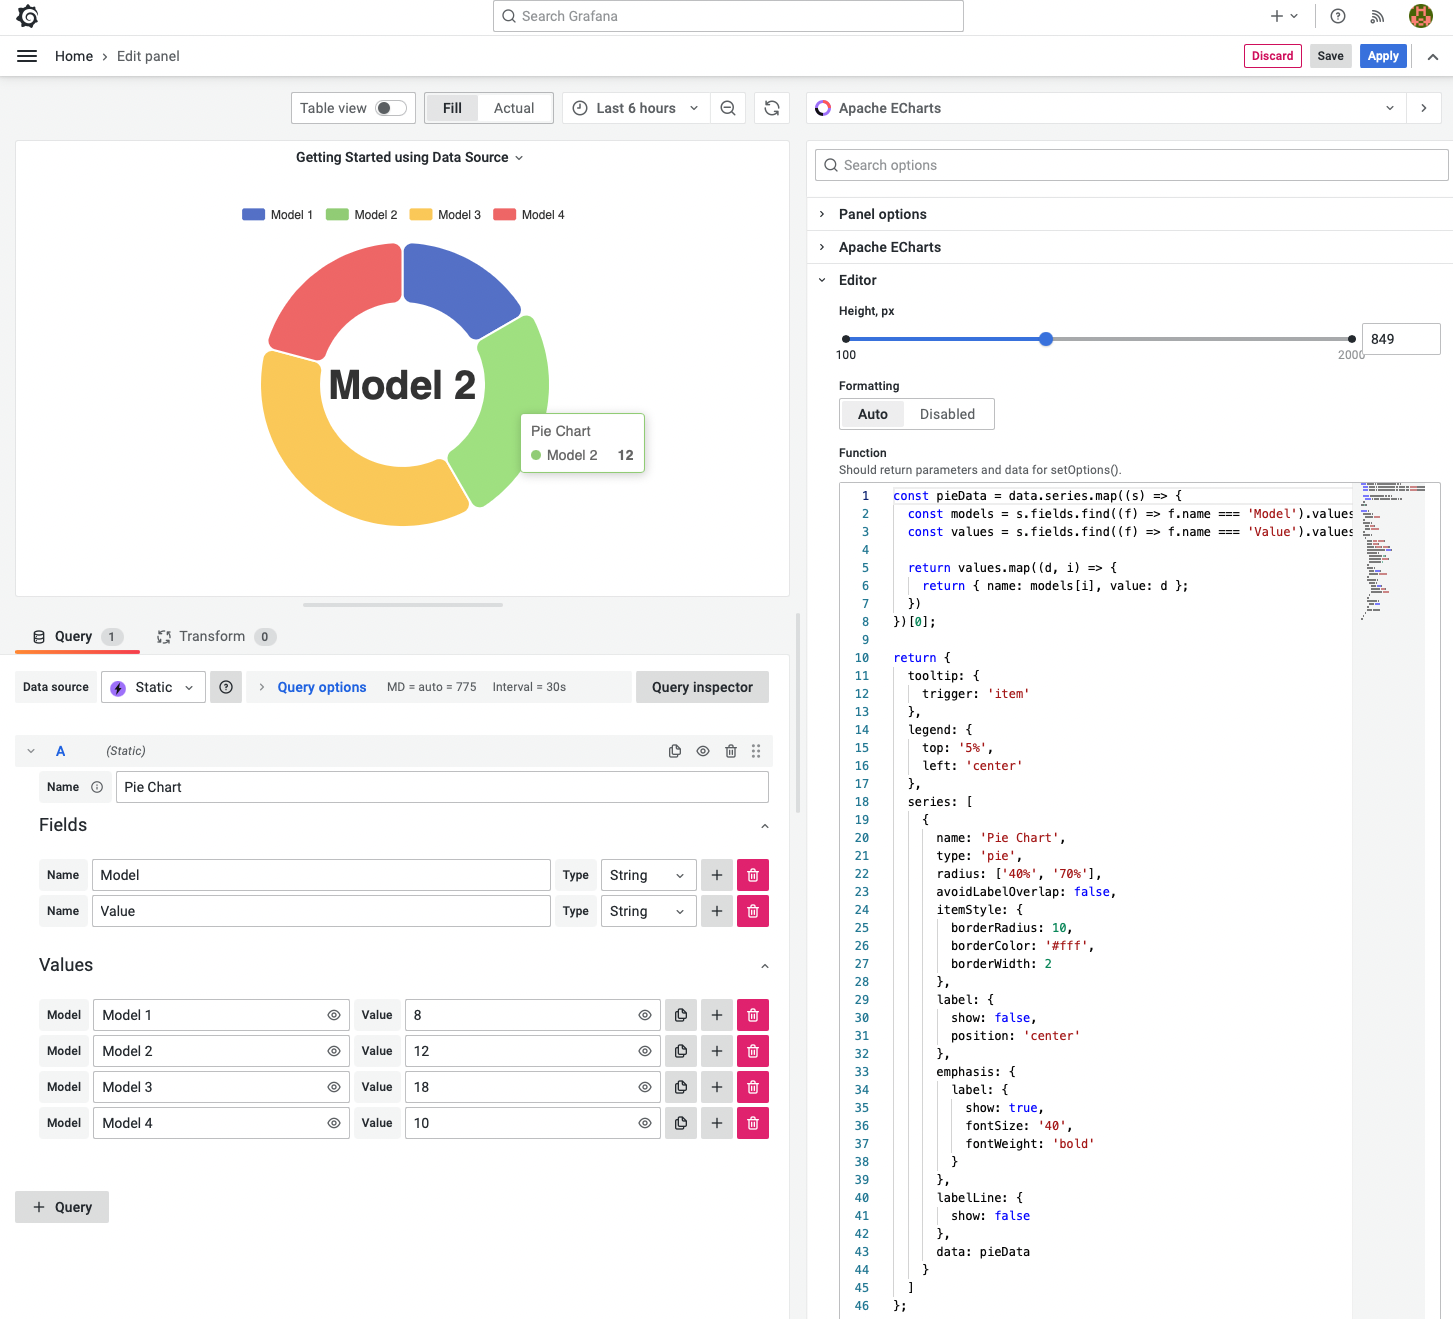
The main obstacle for many plugin users is the data transmission from the Grafana data frame(s) into the Charts function. In the video, in addition to the resource with how-to examples, Daria introduces the Visual Editor - the mechanism we started to work on to simplify the transmission.
We have many other tutorials that you can find helpful. You can review all related to this plugin tutorials here.
Release Notes
- World and U.S. GeoJSON maps are not loaded by default. Please select
JSONin the Maps option.
Features / Enhancements
- Update ECharts Examples at https://echarts.volkovlabs.io (#103).
- Added the Calendar examples at https://echarts.volkovlabs.io (#105).
- Updated the README file and moved the product documentation to the documentation site (#107).
Bug fixes
- Fixed JavaScript code in the product documentation (#102).
Volkov Labs Is Now Closed
Following our acquisition, Volkov Labs has officially ceased operations as of September 26, 2025. We are no longer accepting feedback, support requests, or partnership inquiries. The Business Suite for Grafana repositories have been archived on our GitHub organization, and no further development or support will be provided.
We are deeply grateful for the incredible support from our community and partners over the past four years.