Panels interconnectivity in Grafana via EventBus


When I started working with Grafana, I was stunned by its simple yet genius architecture that allows infinite flexibility. The possibilities where your imagination is the limit inspire you to create. In this article, I share one of many ways to combine different Grafana parts to solve a very particular problem - the panels' interconnectivity.
Allow me to elaborate. By default, Grafana panels operate independently, each residing in its own module, oblivious to the others. Yet, in numerous scenarios, the actions on one panel necessitate a reaction on another. This demand often coincides with the need for data synchronization across multiple panels (for instance, when a user alters the time frame on one panel, the others should adjust accordingly).
The solution in this article integrates the open source Business Charts panel with the Crosshair and EventBus functionalities to have native and community panels talking to each other. The panels' interconnectivity makes data analysis more visual and supports Grafana as a top-notch visualization tool.
The provided solution involving the Time Series panel and Shared Crosshair functionality is just one example of panels' interconnectivity using EventBus. Panels can interact in various ways.
Crosshair
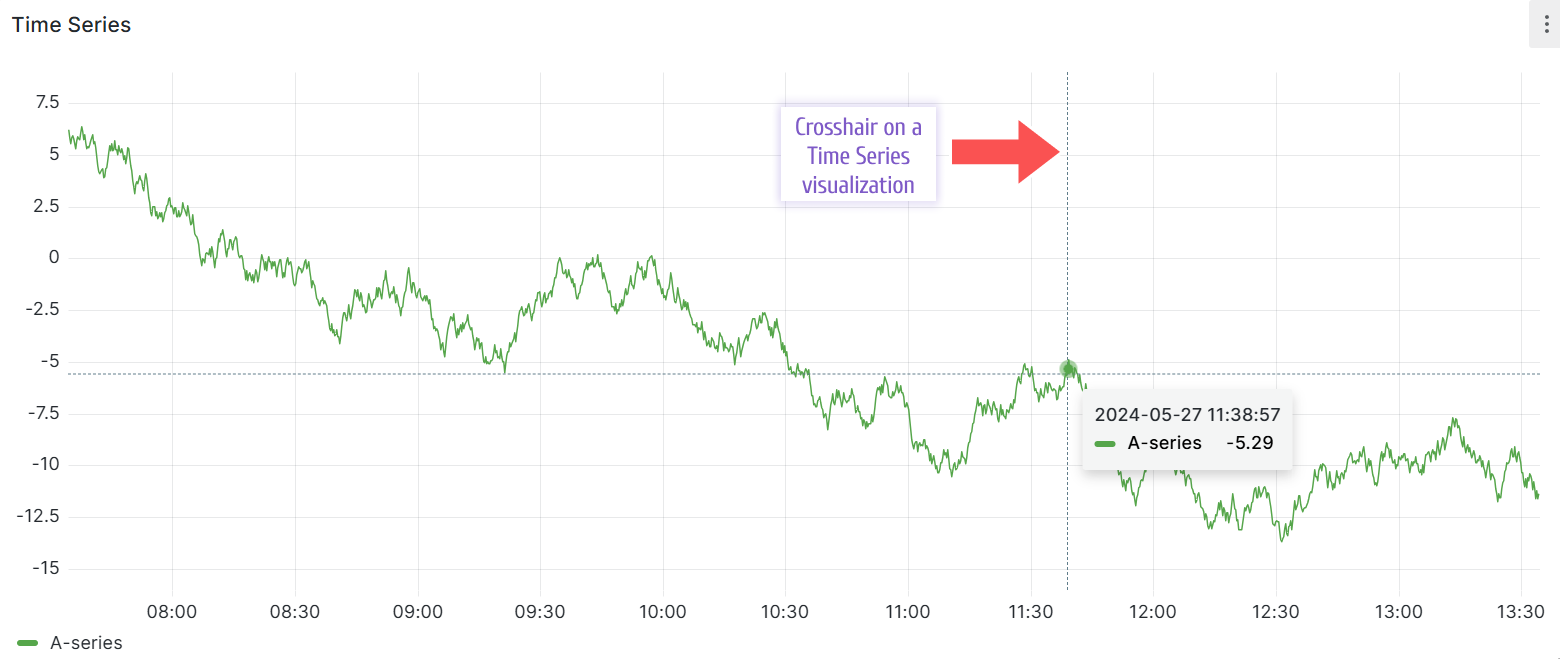
In general, the Crosshair feature helps to highlight the selected data points on the graph. Some of the native Grafana panels have crosshair built-in from the start. For instance, Time Series panel displays it right off the bat. When a user hovers a mouse over the graph, the two dotted perpendicular lines appear.
Shared Crosshair
You can go one step further and allow the Shared crosshair in the dashboard settings.
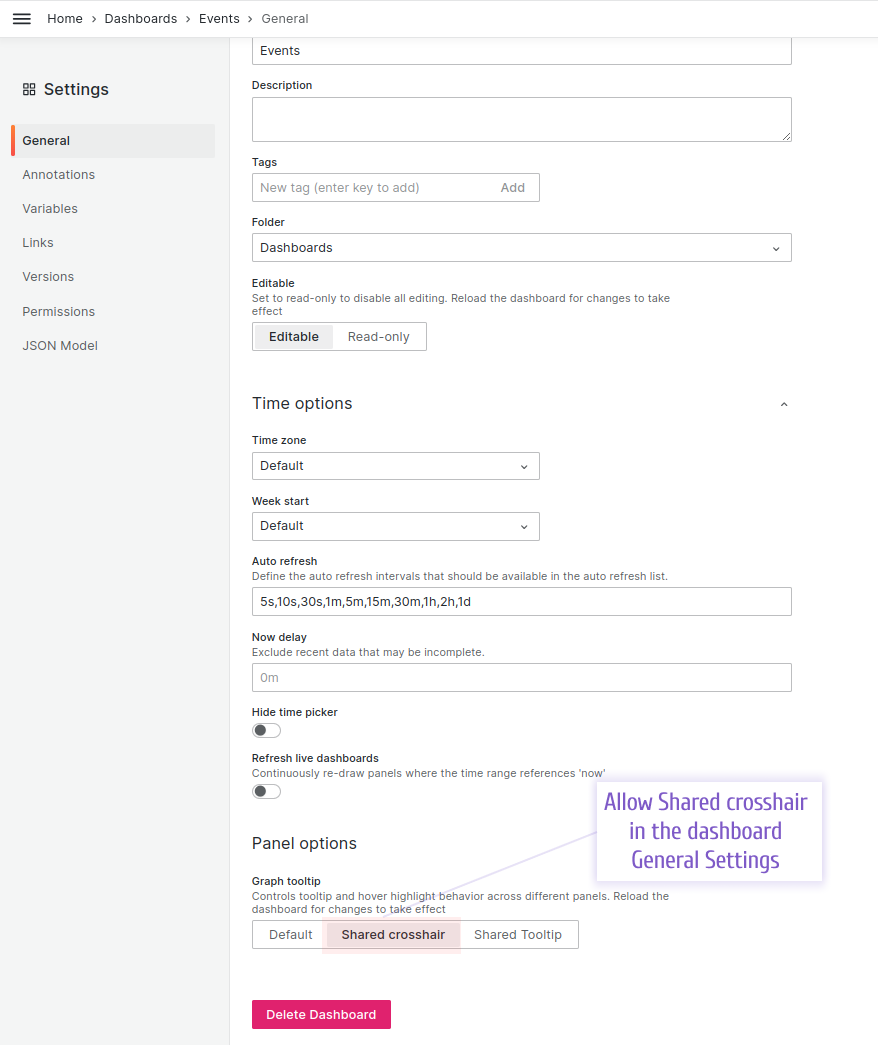
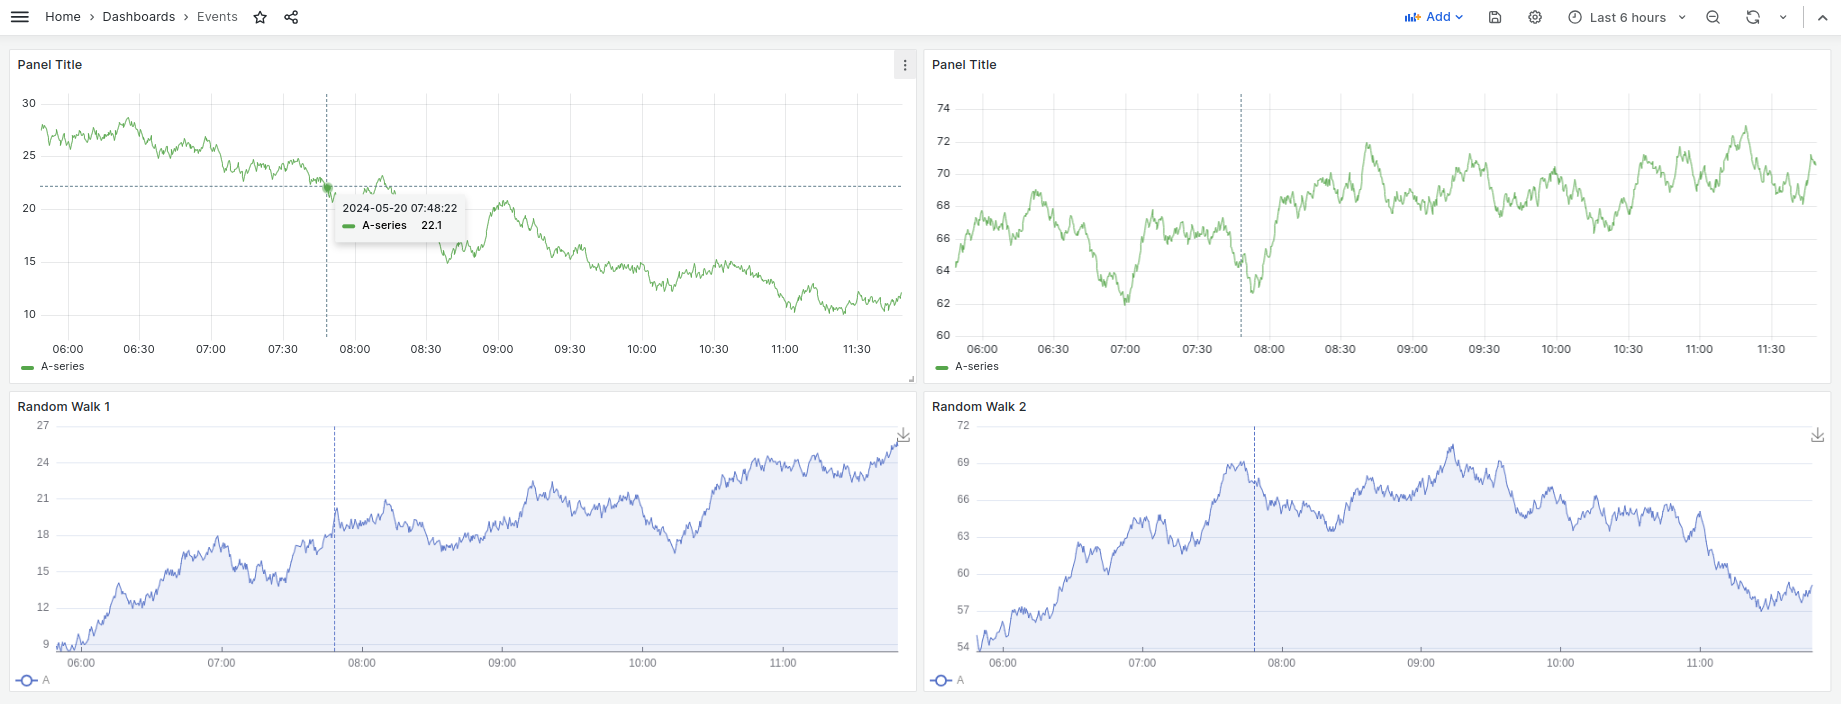
Below is an example of two Time Series on the dashboard with the Shared crosshair turned on. The Data Sources for both are set to Random Walk in internal --Grafana-- data source.
Note, that the panel on the left (where a mouse is hovering) displays two dotted perpendicular lines and the panel on the right displays one vertical dotted line which follows the crosshair of the left panel. When a user selects a different time frame on the left panel, the right panel also follows providing a synchronized view of the Time Series data.
Limitations
I can point out three limitations:
-
With the Shared crosshair dashboard setting, you can not specify which panels should be impacted; all panels with the built-in crosshair feature will display it. That is acceptable in most cases, yet it is not ideal for all dashboards.
-
The crosshair feature is available for only some native Grafana plugins.
-
The Shared crosshair is just one example of many possible panels' interactivities. If you need something else, there has to be JavaScript involved.
EventBus for panels' interconnectivity
So far I explained what a crosshair in Grafana is, how to enable the Shared crosshair feature, what the shared crosshair looks like and what are the general limitations.
Now let's review how to display a shared crosshair on community panels, or, in other words, how to faciliate one of the possible ways of the panels' interconnectivities. I will use the Business Charts panel as an example of a Community plugin.
Grafana provides the EventBus functionality for panel to communicate with each other, dashboard and Grafana application. This is when you subscribe to the application's events and describe an action in case the event occurs.
Using EventBus is a one way to facilitate an interaction between visualization panels. The other approach could be by using dashboard variables. This topic is not covered in this article.
My team started working on documentation for Grafana EventBus. As of today, you can find the code demonstrating how to subscribe to an event there.
Please note that the synchronization between the two panels consists of a reaction to the changes on both panels.
- When a mouse hovers over the Time series, we listen for events in the Business Charts.
- When a mouse hovers over the Business Charts, we send events for the Time Series panel.
Add two Business Charts panels
Add two Business Charts panels on the existing dashboard. The codes for both panels are identical.
The data source is --Grafana-- with query type Random Walk for both panels.
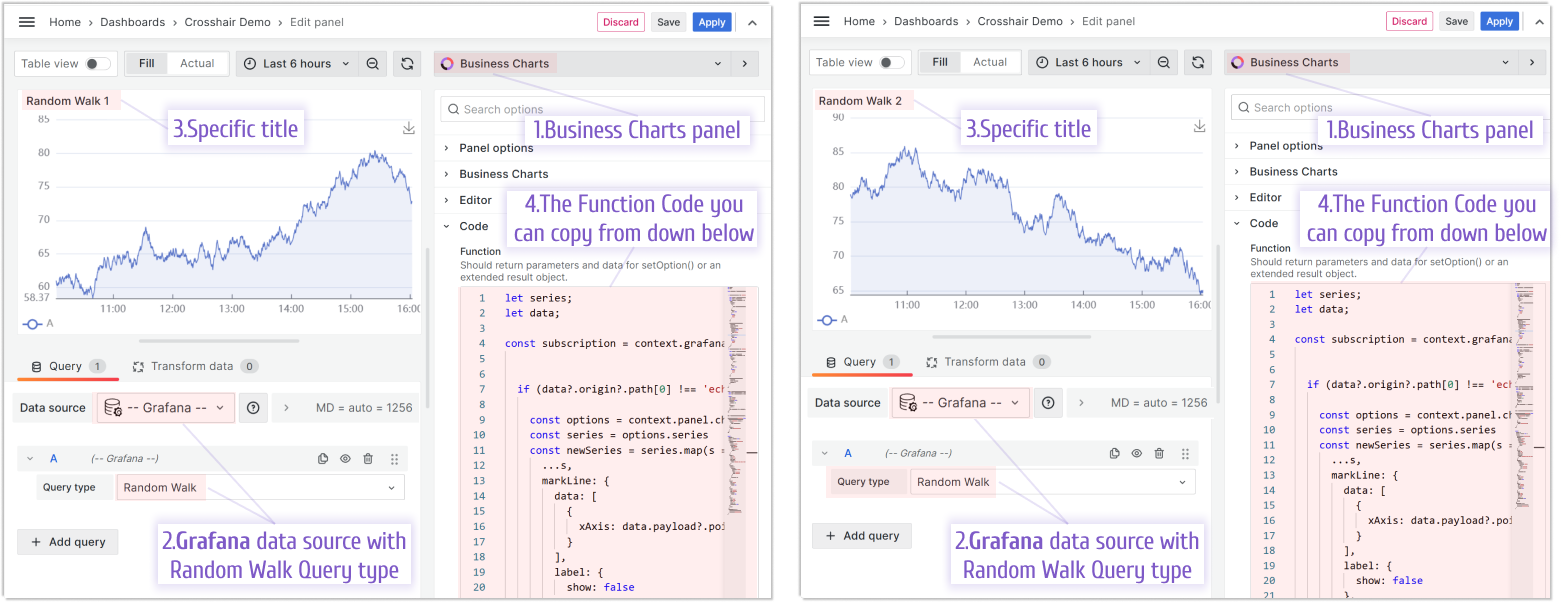
Initial code to parse data frames and display random walk data:
/**
 *  Map the series data to the required format for the ECharts series
 */
let series = context.panel.data.series.map((s) => {
  /**
   *  Find the number and time fields in the series
   */
  const numberField = s.fields.find((f) => f.type === "number");
  const timeField = s.fields.find((f) => f.type === "time");

  /**
   *  Create the series object
   */
  return {
    name: s.refId,
    type: "line",
    showSymbol: false,
    areaStyle: {
      opacity: 0.1,
    },
    lineStyle: {
      width: 1,
    },
    data: numberField.values.map((d, i) => [timeField.values[i], d.toFixed(2)]),
  };
});

/**
 * Extract the series reference IDs for the legend
 */
let data = context.panel.data.series.map((s) => s.refId);

/**
 * Return the ECharts configuration object
 */
return {
  backgroundColor: "transparent",
  tooltip: {
    trigger: "axis",
    axisPointer: {
      type: "cross",
      lineStyle: {
        type: "dashed",
        width: 3,
      },
    },
  },
  legend: {
    left: "0",
    bottom: "0",
    data: data,
    textStyle: {
      color: "rgba(128, 128, 128, .9)",
    },
  },
  toolbox: {
    feature: {
      dataZoom: {
        yAxisIndex: "none",
        icon: {
          zoom: "path://",
          back: "path://",
        },
      },
      saveAsImage: {},
    },
  },
  xAxis: {
    type: "time",
    axisTick: {
      inside: true,
    },
  },
  yAxis: {
    type: "value",
    min: "dataMin",
    axisTick: {
      inside: true,
    },
  },
  grid: {
    left: "2%",
    right: "2%",
    top: "2%",
    bottom: 24,
    containLabel: true,
  },
  series,
};
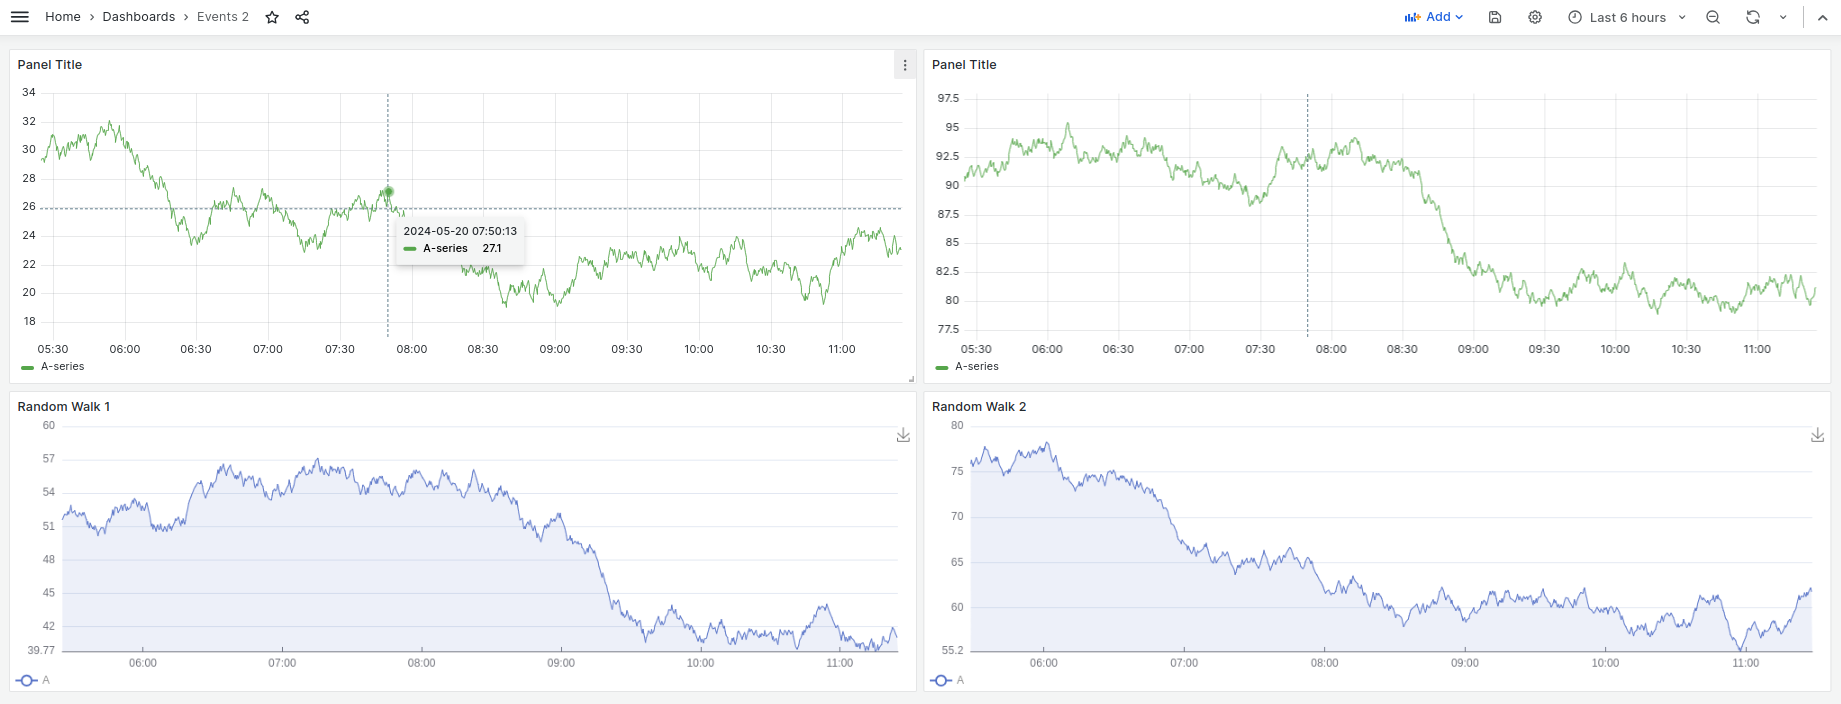
With two Time Series and two Business Charts panels, the dashboard looks as below. The Shared crosshair feature is enabled, so, we can see a synchronized crosshair on the Time Series panels.
The Business Charts panels are not yet configured to support EventBus used for interpanel communications and, thus, no crosshair for them yet.
Modify the Business Charts panels to react on the events from Time Series
The key parts of the provided below code are:
- Subscribing to the
data-hoverevent on theEChartsinstance. - Checking if the event is for the Time Series panel (based on the
seriesIndex). - Updating the markline(crosshair line) on the Business Chart using the
setOption()method.
The Randon Walk 1 and Randon walk 2 codes are almost identical, but I provide both for your convenience, so you see the difference.
Code Example for Random Walk 1
/**
 *  Map the series data to the required format for the ECharts series
 */
let series = context.panel.data.series.map((s) => {
  /**
   *  Find the number and time fields in the series
   */
  const numberField = s.fields.find((f) => f.type === "number");
  const timeField = s.fields.find((f) => f.type === "time");

  /**
   *  Create the series object
   */
  return {
    name: s.refId,
    type: "line",
    showSymbol: false,
    areaStyle: {
      opacity: 0.1,
    },
    lineStyle: {
      width: 1,
    },
    data: numberField.values.map((d, i) => [timeField.values[i], d.toFixed(2)]),
  };
});

/**
 * Extract the series reference IDs for the legend
 */
let data = context.panel.data.series.map((s) => s.refId);

/**
 * Subscribe to the event
 */
const subscription = context.grafana.eventBus.subscribe(
  { type: "data-hover" },
  (data) => {
    /**
     * Handle event from other panels
     */
    if (data?.origin?.path[0] !== "echarts-walk-1") {
      const options = context.panel.chart.getOption();
      const series = options.series;

      /**
       * To create markline we need set up for series markline option
       * set for data -> xAxis -> data from event payload
       */
      const newSeries = series.map((s) => ({
        ...s,
        markLine: {
          data: [
            {
              xAxis: data.payload?.point?.time || 0,
            },
          ],
          label: {
            show: false,
          },
          symbol: ["none", "none"],
        },
      }));

      /**
       * Set up new options and new series via chart Instance and method setOption
       * additionaly set markLine params for chart
       */
      context.panel.chart.setOption({
        ...options,
        series: newSeries,
        markLine: [
          {
            animationEasing: "linear",
            animation: false,
            lineStyle: {
              type: "dashed",
            },
            symbolOffset: 0,
            label: {
              show: false,
            },
            symbol: ["none", "none"],
          },
        ],
      });
    }
  }
);

/**
 * Return the ECharts configuration object as extended object
 * contain unsubscribe option
 * The Business Charts panel supports the extended result object since version 5.0.0.
 */
return {
  version: 2,
  config: { notMerge: true },
  option: {
    backgroundColor: "transparent",
    tooltip: {
      trigger: "axis",
      axisPointer: {
        type: "cross",
        lineStyle: {
          type: "dashed",
          width: 3,
        },
      },
    },
    legend: {
      left: "0",
      bottom: "0",
      data: data,
      textStyle: {
        color: "rgba(128, 128, 128, .9)",
      },
    },
    toolbox: {
      feature: {
        dataZoom: {
          yAxisIndex: "none",
          icon: {
            zoom: "path://",
            back: "path://",
          },
        },
        saveAsImage: {},
      },
    },
    xAxis: {
      type: "time",
      axisTick: {
        inside: true,
      },
    },
    yAxis: {
      type: "value",
      min: "dataMin",
      axisTick: {
        inside: true,
      },
    },
    grid: {
      left: "2%",
      right: "2%",
      top: "2%",
      bottom: 24,
      containLabel: true,
    },
    series,
  },
  unsubscribe: () => {
    subscription.unsubscribe();
    console.log("Unsubscribed");
  },
};
Code Example for Random Walk 2
/**
 *  Map the series data to the required format for the ECharts series
 */
let series = context.panel.data.series.map((s) => {
  /**
   *  Find the number and time fields in the series
   */
  const numberField = s.fields.find((f) => f.type === "number");
  const timeField = s.fields.find((f) => f.type === "time");

  /**
   *  Create the series object
   */
  return {
    name: s.refId,
    type: "line",
    showSymbol: false,
    areaStyle: {
      opacity: 0.1,
    },
    lineStyle: {
      width: 1,
    },
    data: numberField.values.map((d, i) => [timeField.values[i], d.toFixed(2)]),
  };
});

/**
 * Extract the series reference IDs for the legend
 */
let data = context.panel.data.series.map((s) => s.refId);

/**
 * Subscribe to the event
 */
const subscription = context.grafana.eventBus.subscribe(
  { type: "data-hover" },
  (data) => {
    /**
     * Handle event from other panels
     */
    if (data?.origin?.path[0] !== "echarts-walk-2") {
      const options = context.panel.chart.getOption();
      const series = options.series;

      /**
       * To create markline we need set up for series markline option
       * set for data -> xAxis -> data from event payload
       */
      const newSeries = series.map((s) => ({
        ...s,
        markLine: {
          data: [
            {
              xAxis: data.payload?.point?.time || 0,
            },
          ],
          label: {
            show: false,
          },
          symbol: ["none", "none"],
        },
      }));

      /**
       * Set up new options and new series via chart Instance and method setOption
       * additionaly set markLine params for chart
       */
      context.panel.chart.setOption({
        ...options,
        series: newSeries,
        markLine: [
          {
            animationEasing: "linear",
            animation: false,
            lineStyle: {
              type: "dashed",
            },
            symbolOffset: 0,
            label: {
              show: false,
            },
            symbol: ["none", "none"],
          },
        ],
      });
    }
  }
);

/**
 * Return the ECharts configuration object as extended object
 * contain unsubscribe option
 * The Business Charts panel supports the extended result object since version 5.0.0.
 */
return {
  version: 2,
  config: { notMerge: true },
  option: {
    backgroundColor: "transparent",
    tooltip: {
      trigger: "axis",
      axisPointer: {
        type: "cross",
        lineStyle: {
          type: "dashed",
          width: 3,
        },
      },
    },
    legend: {
      left: "0",
      bottom: "0",
      data: data,
      textStyle: {
        color: "rgba(128, 128, 128, .9)",
      },
    },
    toolbox: {
      feature: {
        dataZoom: {
          yAxisIndex: "none",
          icon: {
            zoom: "path://",
            back: "path://",
          },
        },
        saveAsImage: {},
      },
    },
    xAxis: {
      type: "time",
      axisTick: {
        inside: true,
      },
    },
    yAxis: {
      type: "value",
      min: "dataMin",
      axisTick: {
        inside: true,
      },
    },
    grid: {
      left: "2%",
      right: "2%",
      top: "2%",
      bottom: 24,
      containLabel: true,
    },
    series,
  },
  unsubscribe: () => {
    subscription.unsubscribe();
    console.log("Unsubscribed");
  },
};
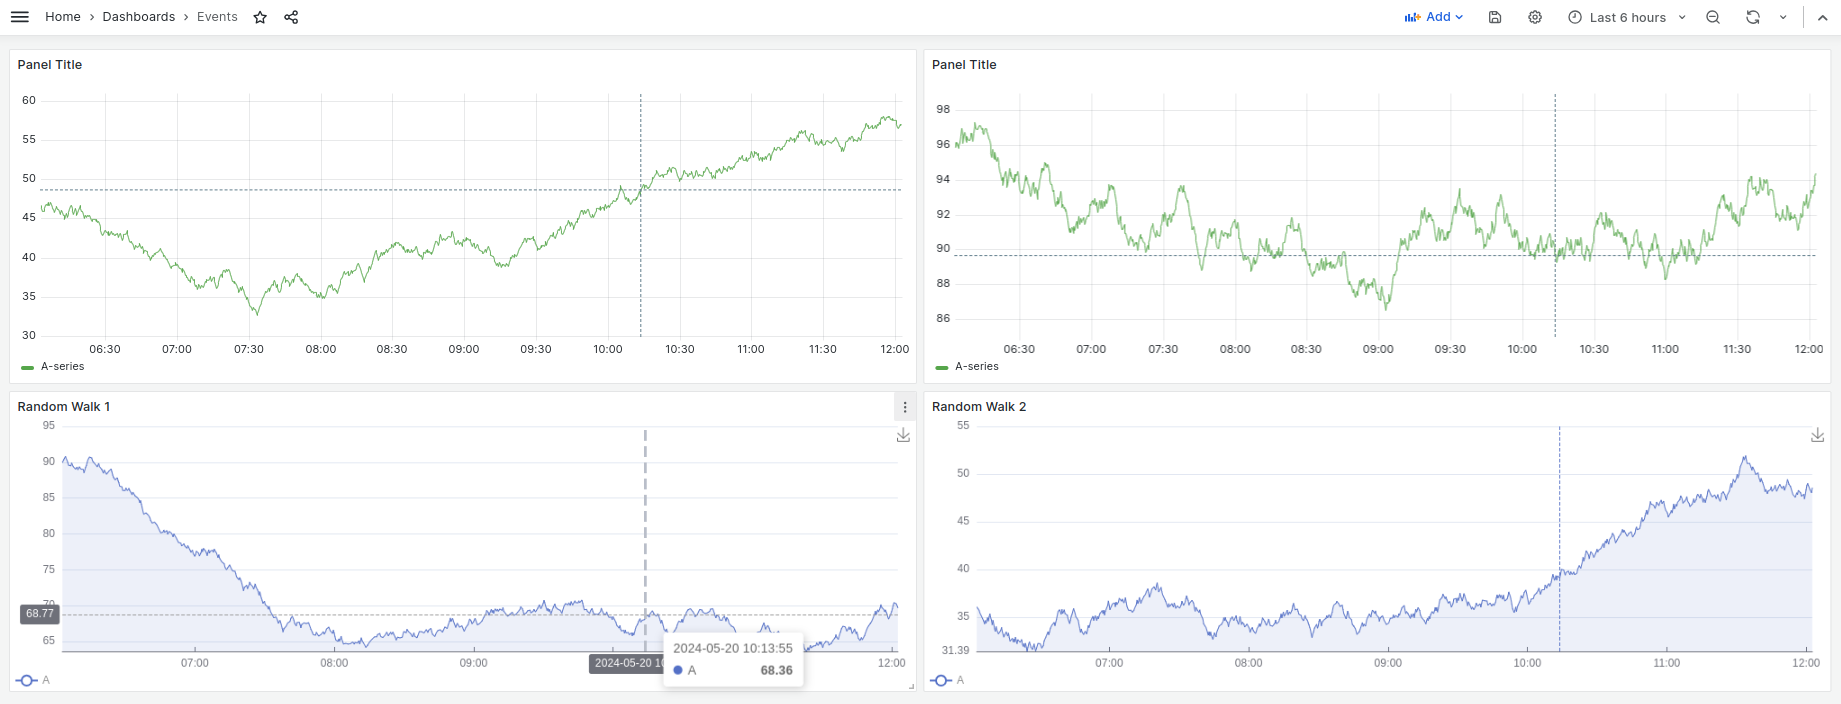
After the above code is implemented, you should see a crosshair line on the Business Charts panels, when a user hovers over any of the Time Series panels.
Modify the Business Charts panels to send events to Time Series
In this step, I need to ensure that the Time Series crosshair will follow user actions on the Business Charts. For this, I also use the Grafana EventBus. To achieve this, I add actions using the ECharts instance:
/**
 * Use Chart Instance and method on mouse move
 * It executes each time you hover over a value on the graph
 * The event will be created via the eventBus with the payload
 * Sent event will be processed by Time Series panels
 */
context.panel.chart.on("mousemove", function (params) {
  /**
   * Time contains current x-axis value
   */
  context.grafana.eventBus.publish({
    type: "data-hover",
    payload: {
      point: {
        time: params.value[0],
      },
    },
    /**
     * Set current panel id for event
     * Necessary to track the event that the current panel creates
     */
    origin: {
      path: ["echarts-walk-1"],
    },
  });
});
Hover event in Business Charts via context.panel.chart.on(“mousemove”) works when pointing directly at the points instead of the whole region as in Time Series.
Additionally, we need to add cursor hover tracking on the Business Charts and remove the previously drawn markline:
else {
      /**
       * Handle the current panel event
       * It is necessary to remove the markline that was received from the Time Series panel
       * Set up new options and new series via chart Instance and method setOption
       * markLine for series should`t contain data in xAxis
       * markline for chart should`t contain data too
       */
      const options = context.panel.chart.getOption();
      const series = options.series;
      const newSeries = series.map((s) => ({
        ...s,
        markLine: {
          data: [
            {
              xAxis: 0,
            },
          ],
          label: {
            show: false,
          },
          symbol: ["none", "none"],
        },
      }));

      context.panel.chart.setOption({
        ...options,
        series: newSeries,
        markLine: [],
      });
    }
Final result
The described solution creates a two-way interaction between the Bussines Chart panels and the Time Series panels. Hovering over the Random Walk charts updates the markline on the Time Series chart, and vice versa.
Full Example for Random Walk 1
/**
 *  Map the series data to the required format for the ECharts series
 */
let series = context.panel.data.series.map((s) => {
  /**
   *  Find the number and time fields in the series
   */
  const numberField = s.fields.find((f) => f.type === "number");
  const timeField = s.fields.find((f) => f.type === "time");

  /**
   *  Create the series object
   */
  return {
    name: s.refId,
    type: "line",
    showSymbol: false,
    areaStyle: {
      opacity: 0.1,
    },
    lineStyle: {
      width: 1,
    },
    data: numberField.values.map((d, i) => [timeField.values[i], d.toFixed(2)]),
  };
});

/**
 * Extract the series reference IDs for the legend
 */
let data = context.panel.data.series.map((s) => s.refId);

/**
 * Subscribe to the event
 */
const subscription = context.grafana.eventBus.subscribe(
  { type: "data-hover" },
  (data) => {
    /**
     * Handle event from other panels
     */
    if (data?.origin?.path[0] !== "echarts-walk-1") {
      const options = context.panel.chart.getOption();
      const series = options.series;

      /**
       * To create markline we need set up for series markline option
       * set for data -> xAxis -> data from event payload
       */
      const newSeries = series.map((s) => ({
        ...s,
        markLine: {
          data: [
            {
              xAxis: data.payload?.point?.time || 0,
            },
          ],
          label: {
            show: false,
          },
          symbol: ["none", "none"],
        },
      }));

      /**
       * Set up new options and new series via chart Instance and method setOption
       * additionaly set markLine params for chart
       */
      context.panel.chart.setOption({
        ...options,
        series: newSeries,
        markLine: [
          {
            animationEasing: "linear",
            animation: false,
            lineStyle: {
              type: "dashed",
            },
            symbolOffset: 0,
            label: {
              show: false,
            },
            symbol: ["none", "none"],
          },
        ],
      });
    } else {
      /**
       * Handle the current panel event
       * It is necessary to remove the markline that was received from the Time Series panel
       * Set up new options and new series via chart Instance and method setOption
       * markLine for series should`t contain data in xAxis
       * markline for chart should`t contain data too
       */
      const options = context.panel.chart.getOption();
      const series = options.series;
      const newSeries = series.map((s) => ({
        ...s,
        markLine: {
          data: [
            {
              xAxis: 0,
            },
          ],
          label: {
            show: false,
          },
          symbol: ["none", "none"],
        },
      }));

      context.panel.chart.setOption({
        ...options,
        series: newSeries,
        markLine: [],
      });
    }
  }
);

/**
 * Use Chart Instance and method on mouse move
 * Each time you hover over a value on the graph
 * The event will be created via the eventBus with the payload
 * Processed by TimeSeries panels
 */
context.panel.chart.on("mousemove", function (params) {
  /**
   * Time contains current x-axis value
   */
  context.grafana.eventBus.publish({
    type: "data-hover",
    payload: {
      point: {
        time: params.value[0],
      },
    },
    /**
     * Set current panel id for event
     * Necessary to track the event that the current panel creates
     */
    origin: {
      path: ["echarts-walk-1"],
    },
  });
});

/**
 * Return the ECharts configuration object as extended object
 * contain unsubscribe option
 * The Business Charts panel supports the extended result object since version 5.0.0.
 */
return {
  version: 2,
  config: { notMerge: true },
  option: {
    backgroundColor: "transparent",
    tooltip: {
      trigger: "axis",
      axisPointer: {
        type: "cross",
        lineStyle: {
          type: "dashed",
          width: 3,
        },
      },
    },
    legend: {
      left: "0",
      bottom: "0",
      data: data,
      textStyle: {
        color: "rgba(128, 128, 128, .9)",
      },
    },
    toolbox: {
      feature: {
        dataZoom: {
          yAxisIndex: "none",
          icon: {
            zoom: "path://",
            back: "path://",
          },
        },
        saveAsImage: {},
      },
    },
    xAxis: {
      type: "time",
      axisTick: {
        inside: true,
      },
    },
    yAxis: {
      type: "value",
      min: "dataMin",
      axisTick: {
        inside: true,
      },
    },
    grid: {
      left: "2%",
      right: "2%",
      top: "2%",
      bottom: 24,
      containLabel: true,
    },
    series,
  },
  unsubscribe: () => {
    subscription.unsubscribe();
    console.log("Unsubscribed");
  },
};
Full Example for Random Walk 2
/**
 *  Map the series data to the required format for the ECharts series
 */
let series = context.panel.data.series.map((s) => {
  /**
   *  Find the number and time fields in the series
   */
  const numberField = s.fields.find((f) => f.type === "number");
  const timeField = s.fields.find((f) => f.type === "time");

  /**
   *  Create the series object
   */
  return {
    name: s.refId,
    type: "line",
    showSymbol: false,
    areaStyle: {
      opacity: 0.1,
    },
    lineStyle: {
      width: 1,
    },
    data: numberField.values.map((d, i) => [timeField.values[i], d.toFixed(2)]),
  };
});

/**
 * Extract the series reference IDs for the legend
 */
let data = context.panel.data.series.map((s) => s.refId);

/**
 * Subscribe to the event
 */
const subscription = context.grafana.eventBus.subscribe(
  { type: "data-hover" },
  (data) => {
    /**
     * for Random Walk 1 it should be
     * !== "echarts-walk-1"
     * check path for event; process data from other panels
     */
    if (data?.origin?.path[0] !== "echarts-walk-2") {
      const options = context.panel.chart.getOption();
      const series = options.series;

      /**
       * To create markline we need set up for series markline option
       * set for data -> xAxis -> data from event payload
       */
      const newSeries = series.map((s) => ({
        ...s,
        markLine: {
          data: [
            {
              xAxis: data.payload?.point?.time || 0,
            },
          ],
          label: {
            show: false,
          },
          symbol: ["none", "none"],
        },
      }));

      /**
       * Set up new options and new series via chart Instance and method setOption
       * additionaly set markLine params for chart
       */
      context.panel.chart.setOption({
        ...options,
        series: newSeries,
        markLine: [
          {
            animationEasing: "linear",
            animation: false,
            lineStyle: {
              type: "dashed",
            },
            symbolOffset: 0,
            label: {
              show: false,
            },
            symbol: ["none", "none"],
          },
        ],
      });
    } else {
      /**
       * Handle the current panel event
       * It is necessary to remove the markline that was received from the Time Series panel
       * Set up new options and new series via chart Instance and method setOption
       * markLine for series should`t contain data in xAxis
       * markline for chart should`t contain data too
       */
      const options = context.panel.chart.getOption();
      const series = options.series;
      const newSeries = series.map((s) => ({
        ...s,
        markLine: {
          data: [
            {
              xAxis: 0,
            },
          ],
          label: {
            show: false,
          },
          symbol: ["none", "none"],
        },
      }));

      context.panel.chart.setOption({
        ...options,
        series: newSeries,
        markLine: [],
      });
    }
  }
);

/**
 * Use Chart Instance and method on mouse move
 * Each time you hover over a value on the graph
 * The event will be created via the eventBus with the payload
 * Processed by TimeSeries panels
 */
context.panel.chart.on("mousemove", function (params) {
  /**
   * Time contains current x-axis value
   */
  context.grafana.eventBus.publish({
    type: "data-hover",
    payload: {
      point: {
        time: params.value[0],
      },
    },
    /**
     * Set current panel id for event
     * Necessary to track the event that the current panel creates
     */
    origin: {
      path: ["echarts-walk-2"],
    },
  });
});

/**
 * Return the ECharts configuration object as extended object
 * contain unsubscribe option
 * The Business Charts panel supports the extended result object since version 5.0.0.
 */
return {
  version: 2,
  config: { notMerge: true },
  option: {
    backgroundColor: "transparent",
    tooltip: {
      trigger: "axis",
      axisPointer: {
        type: "cross",
        lineStyle: {
          type: "dashed",
          width: 3,
        },
      },
    },
    legend: {
      left: "0",
      bottom: "0",
      data: data,
      textStyle: {
        color: "rgba(128, 128, 128, .9)",
      },
    },
    toolbox: {
      feature: {
        dataZoom: {
          yAxisIndex: "none",
          icon: {
            zoom: "path://",
            back: "path://",
          },
        },
        saveAsImage: {},
      },
    },
    xAxis: {
      type: "time",
      axisTick: {
        inside: true,
      },
    },
    yAxis: {
      type: "value",
      min: "dataMin",
      axisTick: {
        inside: true,
      },
    },
    grid: {
      left: "2%",
      right: "2%",
      top: "2%",
      bottom: 24,
      containLabel: true,
    },
    series,
  },
  unsubscribe: () => {
    subscription.unsubscribe();
    console.log("Unsubscribed");
  },
};
In this article, we provided examples of how to use one type of the supported by EventBus events. Full list of events you can find in the Grafana Crash Course.
We're Always Happy to Hear From You!
We value your feedback and are eager to connect with our community and partners. Whether you have a question, an idea, or an issue to report, here’s how you can reach out:
- Community Members: Have a question, want to suggest a new feature, or found a bug? We’d love to hear from you! Please create a GitHub issue to start the conversation.
- Enterprise Partners: Need assistance or have an urgent request? Open a Zendesk ticket for a prompt and dedicated response from our team.
- Join the Conversation: Stay updated and share your thoughts! Subscribe to our YouTube Channel and leave your comments—we can’t wait to hear what you think.
Your input helps us improve, so don’t hesitate to get in touch!