Visual editor, context breaking changes, and Grafana 11 in Business Charts 6.0.0

We are happy to announce the release of the Business Charts panel 6.0.0. This release includes the following updates:
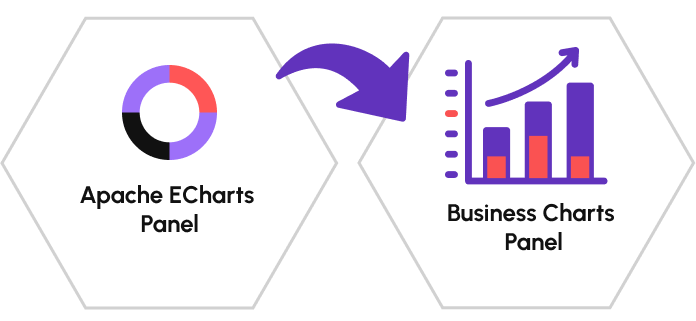
- Plugin rebranding, the new name is the Business Charts panel.
- Added Visual Editor. Beta version.
- Code window auto-sizing.
- All parameters are combined under the
context. Breaking change. - Required Grafana 10 and Grafana 11. Breaking change.
Business Charts panel
Usually, we quite easily come up with good, memorable names for our plugins. However, with this plugin, we have struggled a bit.
After two years of having our plugin bear a working title, we realized that all that time we worked on the panel that can help visualize any business data, that this plugin is ideal for anyone who creates business dashboards, and that the plugin name should be Business Charts panel. Simple rebranding means all existing features get carried over.
Please welcome the new name for the same unique and needed functionality!
The Business Charts panel is powered by the Apache ECharts library.
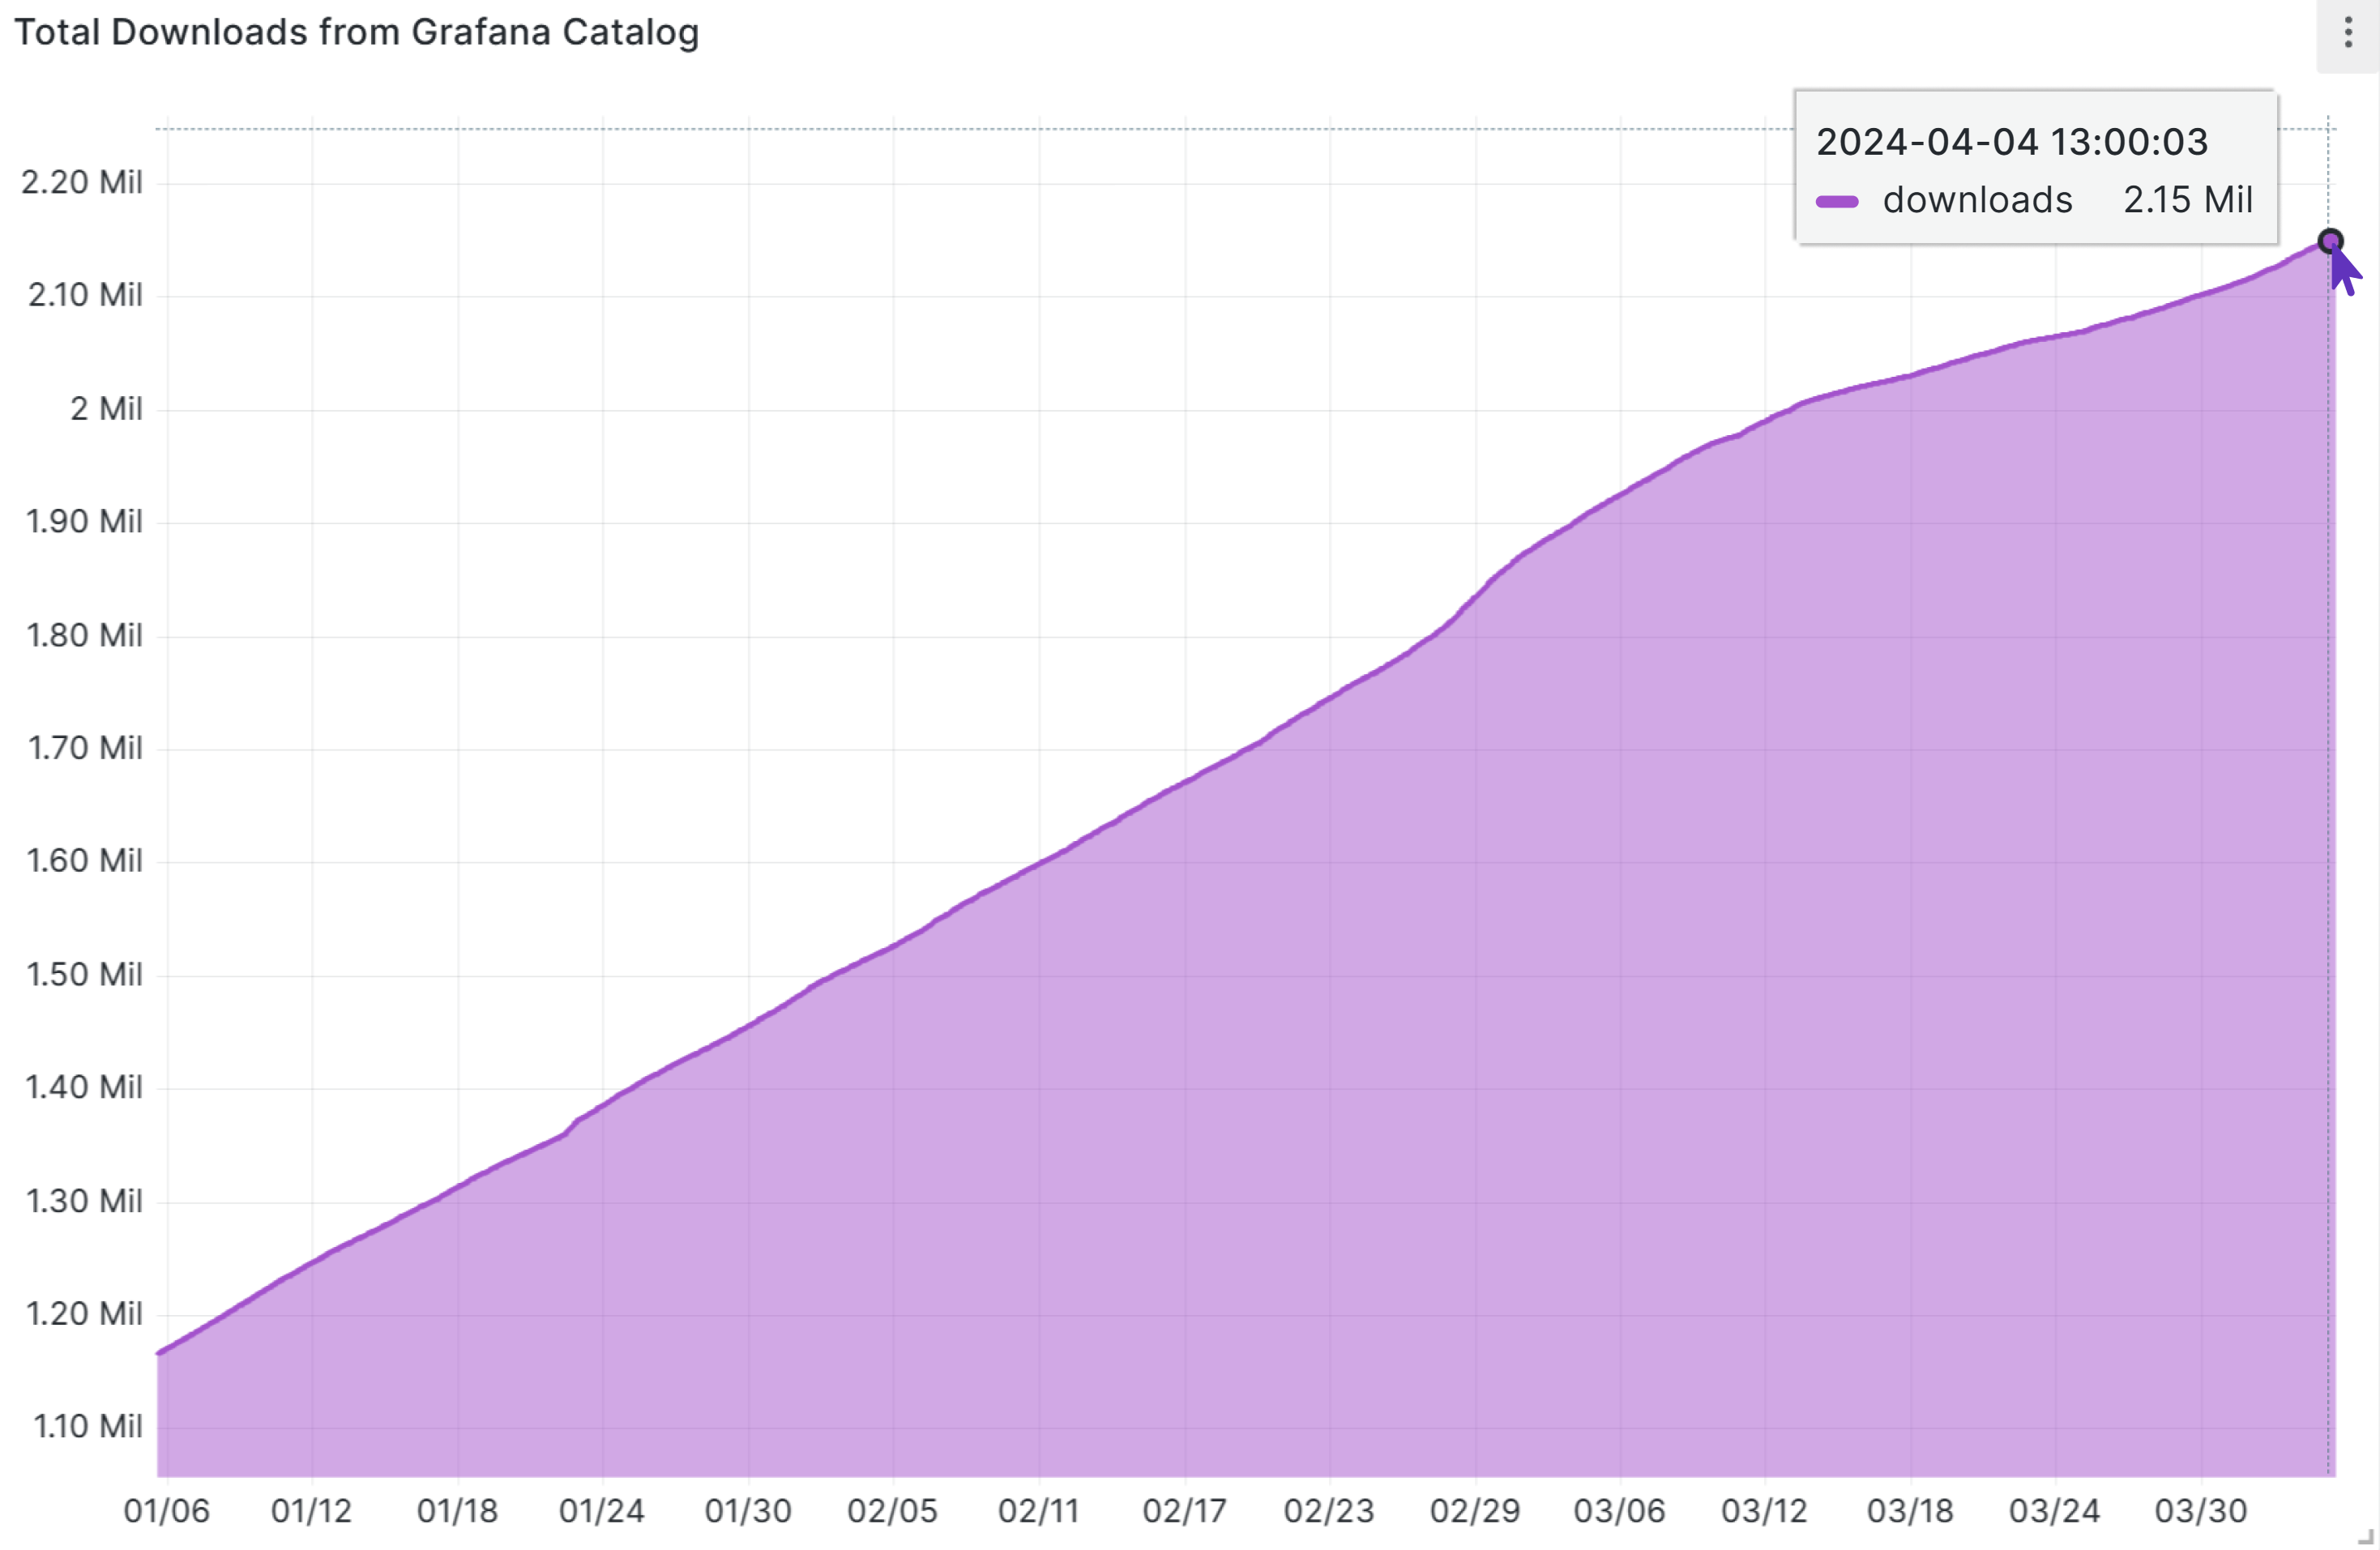
Downloads
The Business Charts panel has been downloaded more than 2 million times! It is an incredible number. We are thrilled to see our plugin in a huge demand around the world.
Visual Editor
This feature is in the beta version. As of now, it should work for simple charts. If you need anything advanced, please, use the Code mode.
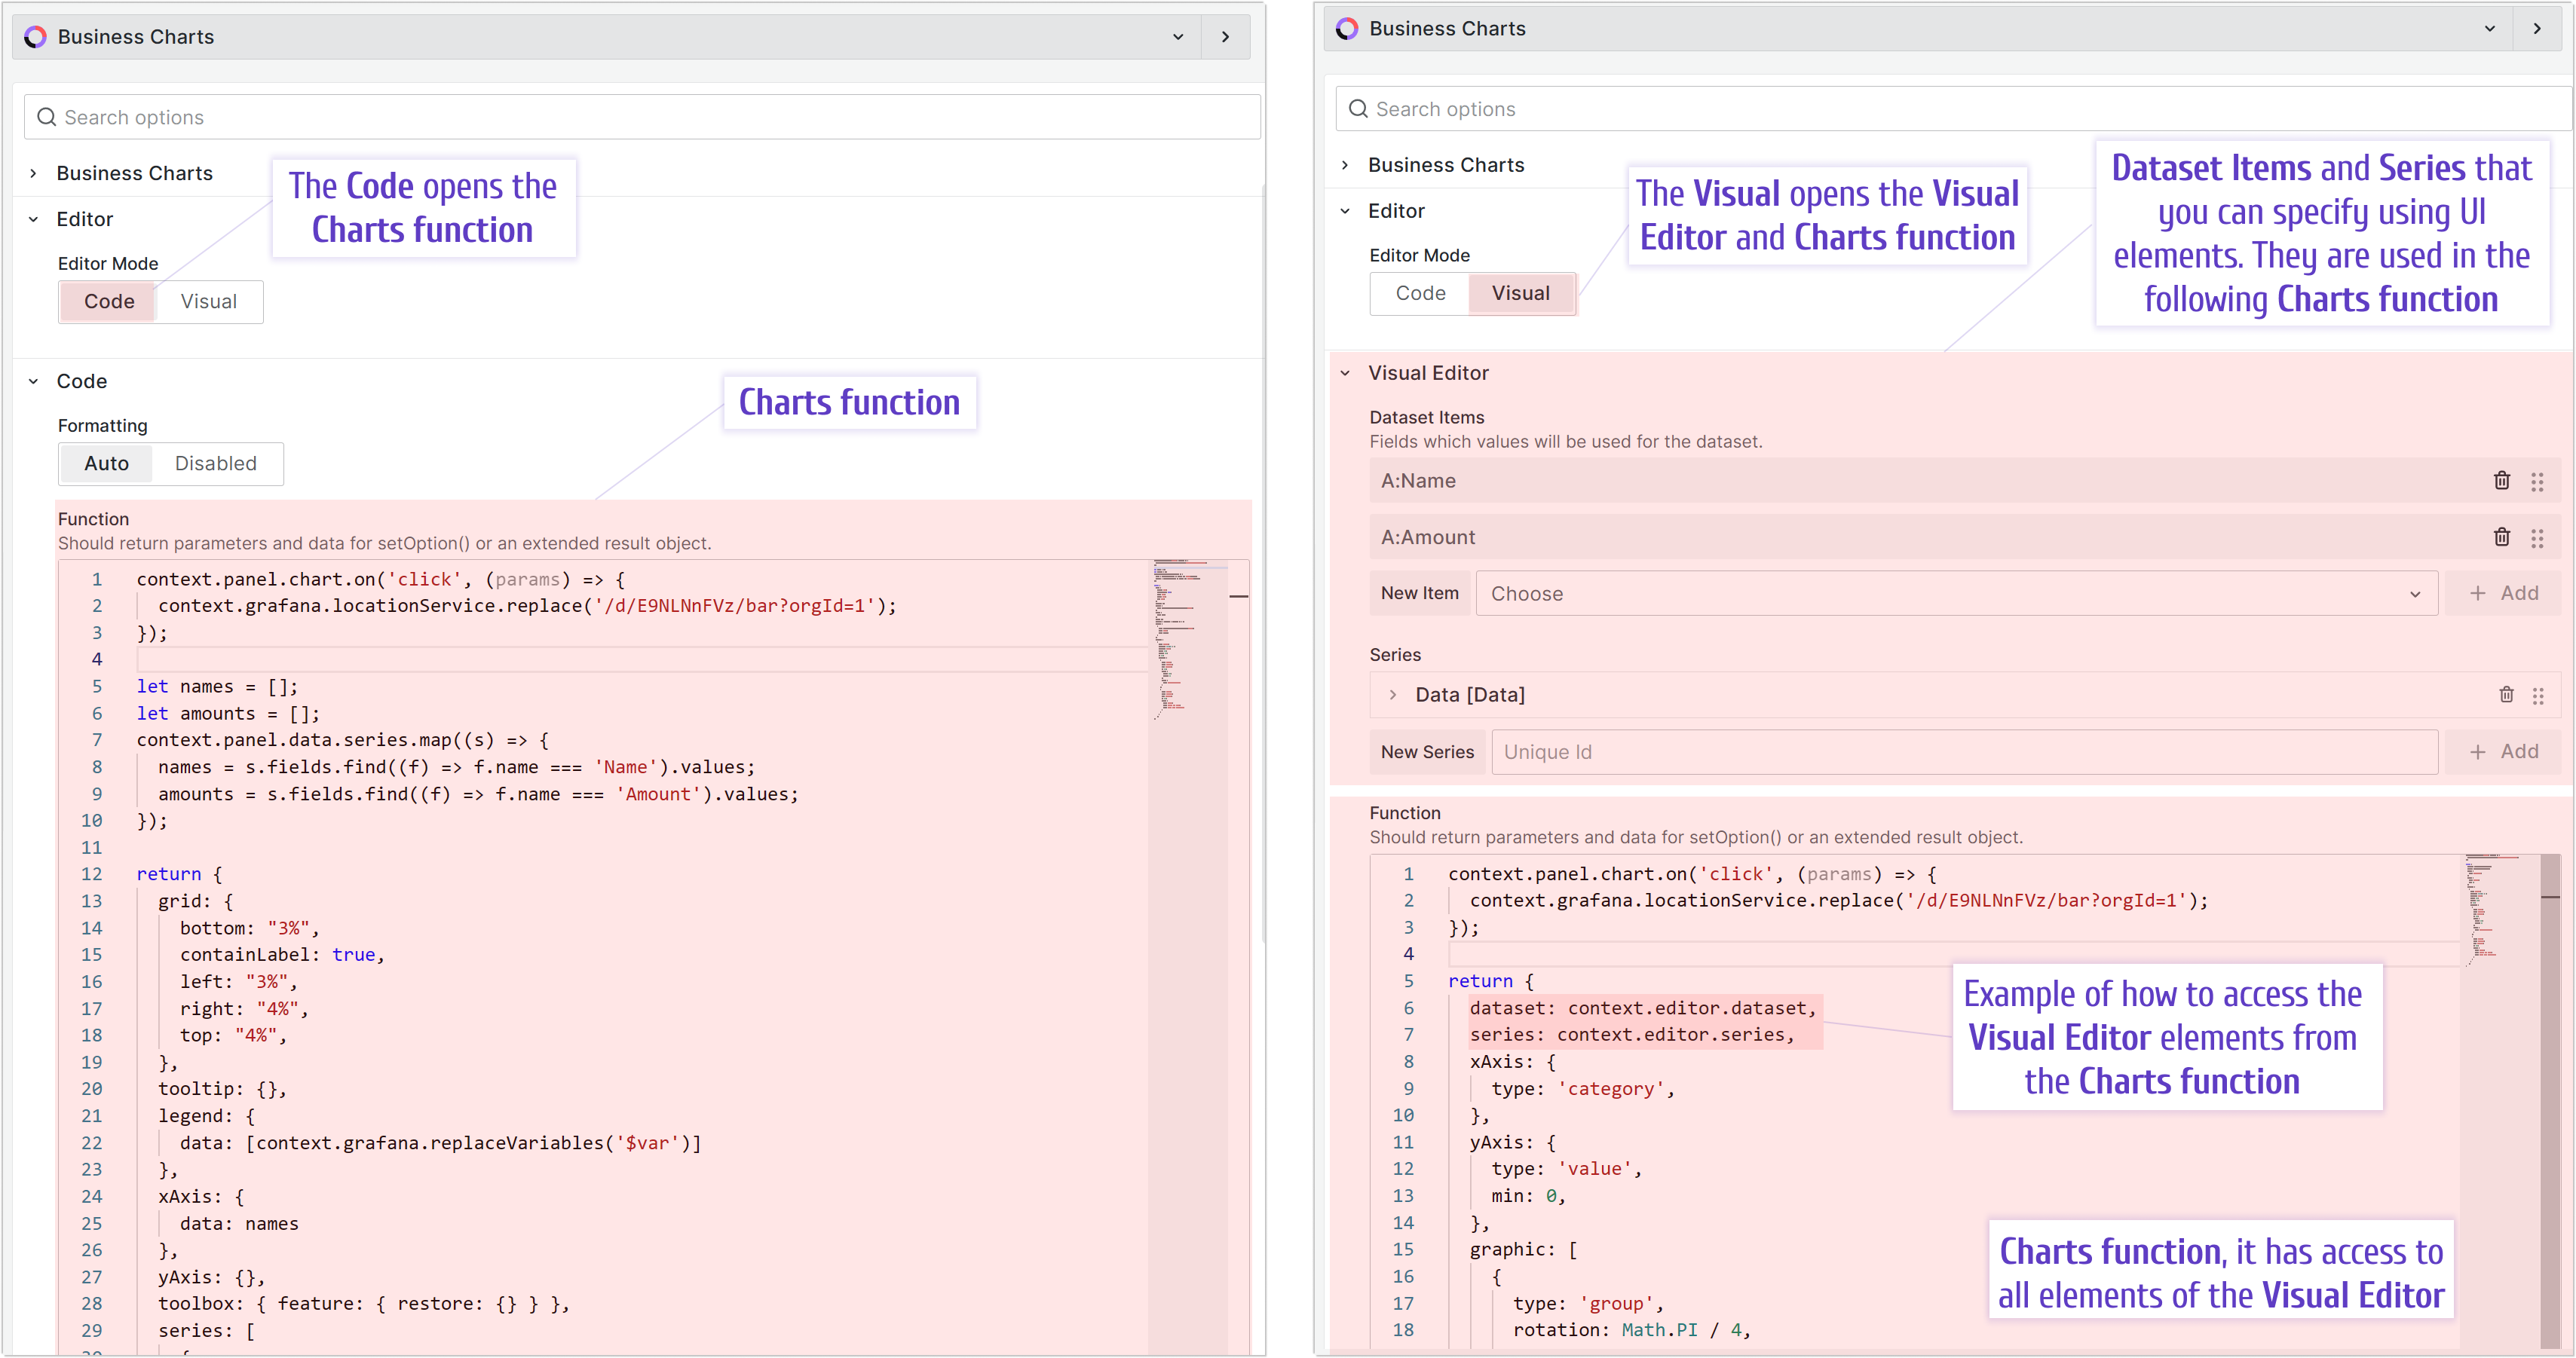
This is one of the most exciting features. Instead of using JavaScript code, you can use UI elements to specify many chart parameters.
Visual Editor Examples
To get you started faster, we have prepared many examples of how the Visual Editor can be used. Please, check out our echarts.volkovlabs.io project.
- Find the chart that looks the most of what you need to create.
- Open it in Edit mode.
- Review how the Visual Editor elements are configured.
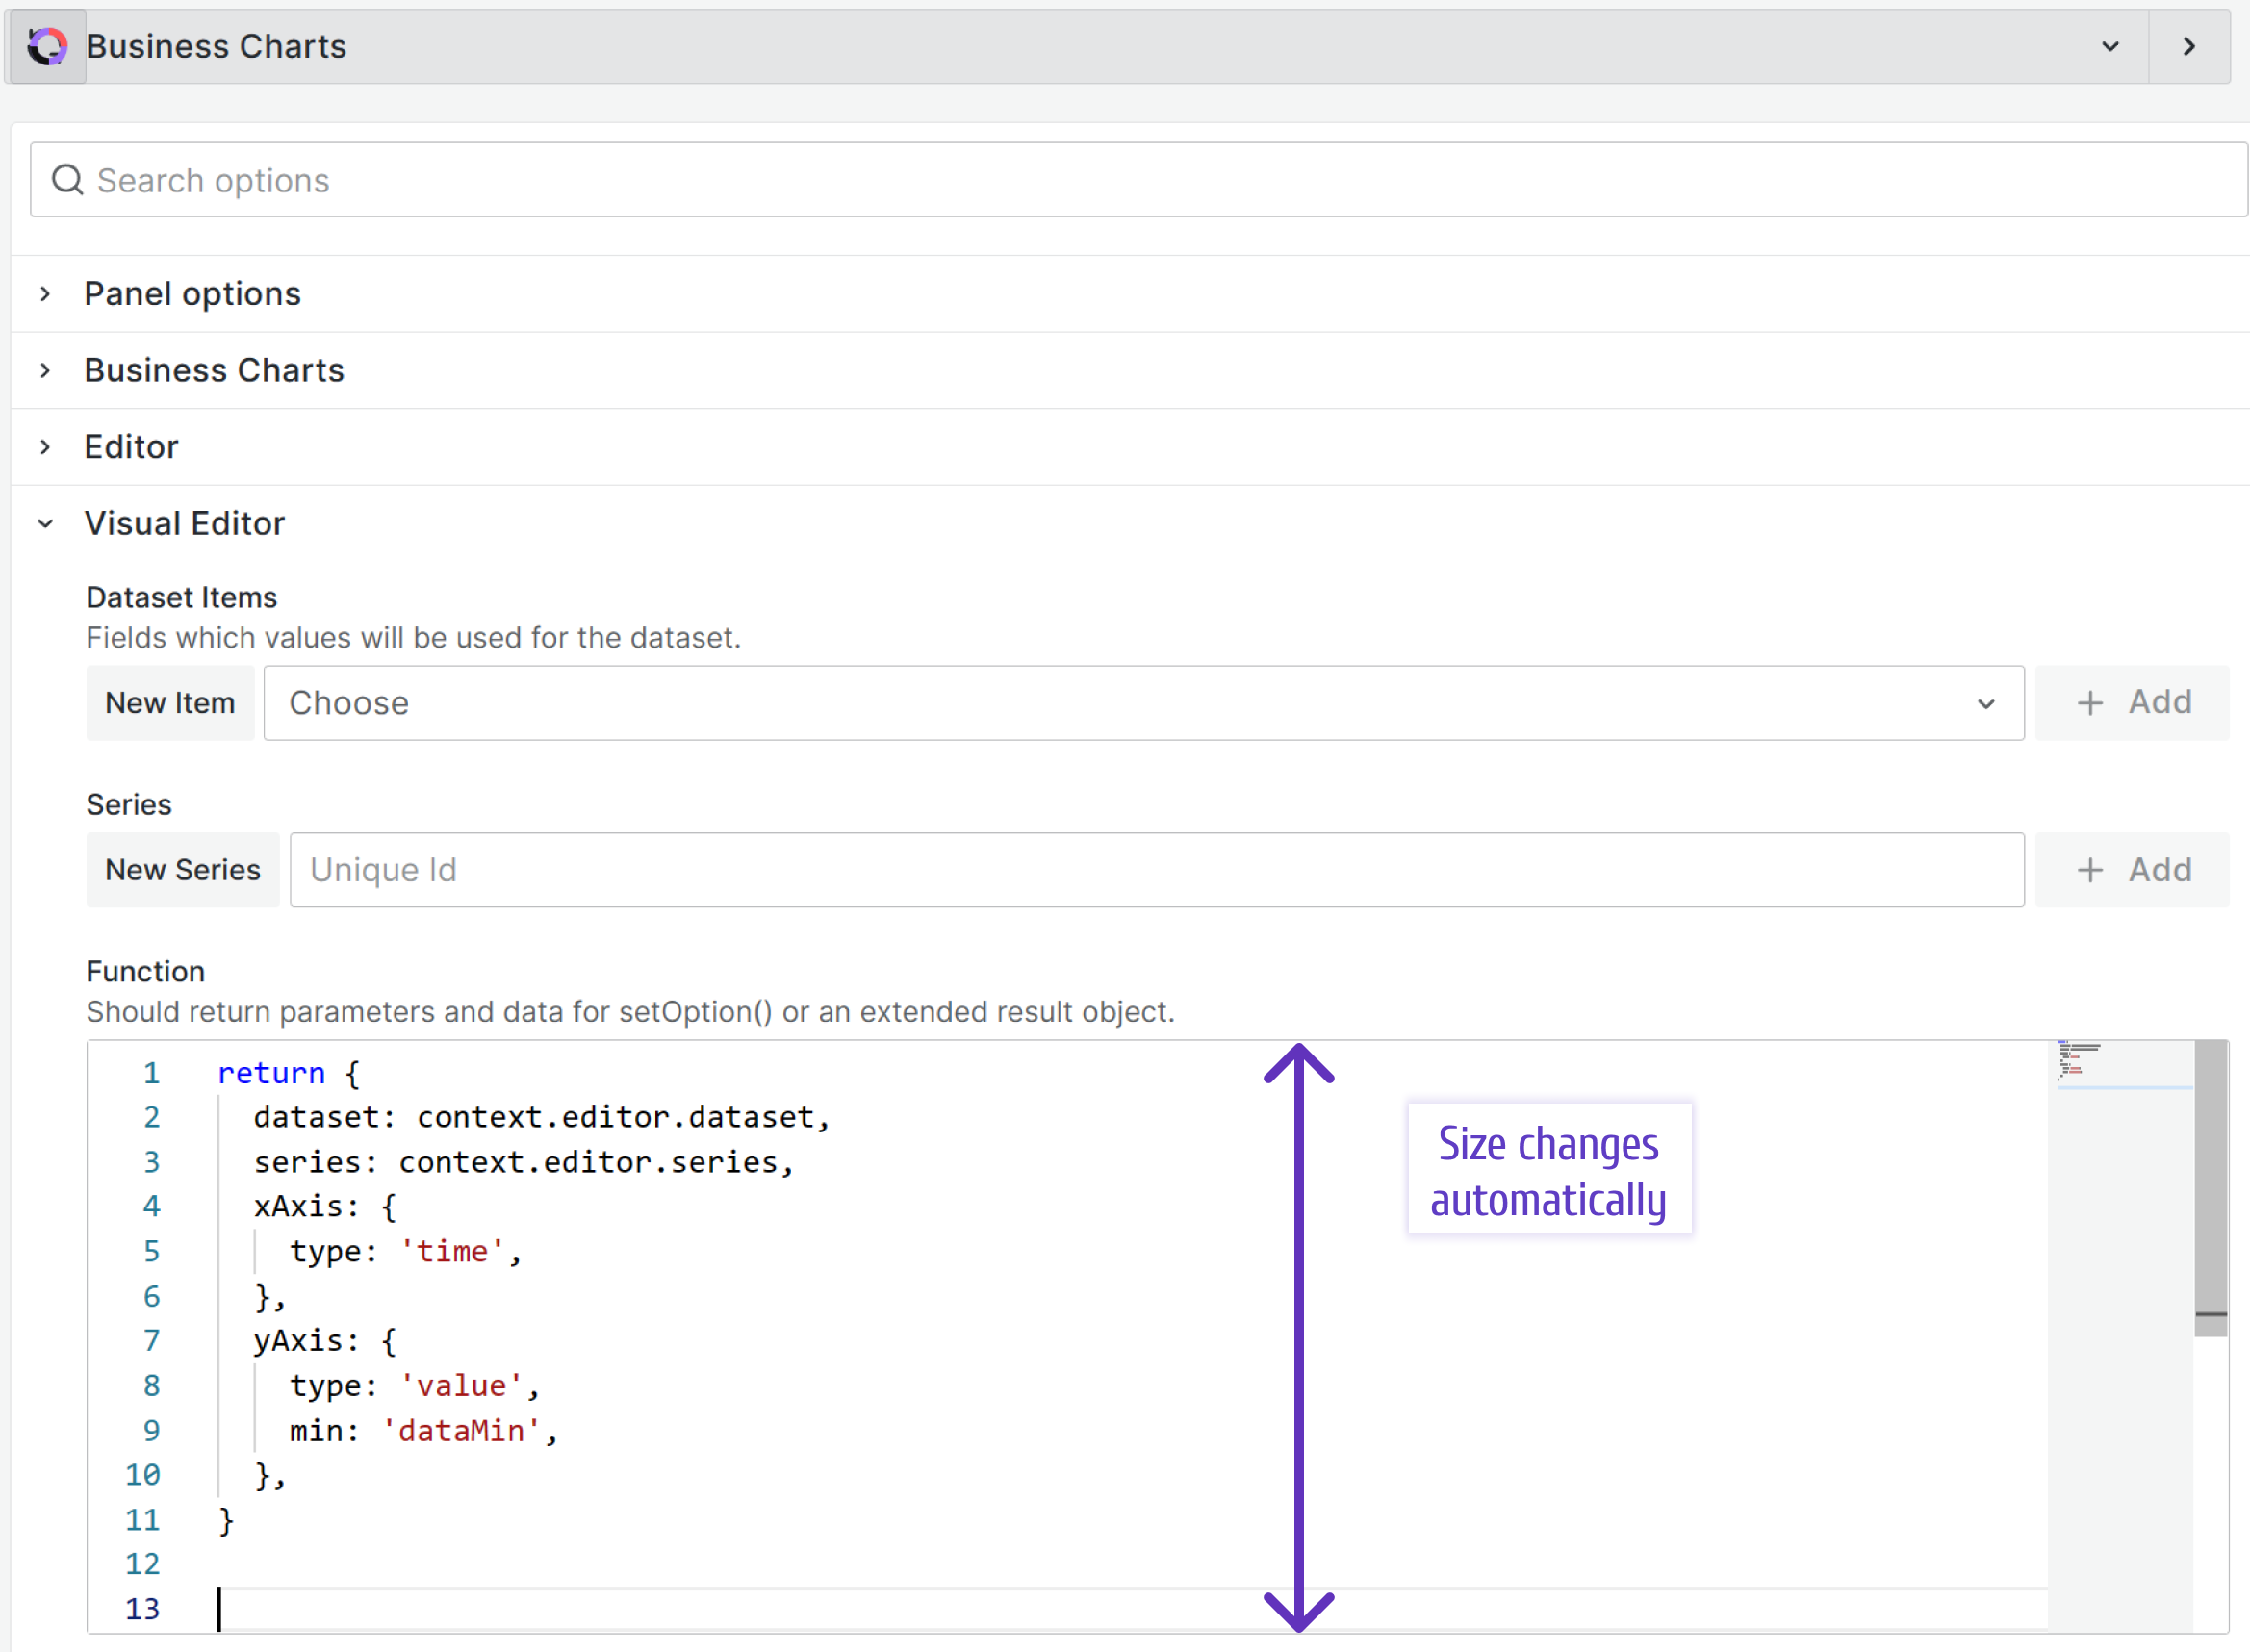
Auto size editor
This new feature automatically changes the size of the code editor depending on the number of rows in it. It is an intuitive feature that takes usability to the next level. Now users can work with their code with fewer distractions.
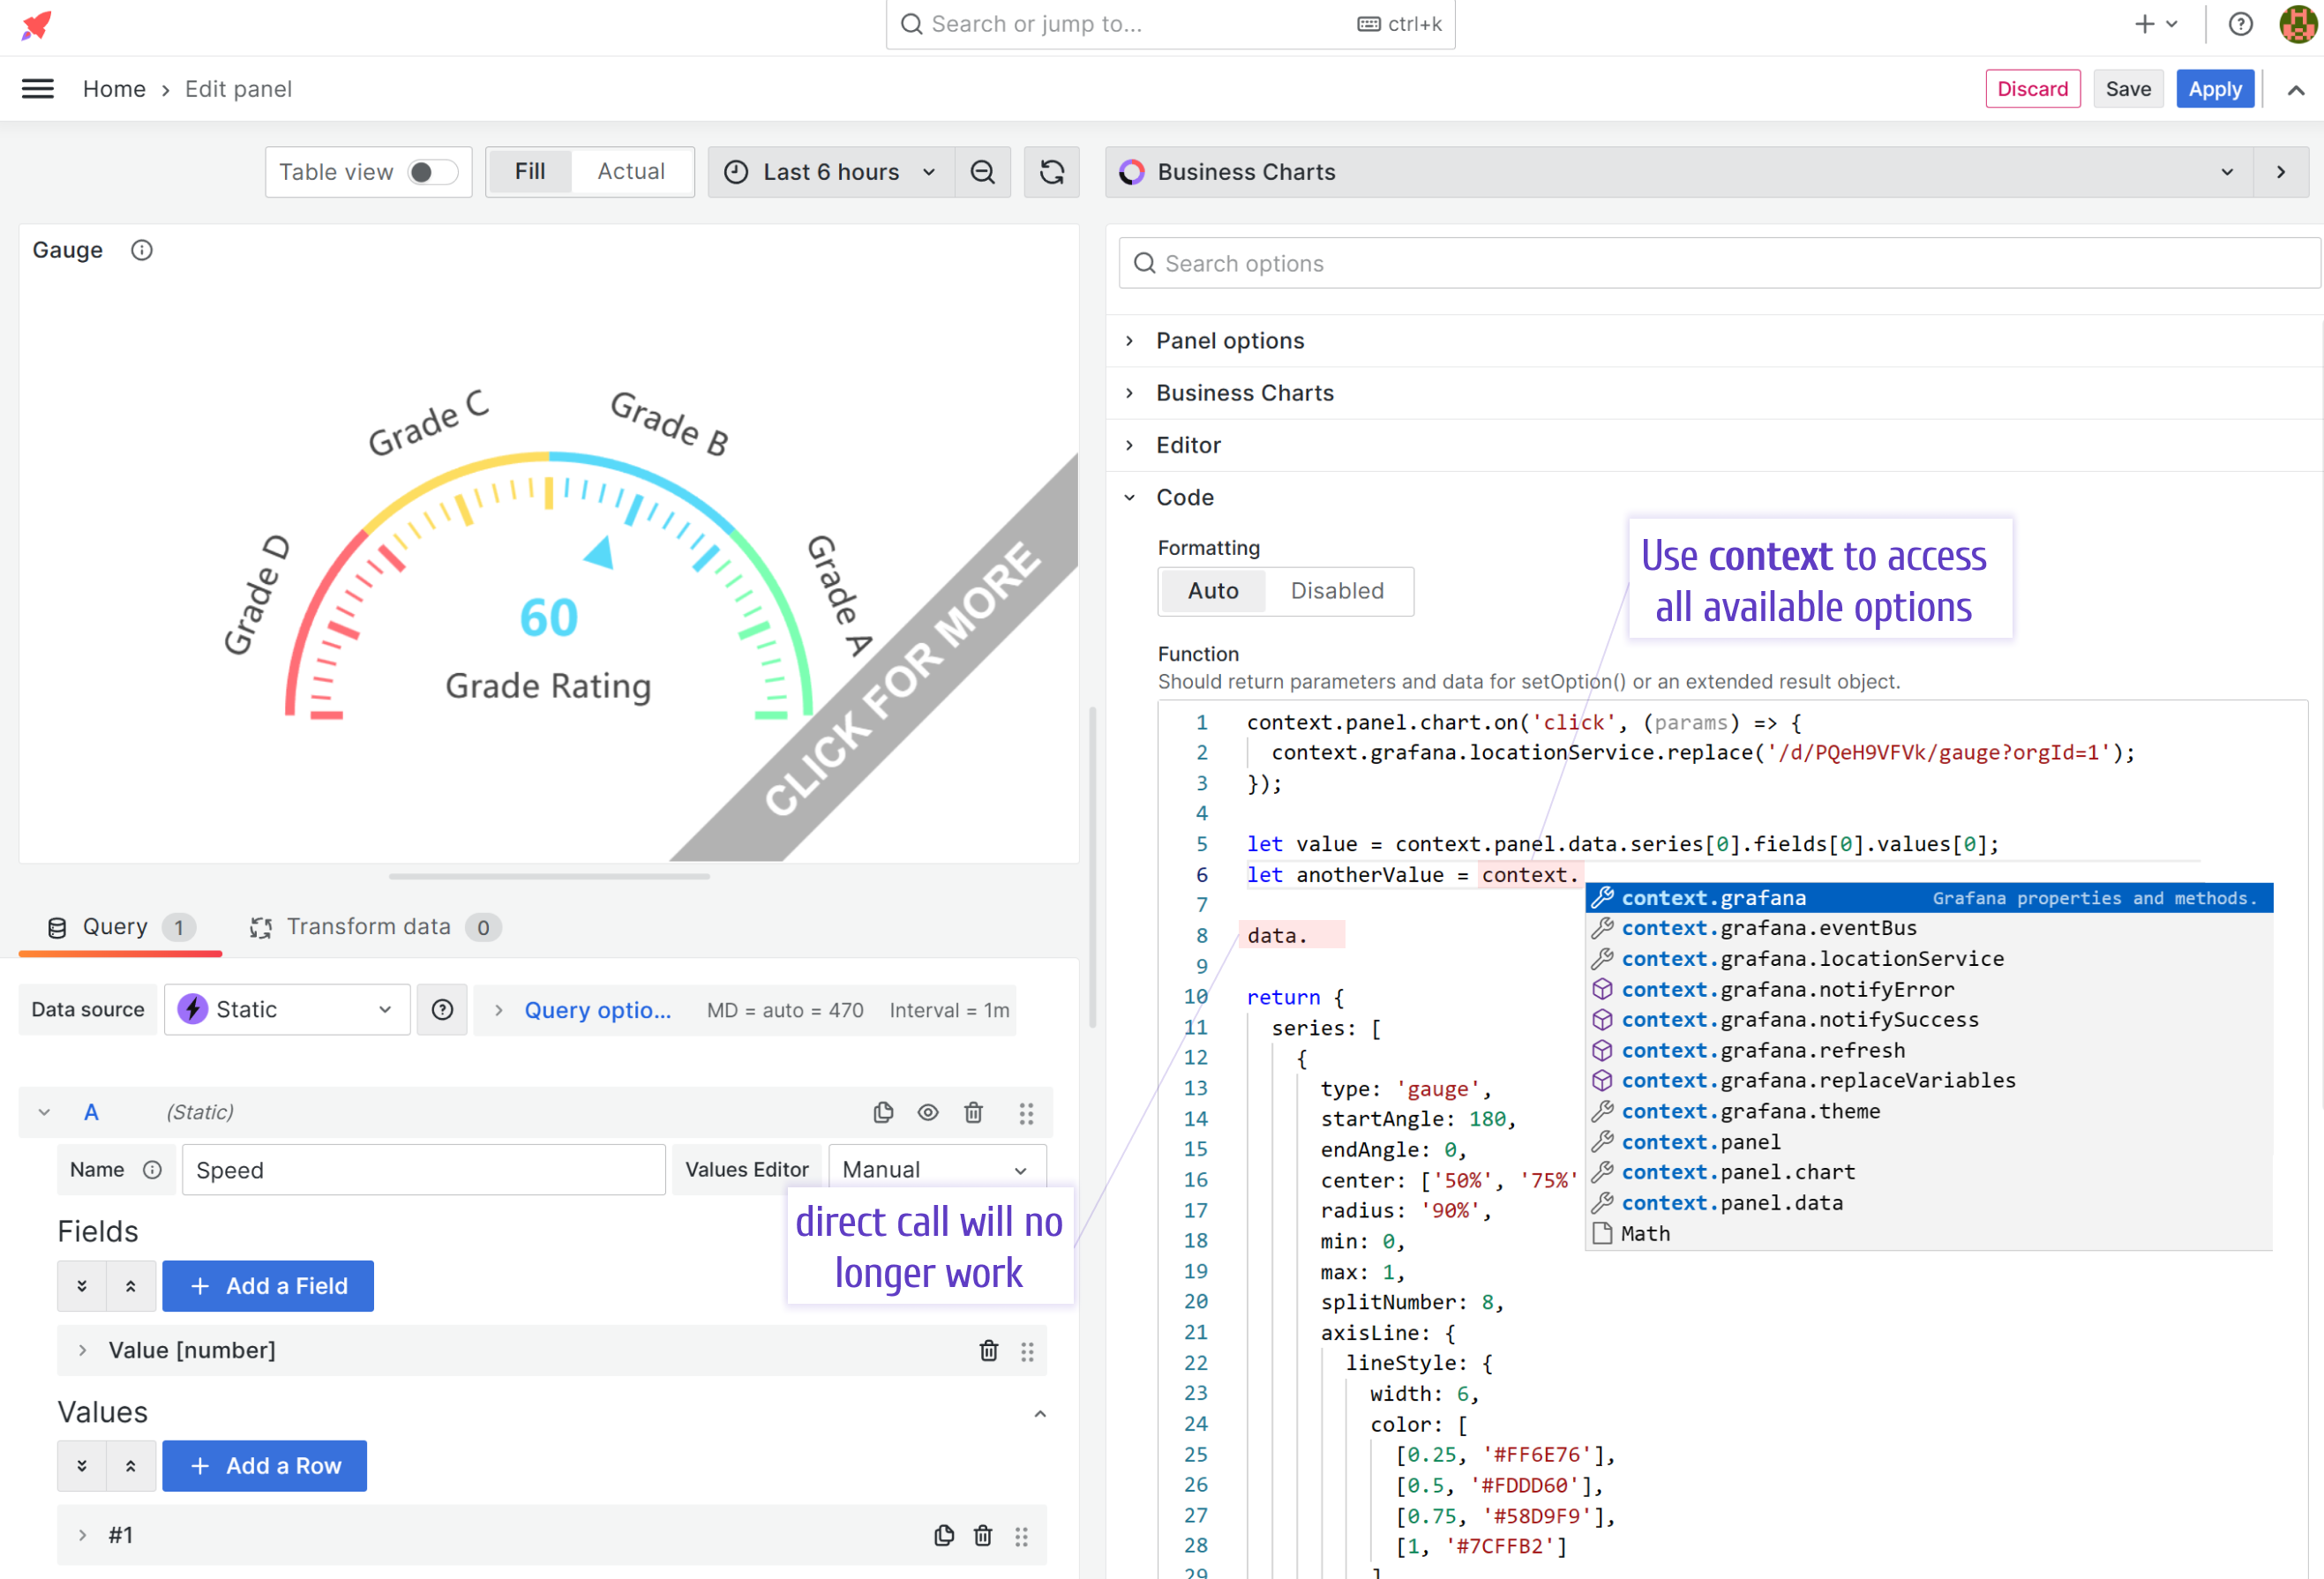
Context parameters
All available parameters are now combined under the context parameter
Just type context and all available options will appear. It makes the searches of what you need easier.
However, note, that previously we allowed the direct call, then now it has stopped working. In order to migrate to this release, please, ensure to reference context as a prefix to all options.
Migration Guide
Please refer to the Code parameters migration guide below.
| Parameter | How to reference starting from 6.0.0 |
|---|---|
| data | context.panel.data |
| echarts | context.echarts |
| echartsInstance | context.panel.chart |
| ecStat | context.ecStat |
| eventBus | context.grafana.eventBus |
| locationService | context.grafana.locationService |
| notifyError | context.grafana.notifyError |
| notifySuccess | context.grafana.notifySuccess |
| replaceVariables | context.grafana.replaceVariables |
| theme | context.grafana.theme |
Grafana 10 and Grafana 11
Grafana 9 is not supported.
Our plugins always follow the latest Grafana versions and stay compatible with the most recent releases. That means, however, that we have to sunset the support of obsolete releases.
The latest Business Charts panel 6.0.0 fully supports Grafana 10 and the upcoming 11 releases.
Getting Started
You can install the Business Charts panel from the Grafana Plugins catalog or using the Grafana command line tool.
For the latter, please use the following command.
grafana cli plugins install volkovlabs-echarts-panel
Tutorial
This is the first video we created about Business Charts after the plugin rebranding. It features dazzling chart examples followed by a high-level plugin architecture. Knowing the basics of plugin architecture will help you create your custom charts.
To get you started quicker we prepared the web resource with numerous ready-to-use examples. In the video, Daria demonstrates how to work with this resource.
The main obstacle for many plugin users is the data transmission from the Grafana data frame(s) into the Charts function. In the video, in addition to the resource with how-to examples, Daria introduces the Visual Editor - the mechanism we started to work on to simplify the transmission.
We have many other tutorials that you can find helpful. You can review all related to this plugin tutorials here.
Release Notes
- Requires Grafana 10 and Grafana 11.
- Removed non-context code parameters. Please update parameters to use
context.
Code parameters migration guide
- data -> context.panel.data
- theme -> context.grafana.theme
- echartsInstance -> context.panel.chart
- echarts -> context.echarts
- ecStat -> context.ecStat
- replaceVariables -> context.grafana.replaceVariables
- eventBus -> context.grafana.eventBus
- locationService -> context.grafana.locationService
- notifySuccess -> context.grafana.notifySuccess
- notifyError -> context.grafana.notifyError
Features / Enhancements in 6.0.0
- Updated name to Business Charts panel (#268)
- Added Apache Acknowledgment and update description (#268)
- Updated to Grafana 10.4.1 (#270)
- Removed ArrayVector deprecated in Grafana 11 (#272)
- Updated Apache ECharts deprecation warnings (#272)
Features / Enhancements in 5.3.0
- Updated to Apache ECharts 5.5.0 (#257)
- Updated code parameters with Code Parameters Builder (#261)
- Updated auto size code editor (#263)
Features / Enhancements in 5.2.0
- Updated README and documentation (#214)
- Added visual editor for working with data sources (#211)
- Updated ESLint configuration and refactoring (#237)
- Updated dependencies and Actions (#238)
- Added context parameter to non-visual mode (#245)
- Added refresh function using Application Event Bus (#247)
- Updated to disallow to choose already selected fields (#251)
- Updated echarts.volkovlabs.io to use visual editor and data sources (#248)
- Updated draggable handler in Visual editor (#256)
We're Always Happy to Hear From You!
We value your feedback and are eager to connect with our community and partners. Whether you have a question, an idea, or an issue to report, here’s how you can reach out:
- Community Members: Have a question, want to suggest a new feature, or found a bug? We’d love to hear from you! Please create a GitHub issue to start the conversation.
- Enterprise Partners: Need assistance or have an urgent request? Open a Zendesk ticket for a prompt and dedicated response from our team.
- Join the Conversation: Stay updated and share your thoughts! Subscribe to our YouTube Channel and leave your comments—we can’t wait to hear what you think.
Your input helps us improve, so don’t hesitate to get in touch!