Streaming, data zoom, and documentation updates in Business Charts 4.1.0

We are happy to announce the release of the Business Charts panel 4.1.0 for Grafana. This release includes the following updates:
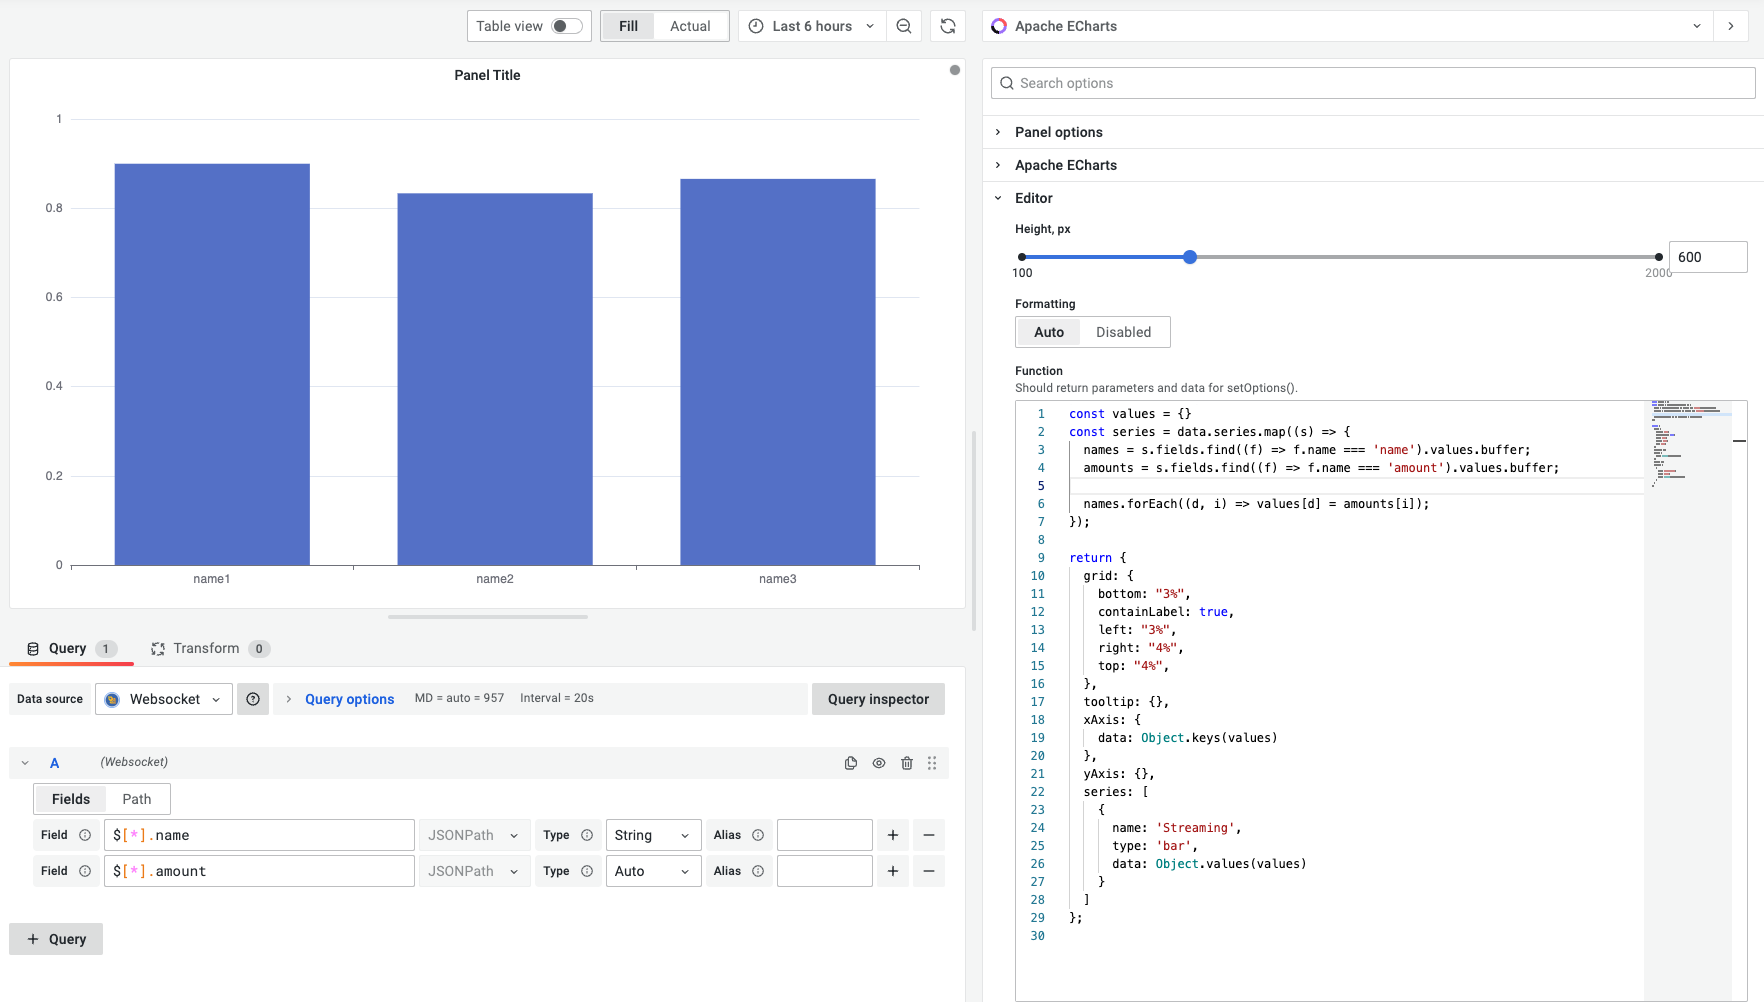
- Added support for streaming for WebSockets and Grafana Live.
- Added the Data Zoom feature updating a time range similar to the TimeSeries panel.
- Updated the product documentation answering community questions.
Streaming
Streaming enables real-time data updates using streaming data sources and Grafana Live. You can find examples and configurations in our documentation.
Grafana Live
Grafana Live is a real-time messaging engine introduced in Grafana v8.0. With Grafana Live, you can push event data to a frontend as soon as an event occurs.
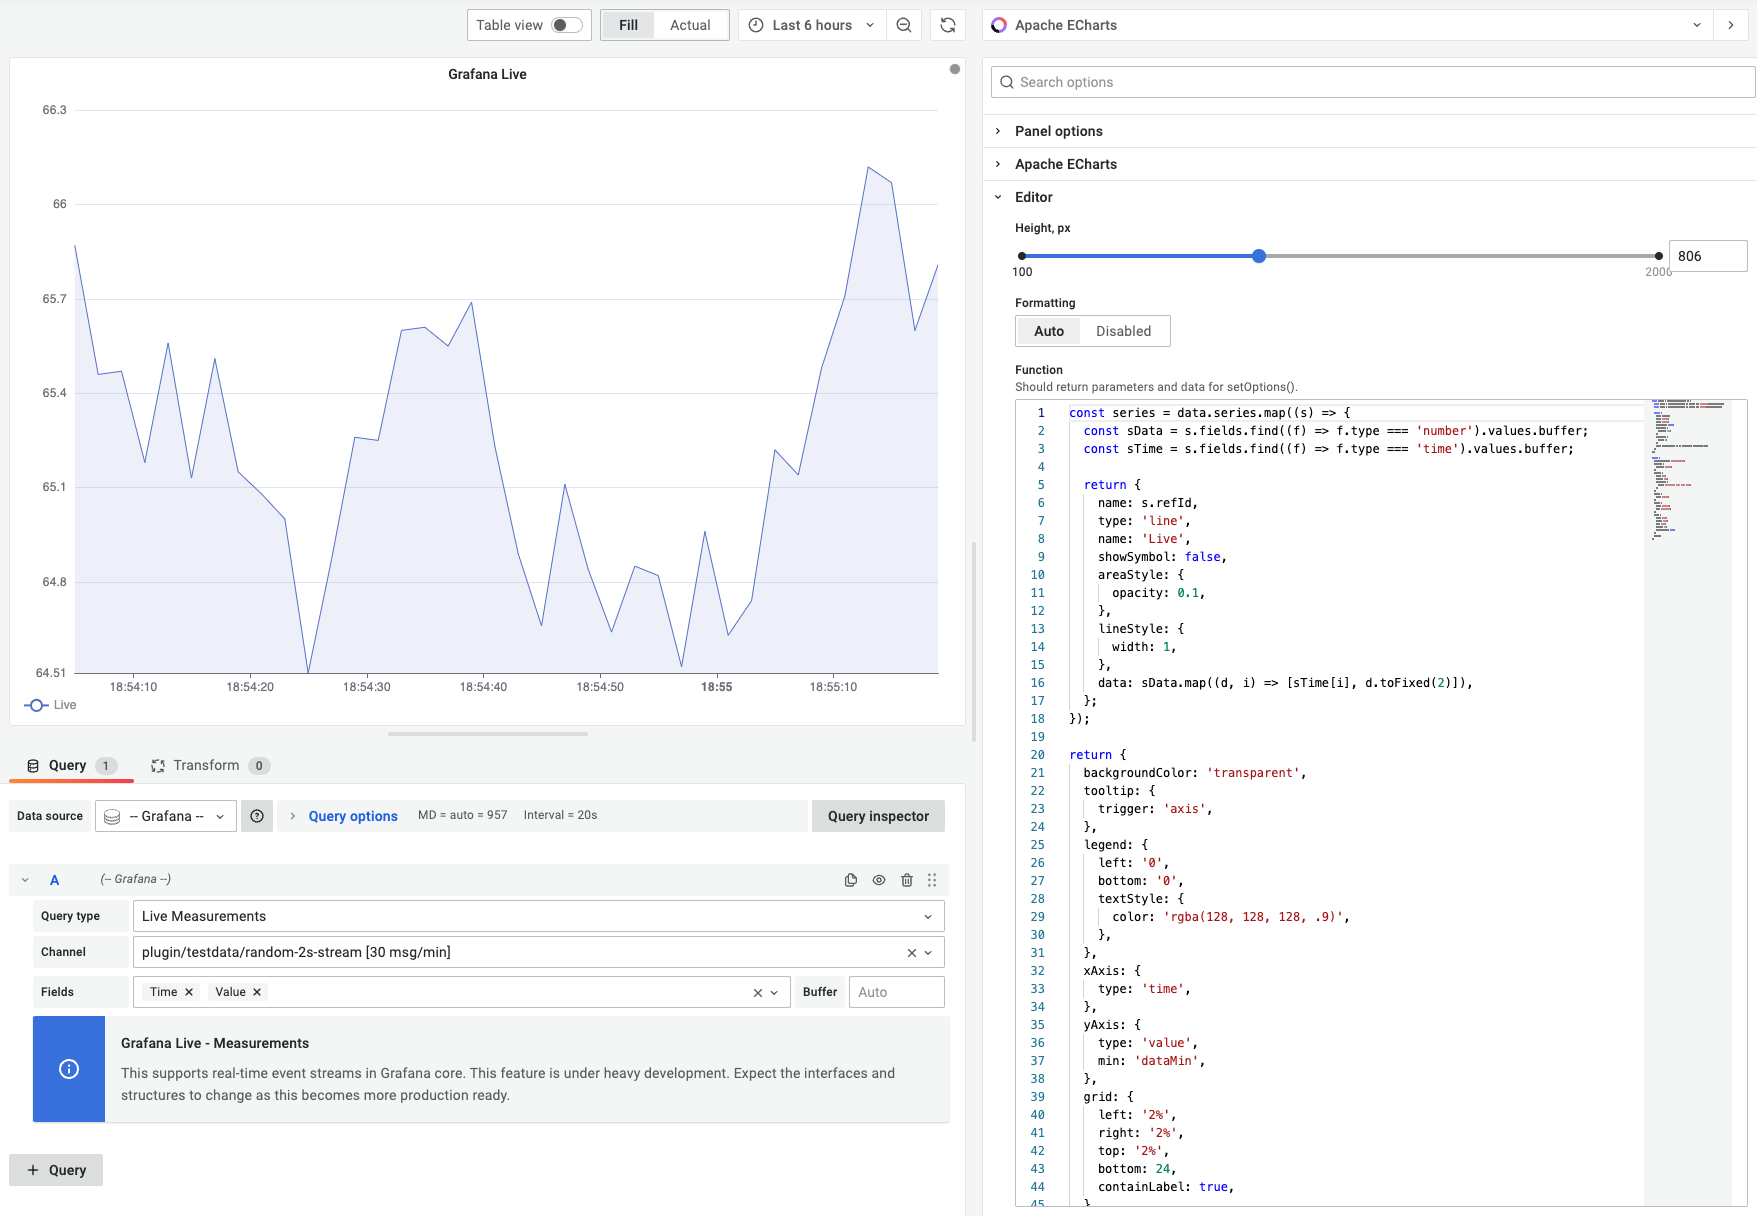
WebSocket API
To stream real-time data, we used the WebSocket data source for Grafana.
Data Zoom feature
The Data Zoom feature allows you to select a time period on the chart for zooming in. Once the time range is selected, the event can update the time range on the dashboard using the locationService parameter, similar to native Grafana behavior.
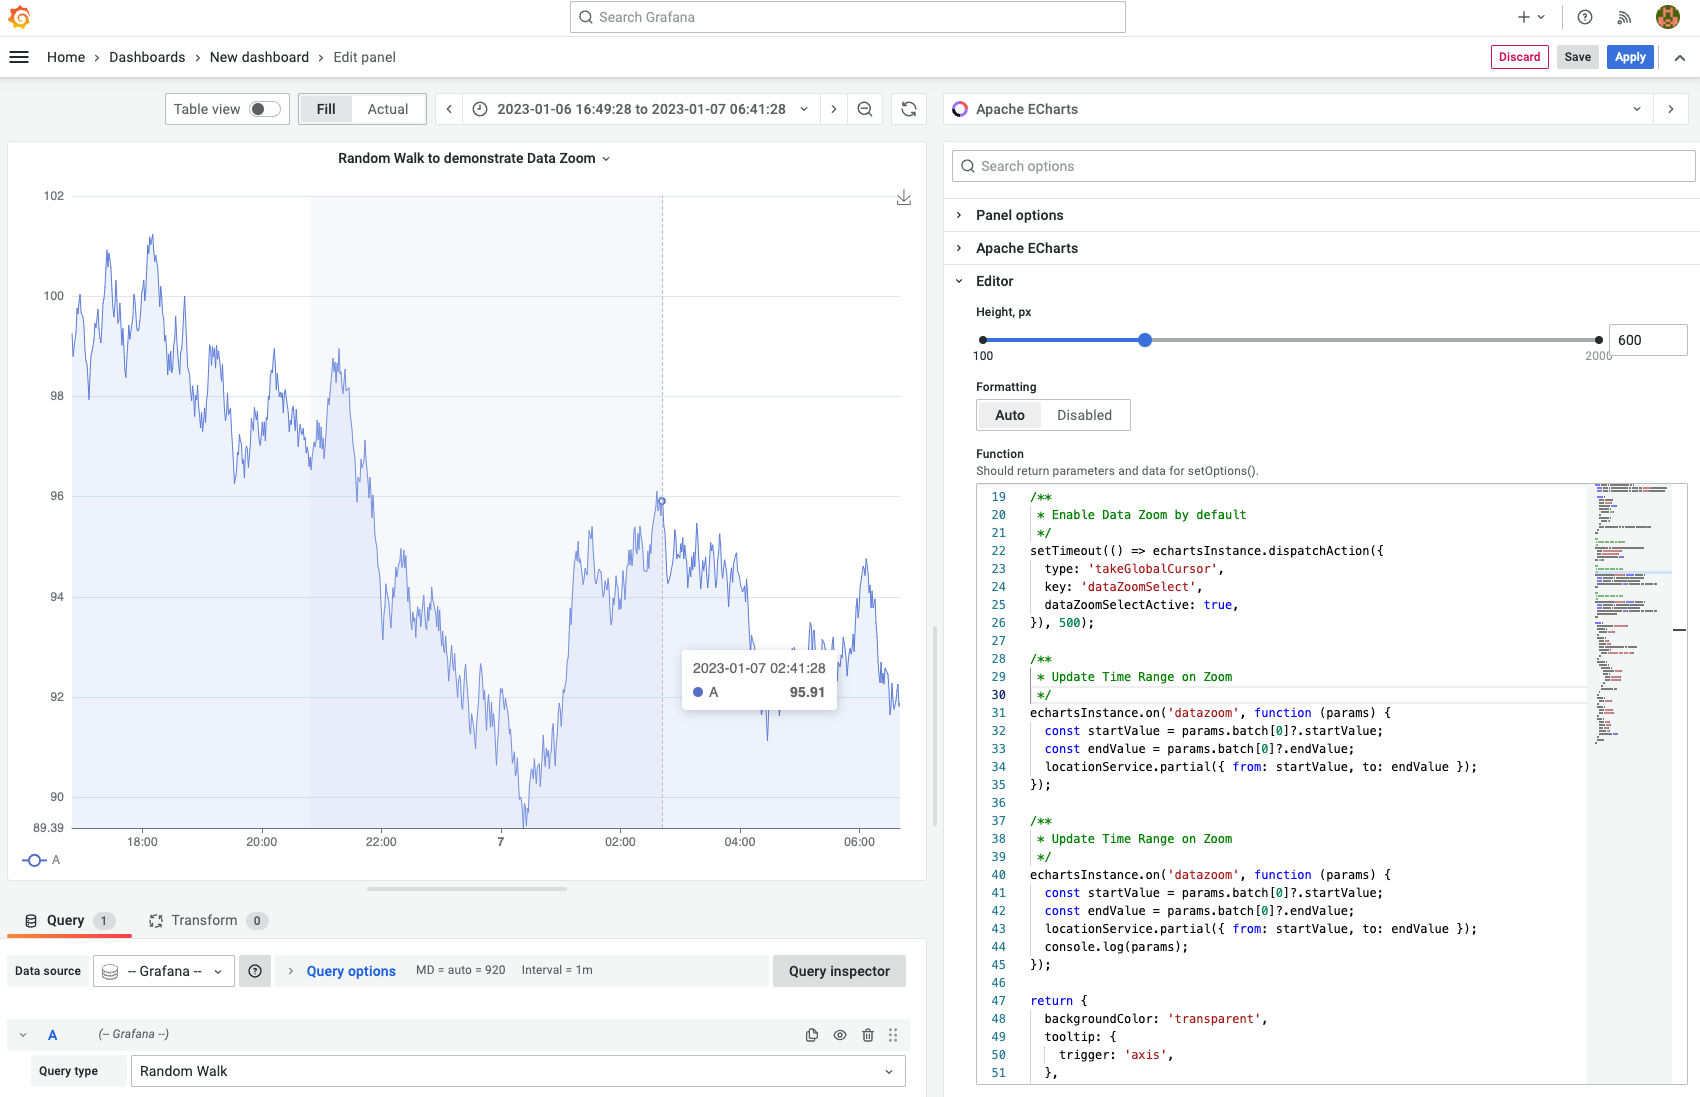
You can find the code snippet in the Event Handling section.
Getting Started
You can install the Business Charts panel from the Grafana Plugins catalog or using the Grafana command line tool.
For the latter, please use the following command.
grafana cli plugins install volkovlabs-echarts-panel
Tutorial
This is the first video we created about Business Charts after the plugin rebranding. It features dazzling chart examples followed by a high-level plugin architecture. Knowing the basics of plugin architecture will help you create your custom charts.
To get you started quicker we prepared the web resource with numerous ready-to-use examples. In the video, Daria demonstrates how to work with this resource.
The main obstacle for many plugin users is the data transmission from the Grafana data frame(s) into the Charts function. In the video, in addition to the resource with how-to examples, Daria introduces the Visual Editor - the mechanism we started to work on to simplify the transmission.
We have many other tutorials that you can find helpful. You can review all related to this plugin tutorials here.
Release Notes
Features / Enhancements
- Synchronized the README file with the product documentation (#111).
- Added the Streaming support for WebSockets and Grafana Live (#113).
- Moved the InfluxDB example to the guest blog post (#115).
- Updated the documentation and tutorials in the README file (#116).
- Added the data zooming to the default Line example (#117).
Volkov Labs Is Now Closed
Following our acquisition, Volkov Labs has officially ceased operations as of September 26, 2025. We are no longer accepting feedback, support requests, or partnership inquiries. The Business Suite for Grafana repositories have been archived on our GitHub organization, and no further development or support will be provided.
We are deeply grateful for the incredible support from our community and partners over the past four years.