EventBus, removed padding, and transparent background in Business Charts 4.2.0

We are happy to announce the release of Business Charts panel 4.2.0. This release includes the following updates:
- Added the
EventBusparameter to publish events. - Removed the panel padding, allowing you to use all of the panel space from corner to corner.
- Updated the default background to
transparentfor light and dark themes. - Updated the plugin to the latest Grafana 9.4.3 toolkit and workflows.
No Padding
The removal of the panel padding lets you use the panel space more effectively for displaying charts, maps, and graphics across the entire width and height of the panel.
Community Use cases
We are amazed by the everyday developments of the community that make use of the latest capabilities in Business Charts panel for Grafana.
Dynamic toolbox
Our community member ftasso shared an extremely interesting use case that displays complex ECharts objects like a sunburst with the toolbox. It dynamically retrieves data and uses a variety of variables for chart generation.
myCallback = (text) => {
  alert(text);
};

const myTextCallbackHelper = "alert('Step 1'); myCallback('Step2');";
const onclick = new Function(myTextCallbackHelper);

let myToolbox = {
  toolbox: {
    show: true,
    itemSize: 30,
    feature: {
      my1: {
        title: "chart",
        icon: "M4.1,28.9h7.1l9.3-22l7.4,38l9.7-19.7l3,12.8h14.9M4.1,58h51.4",
        onclick,
      },
    },
  },
};

return myToolbox;
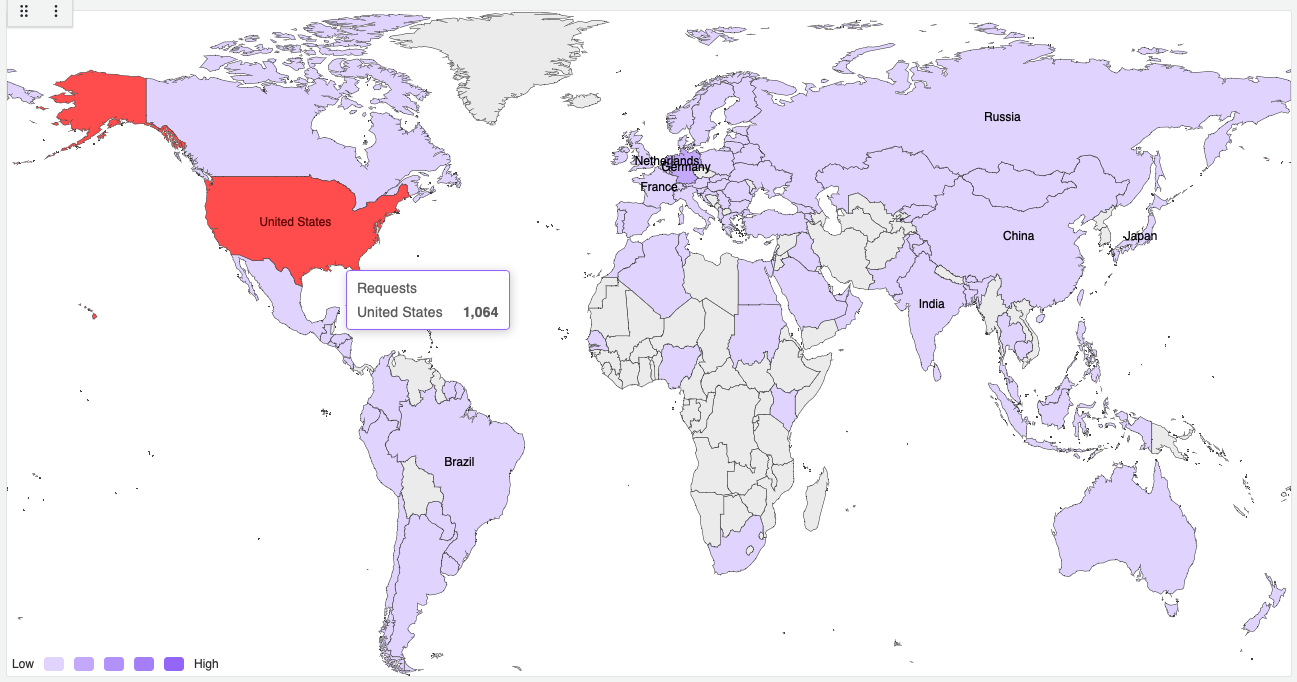
Preserve the selected range on a visual map
Our community member Barryetter shared another use case that allows you to preserve the range slider settings of the visualMap object after the dashboard refresh.
- Specify two dashboard variables. Constants are also fine but you need to hide them from the user. Name them
datarangeStartanddatarangeEndand apply some initial values to them. - In the Apache EChart panel code editor (before the
returnsnippet), add an event handler for thedatarangeselectedevent. Remove any other event handler to prevent creation of duplicate handlers.
echartsInstance.off("datarangeselected");

echartsInstance.on("datarangeselected", (params) => {
  const startValue = params.selected[0];
  const endValue = params.selected[1];
  locationService.partial(
    { "var-datarangeStart": startValue, "var-datarangeEnd": endValue },
    true
  );
});
- In the
visualMapdefinition, set therangeproperty to the dashboard variables using thereplaceVariablesmethod as described in our documentation.
visualMap: [
  {
    type: "continuous",
    left: "center",
    bottom: "0%",
    min: 0,
    max: 30,
    range: [
      replaceVariables("$datarangeStart"),
      replaceVariables("$datarangeEnd"),
    ],
    orient: "horizontal",
    text: ["", "Occupancy"],
    realtime: true,
    calculable: true,
    dimension: 0,
    inRange: {
      color: ["#ffffff", "#0000ff", "#ffff00", "#ff00ff"],
    },
  },
];
Create DOM (Document Object Model) Elements
You can add elements (buttons, checkboxes, dropdown boxes, etc.) to the DOM (Document Object Model) using echartsInstance contributed by Lroy.
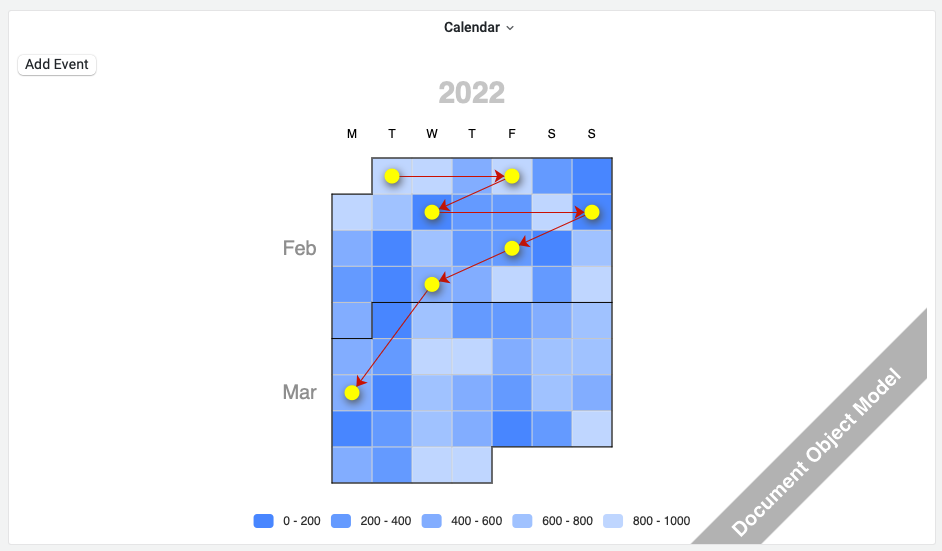
For example, you can add a button with an event handler.
const myFunction = () => {
  alert("myFunction() called!");
};

//Get the DOM for the panel
let dom = context.panel.chart.getDom();

//Get the child nodes
let nodeList = dom.childNodes;

//If we haven't added our controls to the DOM yet
if (nodeList.length < 2) {
  //Create a new button
  const btn = document.createElement("button");

  //Establish button name
  const textnode = document.createTextNode("My Button");
  btn.appendChild(textnode);

  //Add click event handler
  btn.addEventListener("click", myFunction);

  //Create a new <div>
  const div = document.createElement("div");

  //Add button to <div>
  div.appendChild(btn);

  //Insert new <div> ahead of existing chart div
  dom.insertBefore(div, dom.firstChild);
}
Getting Started
You can install the Business Charts panel from the Grafana Plugins catalog or using the Grafana command line tool.
For the latter, please use the following command.
grafana cli plugins install volkovlabs-echarts-panel
Tutorial
This is the first video we created about Business Charts after the plugin rebranding. It features dazzling chart examples followed by a high-level plugin architecture. Knowing the basics of plugin architecture will help you create your custom charts.
To get you started quicker we prepared the web resource with numerous ready-to-use examples. In the video, Daria demonstrates how to work with this resource.
The main obstacle for many plugin users is the data transmission from the Grafana data frame(s) into the Charts function. In the video, in addition to the resource with how-to examples, Daria introduces the Visual Editor - the mechanism we started to work on to simplify the transmission.
We have many other tutorials that you can find helpful. You can review all related to this plugin tutorials here.
Release Notes
Features / Enhancements
- Added
EventBusto the available parameters for publishing events (#122). - Added compatibility with Grafana 9.3.6 (#132).
- Added compatibility with Grafana 9.4.3 (#142).
- Updated CI and release workflows (#134).
- Added
NoPaddingto remove extra padding around (#138). - Set the background color as transparent by default (#139).
- Added the Magic (JavaScript) Trio tutorial (#141).
We're Always Happy to Hear From You!
We value your feedback and are eager to connect with our community and partners. Whether you have a question, an idea, or an issue to report, here’s how you can reach out:
- Community Members: Have a question, want to suggest a new feature, or found a bug? We’d love to hear from you! Please create a GitHub issue to start the conversation.
- Enterprise Partners: Need assistance or have an urgent request? Open a Zendesk ticket for a prompt and dedicated response from our team.
- Join the Conversation: Stay updated and share your thoughts! Subscribe to our YouTube Channel and leave your comments—we can’t wait to hear what you think.
Your input helps us improve, so don’t hesitate to get in touch!