Theme editor, updated Google maps, and increased test coverage in Business Charts 4.4.0

We are happy to announce the release of the Business Charts panel 4.4.0. This release includes the following updates:
- Added Theme Editor to use custom-generated themes from Theme Builder.
- Updated the Google Maps extension to the latest release 1.6.0.
- Increased the test coverage to 90% and added end-to-end test workflow.
- Updated to the latest Grafana 9.5.2 toolkit.
Jack of all trades
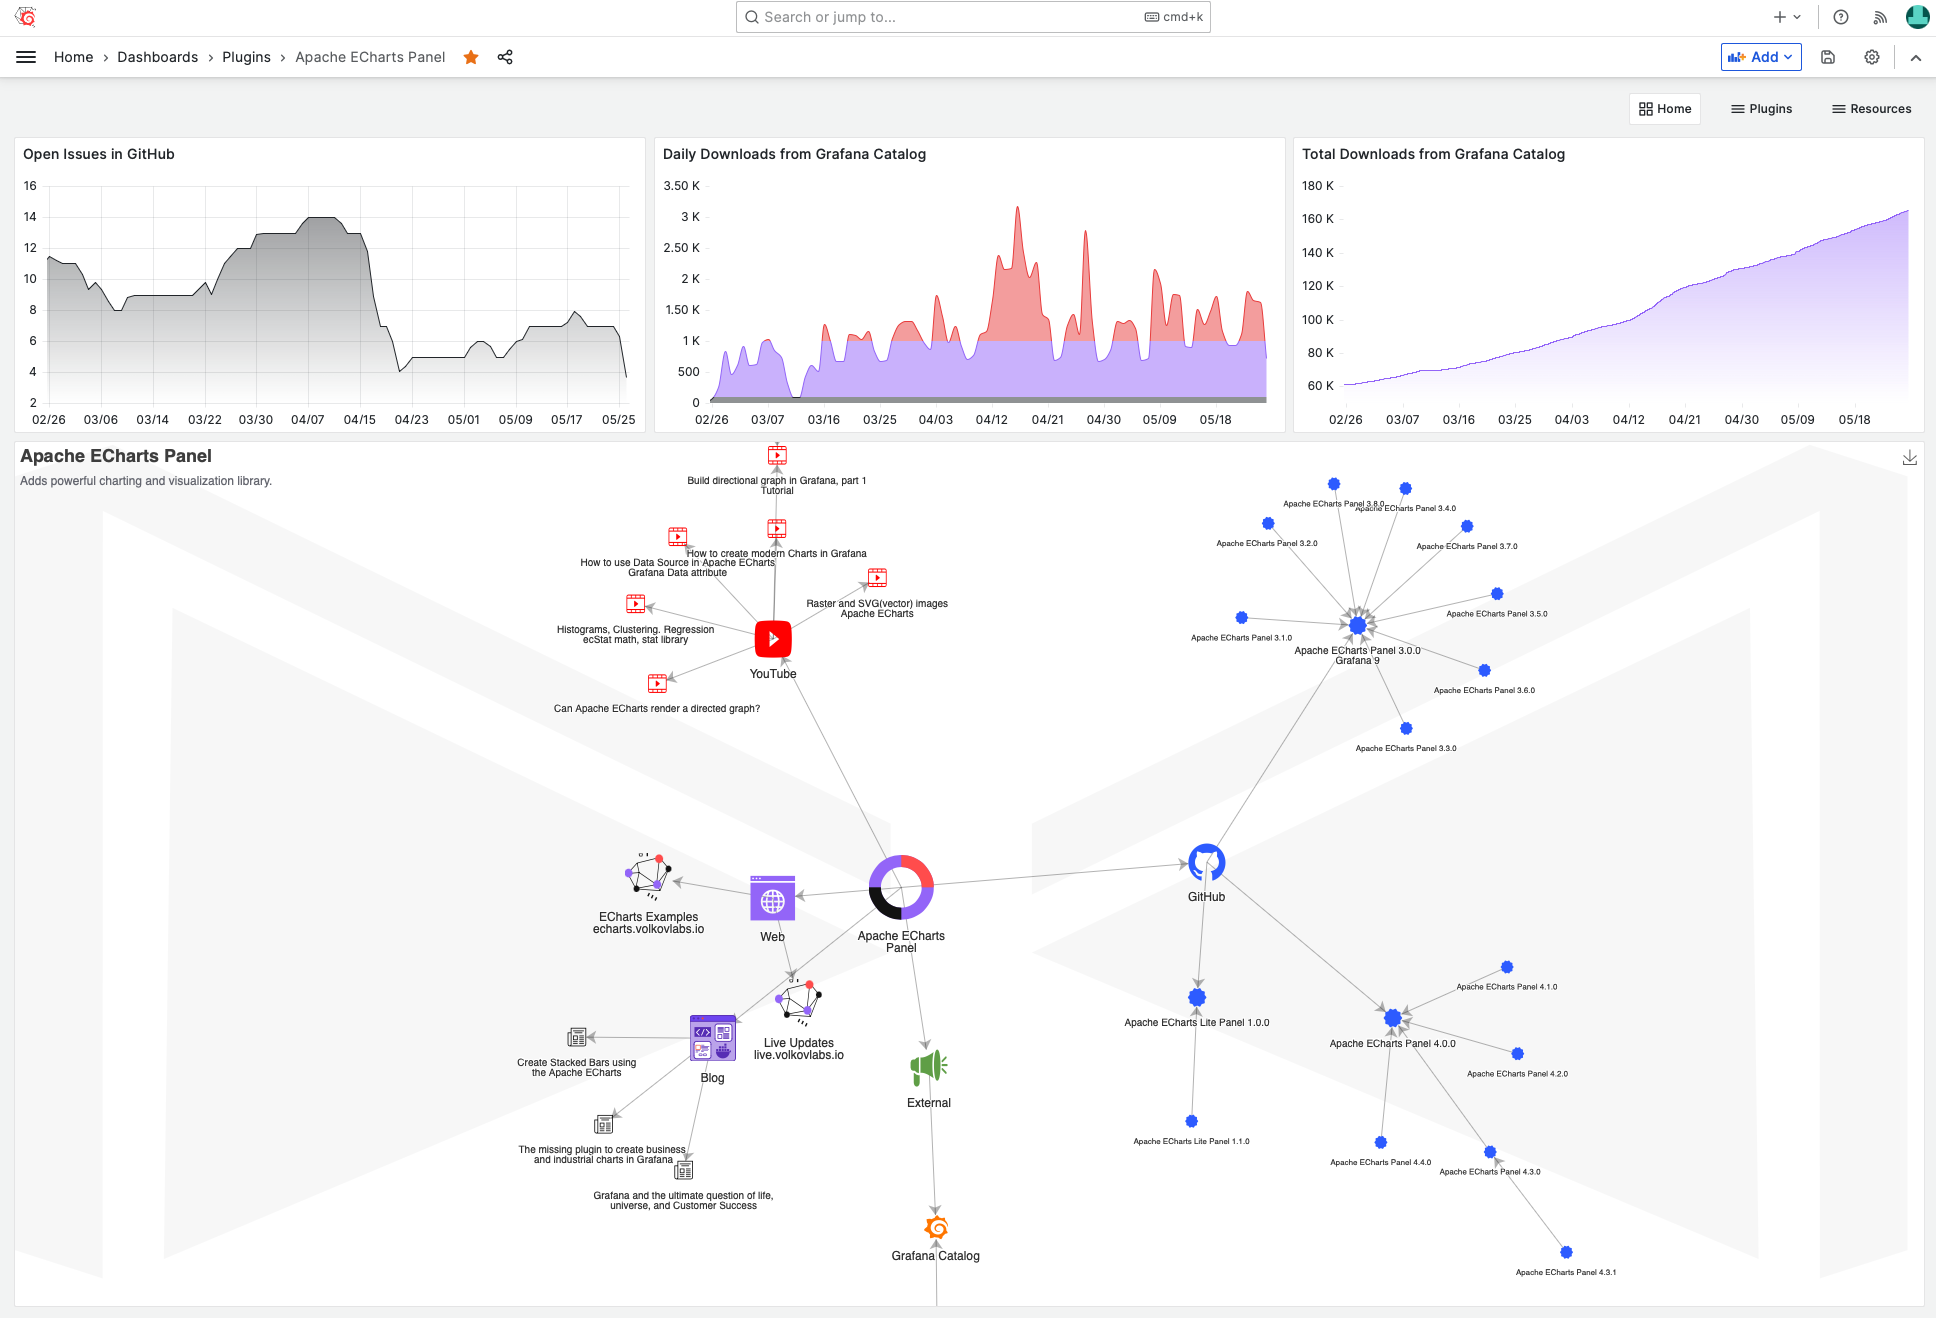
Business Charts panel can solve any visualization challenges reported by our community. When native plugins lack some features or a data source cannot return or transform data in the required format, Business Charts panel let you address any appeared challenges and achieve the results you anticipate.
We have addressed most critical issues in our GitHub repository as we see an increasing number of daily downloads on our way to 200k downloads the Grafana Plugins catalog.
Theme Editor
Theme Editor allows using custom themes generated with Theme Builder.
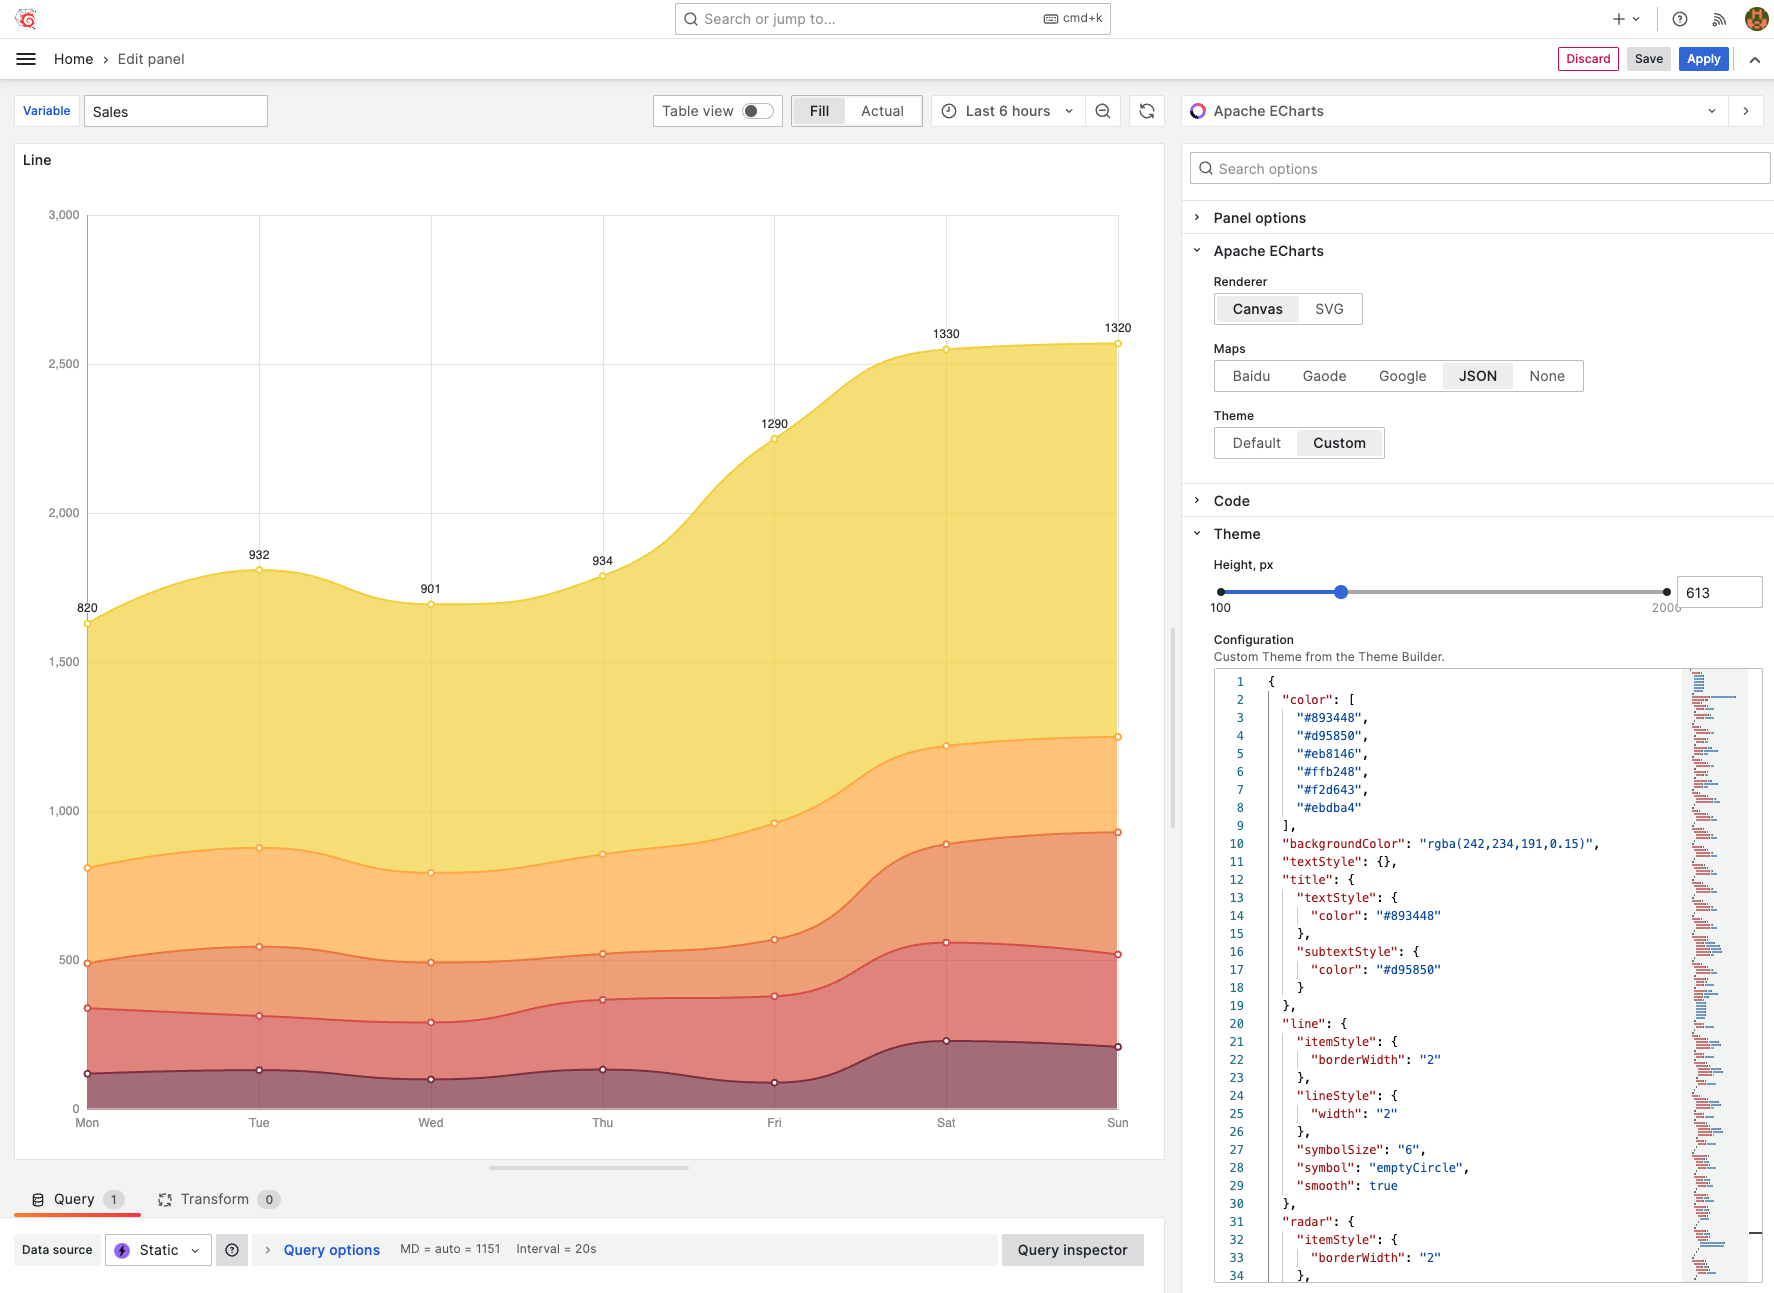
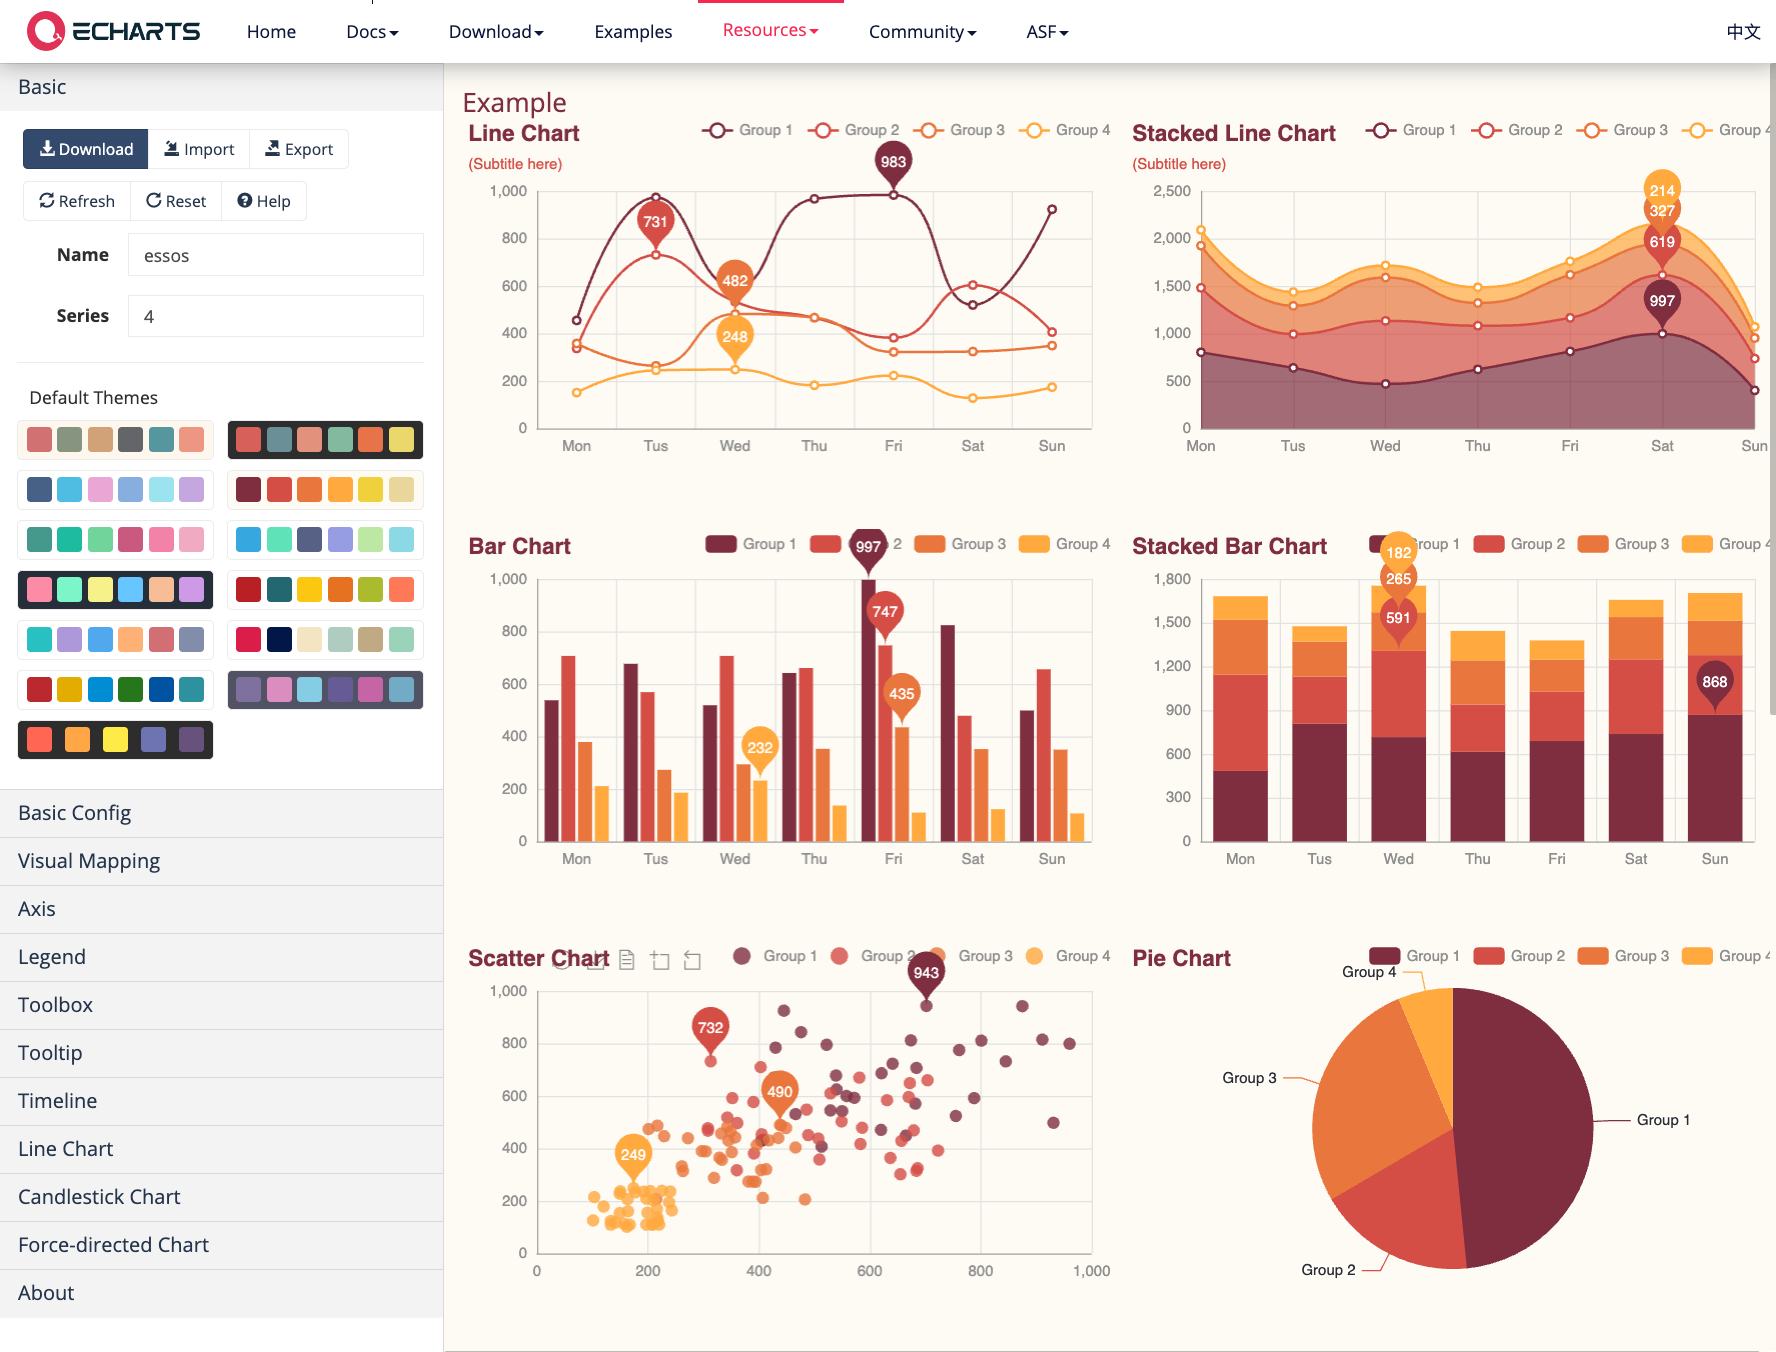
Theme Builder
Theme Builder, created by the Apache ECharts team, provides advanced options to create fully customizable themes. A theme configuration is saved into a JSON file, which you can download and paste into Theme Editor.
Documentation
Answering numerous questions from our community, we continue constantly improving our documentation. We've recently added and updated:
| Section | Description |
|---|---|
| Annotations | Explains how to use annotations. |
| Theme Editor | Explains how to use Theme Editor. |
| Transformations | Explains how to work with transformations. |
| GeoJSON | Explains how to work with GeoJSON Maps. |
Getting Started
You can install the Business Charts panel from the Grafana Plugins catalog or using the Grafana command line tool.
For the latter, please use the following command.
grafana cli plugins install volkovlabs-echarts-panel
Tutorial
This is the first video we created about Business Charts after the plugin rebranding. It features dazzling chart examples followed by a high-level plugin architecture. Knowing the basics of plugin architecture will help you create your custom charts.
To get you started quicker we prepared the web resource with numerous ready-to-use examples. In the video, Daria demonstrates how to work with this resource.
The main obstacle for many plugin users is the data transmission from the Grafana data frame(s) into the Charts function. In the video, in addition to the resource with how-to examples, Daria introduces the Visual Editor - the mechanism we started to work on to simplify the transmission.
We have many other tutorials that you can find helpful. You can review all related to this plugin tutorials here.
Release Notes
Features / Enhancements
- Increased the test coverage and updated the test library (#163).
- Added compatibility with Grafana 9.5.2 (#164).
- Updated the Google Maps extension to version 1.6.0 (#164).
- Added E2E Cypress testing (#165).
- Added Theme Editor to enable usage of custom themes (#167).
- Updated the documentation (#166, #168).
We're Always Happy to Hear From You!
We value your feedback and are eager to connect with our community and partners. Whether you have a question, an idea, or an issue to report, here’s how you can reach out:
- Community Members: Have a question, want to suggest a new feature, or found a bug? We’d love to hear from you! Please create a GitHub issue to start the conversation.
- Enterprise Partners: Need assistance or have an urgent request? Open a Zendesk ticket for a prompt and dedicated response from our team.
- Join the Conversation: Stay updated and share your thoughts! Subscribe to our YouTube Channel and leave your comments—we can’t wait to hear what you think.
Your input helps us improve, so don’t hesitate to get in touch!