Streaming, wordcloud, and fixed memory leak in Business Charts 5.1.0

We are happy to announce the release of the Business Charts panel 5.1.0. This release includes the following updates:
- Added Result v2 with the
unsubscribefunction. - Added Wordcloud Extension to create a tag cloud presentation.
- Updated the streaming functionality to redraw charts.
- Fixed memory leaks when resubscribing to the restore event.
- Updated the Apache ECharts library to version 5.4.3
- Requires Grafana 9 or Grafana 10.
- Added support for Grafana 10.0.3 and deprecated support for Grafana 8.5.
Result v2 with unsubscribe function
The extended result object allows you to return the configuration, options, and unsubscribe functions to prevent memory leaks. You can use it to subscribe and publish events to the EventBus.
return {
  version: 2,
  config: { notMerge: true },
  option: {
    tooltip: {
      formatter: '{a} <br/>{b} : {c}%'
    },
    series: [
      {
        name: 'Pressure',
        type: 'gauge',
        detail: {
          formatter: '{value}'
        },
        data: [
          {
            value: 50,
            name: 'SCORE'
          }
        ]
      }
    ]
  },
  unsubscribe: () => {
    console.log('unsubscribeFunction')
  }
};
Please explore details about the extended result in the plugin's documentation.
Wordcloud Extension
The Wordcloud extension renders a tag cloud presentation on a two-dimensional canvas.
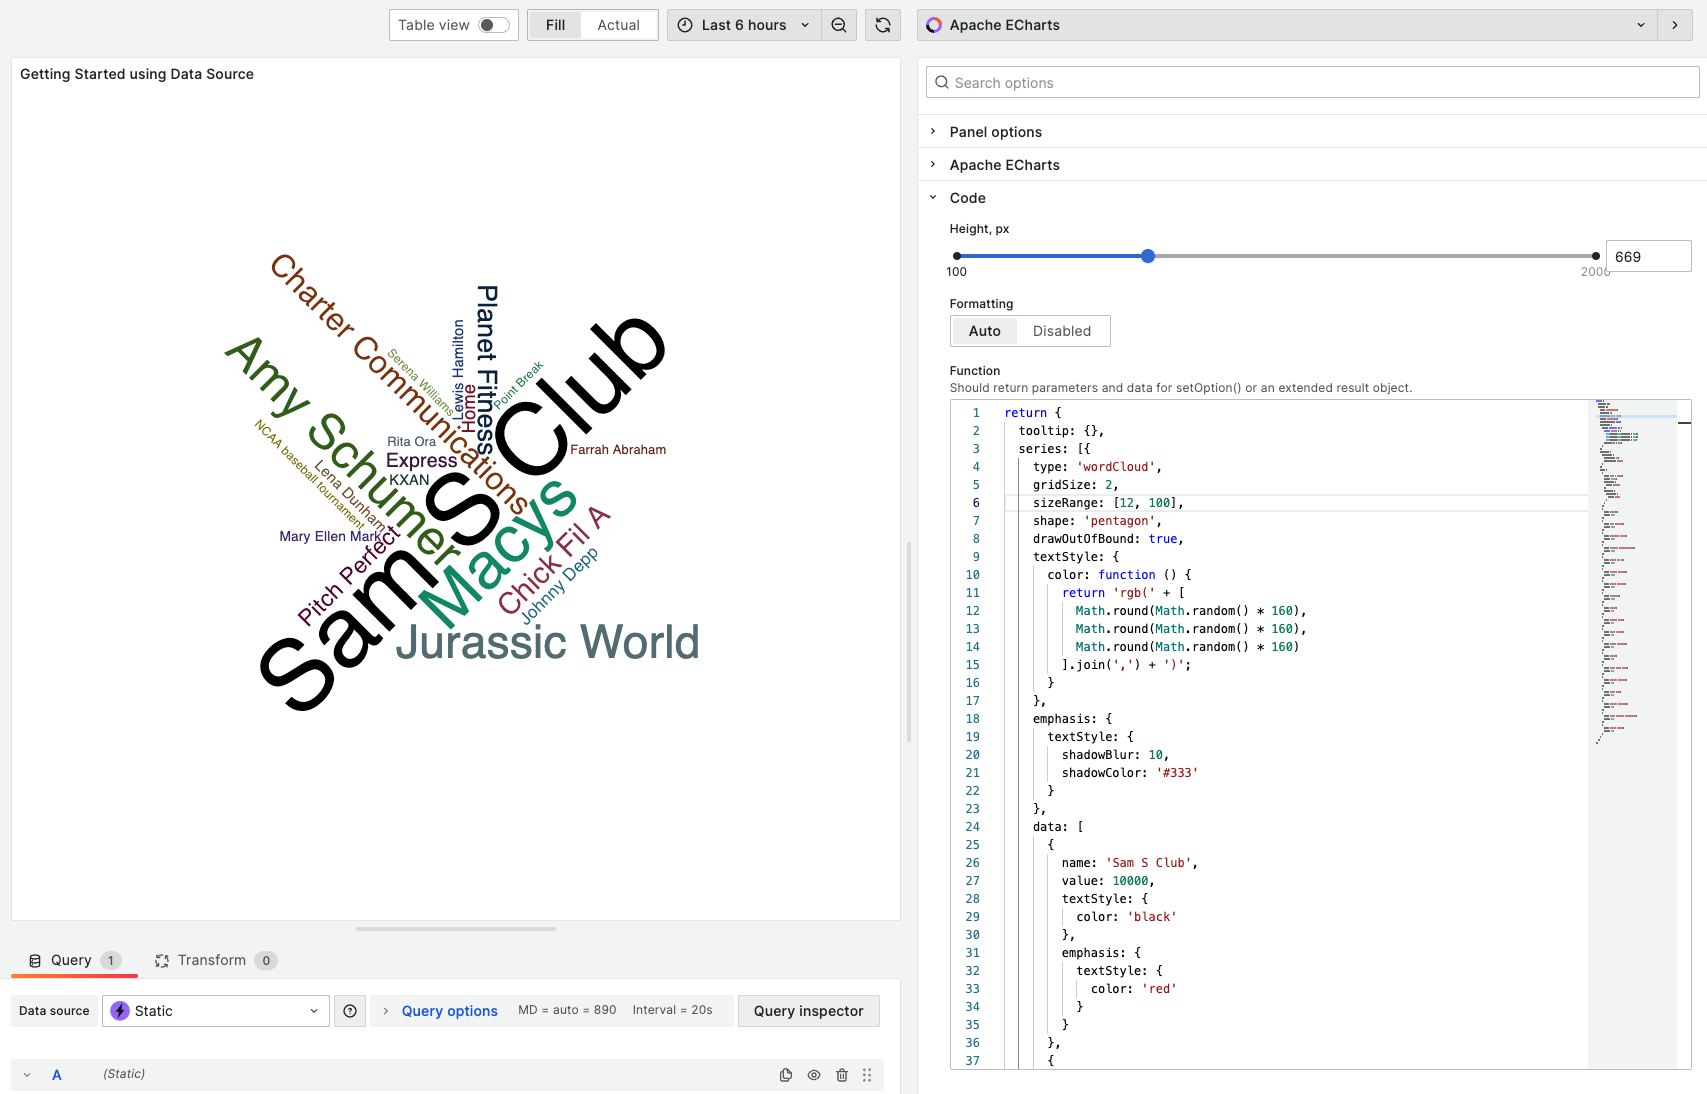
Please check out the extension documentation for details on the Wordcloud extension.
Streaming
Streaming enables the real-time data update with streaming data sources and Grafana Live. Business Charts panel supports the streaming since version 4.1.0.
Apache ECharts version 5.0.0 addressed the rendering issue for live data.
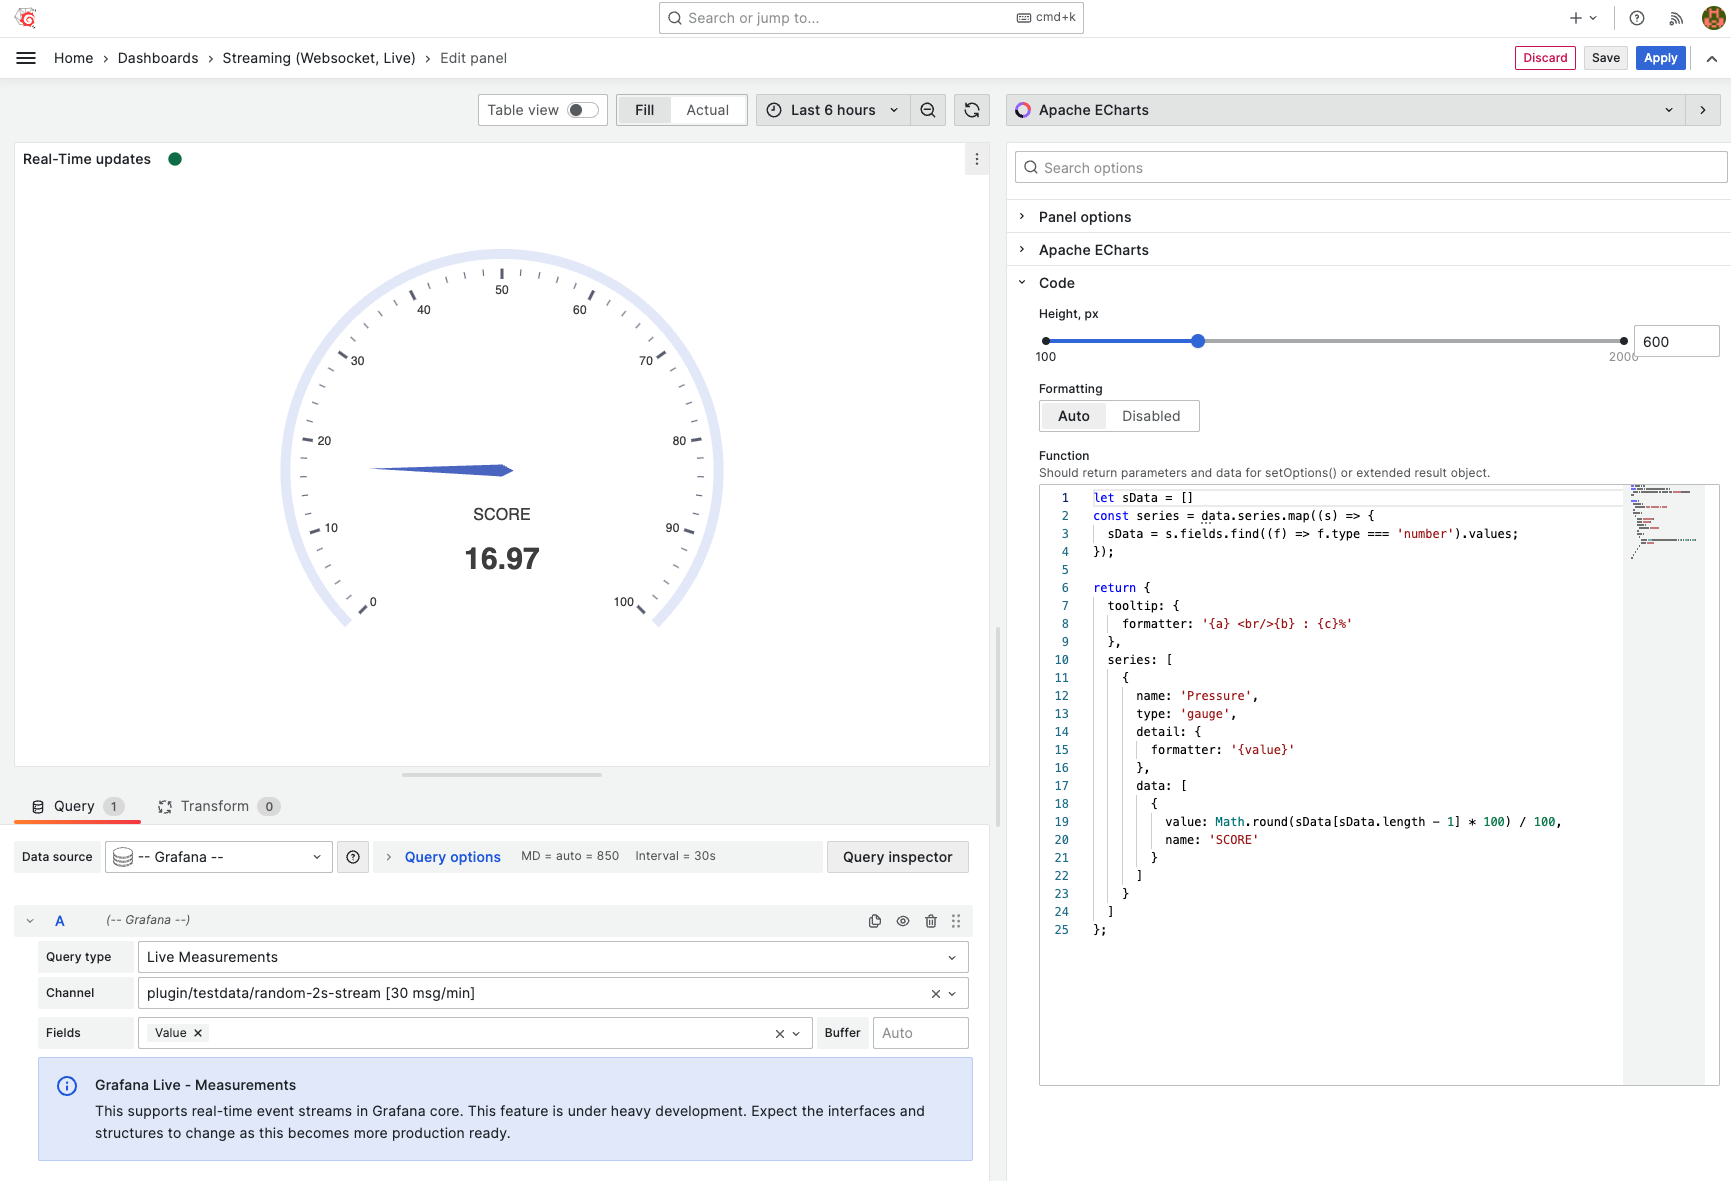
Please check our documentation with Streaming use cases.
Memory Leak
We've fixed the memory leaks on resubscribing to the restore event handler. We want to thank you our community member sergiomonteroselma for reporting this issue and helping us with its troubleshooting.
We recommend that you update Business Charts panel to the latest version 5.1.0 to avoid Out Of Memory errors after continuous refresh of the dashboard for a long period of time.
Apache ECharts 5.4.3
We continue updating the plugin with the latest version of the Apache ECharts library and recently updated it to version 5.4.3:
- [Feature] [axisPointer] Add triggerEmphasis option to disable emphasis. #18524 (juliepagano)
- [Feature] [sankey] Support trajectory for emphasis state. #17451 (ElayGelbart)
- [Fix] [sankey] Fix sankey line color 'target'/'source'/'gradient' doesn't work in non-normal state. #18834 (linghaoSu)
- [Fix] [sankey] Fix value is undefined in label/edgeLabel formatter. #18733 (plainheart)
- [Fix] [sunburst] Fix sunburst label may rotate when labelLayout.hideOverlap is enabled. #18808 (linghaoSu)
- [Fix] [graph] Fix graph chart can't be hidden by legend due to edgeLabel NPE. #18624 (plainheart)
- [Fix] [state] Fix focus self doesn't work when item emphasis by other component. #18511 (linghaoSu)
- [Fix] [axis] Fix last tick doesn't show for single data. #18469 (Ovilia)
- [Fix] [pie] Fix incorrect response area of pie piece when selectedOffset is enabled and animation is disabled. #1011 (plainheart)
- [Fix] [custom] Fix user-defined info property was not available in the event handler. #18400 (sobolewsk)
- [Fix] [legend] Inherit legend rich text color from legend's options. #18260 (ChepteaCatalin)
- [Fix] [label] Fix ellipsis was not working. #18525 (Ovilia)
- [Fix] [label] Fix endLabel fails with null data. #18841 (Ovilia)
- [Fix] [util] Fix pattern has no zero padding in time format util. #18535 (linghaoSu)
- [Fix] [api] Only deprecate disConnect but not disconnect. #18758 (Justineo)
- [Fix] [i18n] Fix the abbr of "March" for the DE language ("Mar" -> "Mrz"). #18387 (Stebeber)
- [Fix] [type] Fix wrong type for data item value of the parallel series. #18425 (ManishDait)
- [Fix] [type] Allow passing null to the parameters of init function. #18575 (zhuscat)
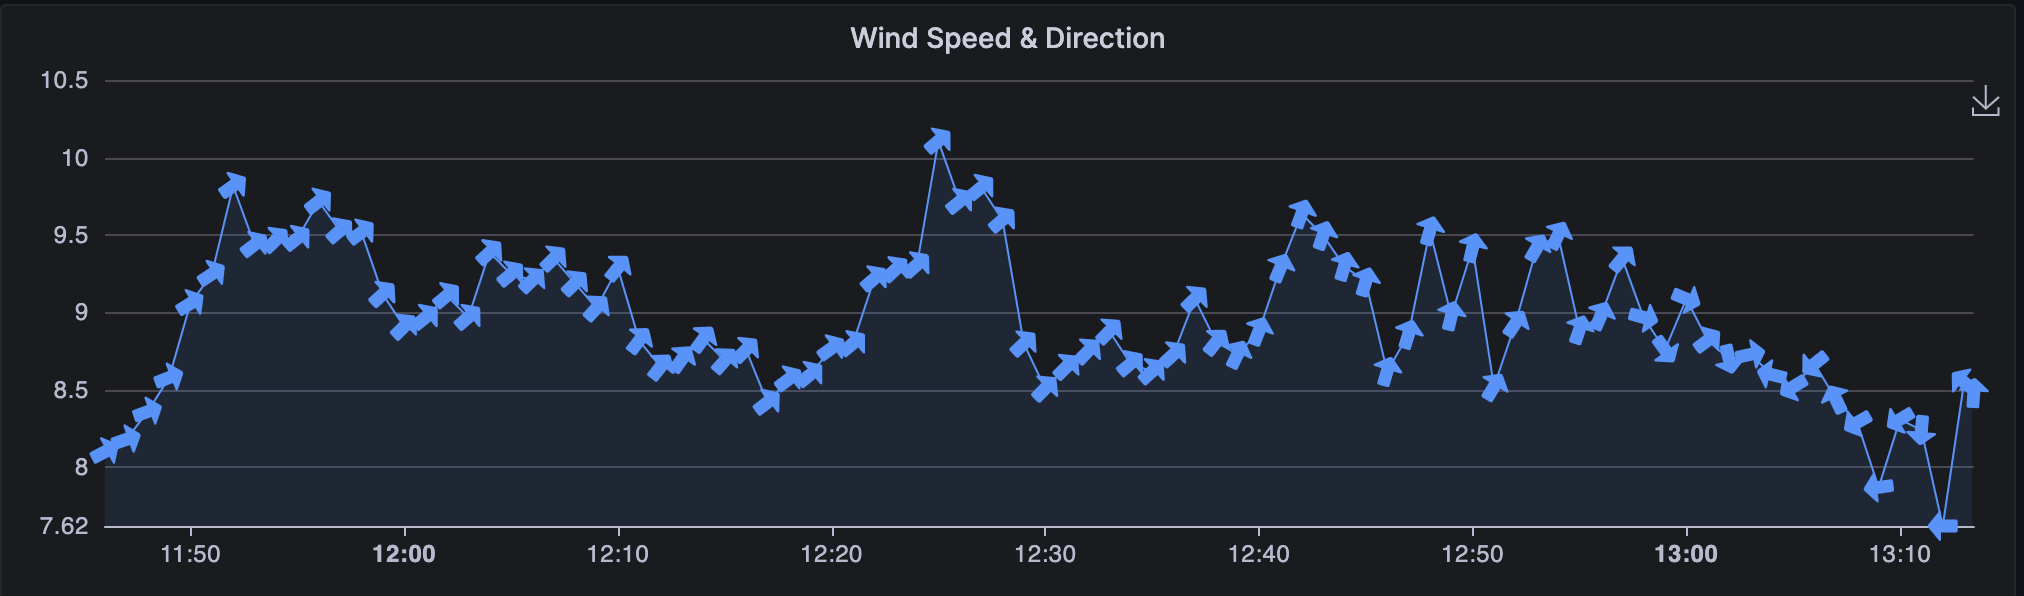
Wind Speed
A graph example showing both wind speed & direction prepared by our community member tkurki:
const ecData = [];

if (data.series.length === 0) {
  return {};
}

const time = data.series[0].fields[0].values;
const direction = data.series[0].fields[1].values;
const speed = data.series[1].fields[1].values;

for (let i = 0; i < data.series[0].length; i++) {
  ecData.push({
    value: [time.get(i), Number(speed.get(i)).toFixed(2)],
    symbolRotate: (direction.get(i) / Math.PI) * 180 - 90,
  });
}

const series = {
  name: data.series[0].refId,
  type: "line",
  showSymbol: true,
  symbol:
    "path://m13.022 14.999v3.251c0 .412.335.75.752.75.188 0 .375-.071.518-.206 1.775-1.685 4.945-4.692 6.396-6.069.2-.189.312-.452.312-.725 0-.274-.112-.536-.312-.725-1.451-1.377-4.621-4.385-6.396-6.068-.143-.136-.33-.207-.518-.207-.417 0-.752.337-.752.75v3.251h-9.02c-.531 0-1.002.47-1.002 1v3.998c0 .53.471 1 1.002 1z",
  symbolSize: 15,
  areaStyle: {
    opacity: 0.1,
  },
  lineStyle: {
    width: 1,
  },
  data: ecData,
};

/**
 * Enable Data Zoom by default
 */
setTimeout(
  () =>
    echartsInstance.dispatchAction({
      type: "takeGlobalCursor",
      key: "dataZoomSelect",
      dataZoomSelectActive: true,
    }),
  500
);

/**
 * Update Time Range on Zoom
 */
echartsInstance.on("datazoom", function (params) {
  const startValue = params.batch[0]?.startValue;
  const endValue = params.batch[0]?.endValue;
  locationService.partial({ from: startValue, to: endValue });
});

return {
  backgroundColor: "transparent",
  tooltip: {
    trigger: "axis",
  },
  legend: {
    left: "0",
    bottom: "0",
    data: ["Wind Speed & Angle"],
    textStyle: {
      color: "rgba(128, 128, 128, .9)",
    },
  },
  toolbox: {
    feature: {
      dataZoom: {
        yAxisIndex: "none",
        icon: {
          zoom: "path://",
          back: "path://",
        },
      },
      saveAsImage: {},
    },
  },
  xAxis: {
    type: "time",
  },
  yAxis: {
    type: "value",
    min: "dataMin",
  },
  grid: {
    left: "2%",
    right: "2%",
    top: "2%",
    bottom: 24,
    containLabel: true,
  },
  series,
};
Getting Started
You can install the Business Charts panel from the Grafana Plugins catalog or using the Grafana command line tool.
For the latter, please use the following command.
grafana cli plugins install volkovlabs-echarts-panel
Tutorial
This is the first video we created about Business Charts after the plugin rebranding. It features dazzling chart examples followed by a high-level plugin architecture. Knowing the basics of plugin architecture will help you create your custom charts.
To get you started quicker we prepared the web resource with numerous ready-to-use examples. In the video, Daria demonstrates how to work with this resource.
The main obstacle for many plugin users is the data transmission from the Grafana data frame(s) into the Charts function. In the video, in addition to the resource with how-to examples, Daria introduces the Visual Editor - the mechanism we started to work on to simplify the transmission.
We have many other tutorials that you can find helpful. You can review all related to this plugin tutorials here.
Release Notes
- Requires Grafana 9 and Grafana 10
Features / Enhancements in 5.1.0
- Added compatibility with Grafana 10.0.3 (#206).
Bugfixes in 5.1.0
- Fixed memory leaks when resubscribing to the restore event (#208).
Features / Enhancements in 5.0.0
- Updated the product documentation with recent updates (#182).
- Updated examples for Grafana 10 (#190).
- Added Result v2 with unsubscribe function (#188).
- Updated the streaming to redraw charts (#188).
- Added compatibility with Grafana 10.0.0 (#191).
- Updated the README file and panel options (#192).
- Deprecated support for Grafana 8.5 (#193).
- Updated support for Grafana 10.0.2 dependencies (#195).
- Updated ESLint configuration (#196).
- Integrated the Wordcloud extension (#198).
- Updated the Apache ECharts library to version 5.4.3 (#199).
We're Always Happy to Hear From You!
We value your feedback and are eager to connect with our community and partners. Whether you have a question, an idea, or an issue to report, here’s how you can reach out:
- Community Members: Have a question, want to suggest a new feature, or found a bug? We’d love to hear from you! Please create a GitHub issue to start the conversation.
- Enterprise Partners: Need assistance or have an urgent request? Open a Zendesk ticket for a prompt and dedicated response from our team.
- Join the Conversation: Stay updated and share your thoughts! Subscribe to our YouTube Channel and leave your comments—we can’t wait to hear what you think.
Your input helps us improve, so don’t hesitate to get in touch!