November 2024 Gazette: Master Educator Award, Tutorials, and 28 Million Downloads
Welcome to the November 2024 issue of the Business Gazette by Volkov Labs! This month was packed with achievements, educational content, and exciting updates. Here's what we'll cover:
- Master Educator Award: Celebrating our recognition by Grafana.
- Release Dashboard Tutorial: A step-by-step guide to building powerful Grafana dashboards.
- 28 Million Downloads: A milestone for the Business Suite.
- Plugin Release News: Updates to Business Table, Charts, Calendar, and Forms.
- Documentation Revamp: Improved guides for the Business Table plugin.
Let's dive into the highlights of November 2024!
Master Educator Award
We are thrilled to announce that in December, we received the Master Educator Grafana Champions Award! This prestigious recognition celebrates our dedication to creating high-quality educational content, including blog posts, tutorials, and video guides, to help the Grafana community unlock its full potential.

Reflecting on the online award ceremony, two thoughts stood out:
- Grafana's Championship program is exceptional in fostering community growth.
- Community recognition is incredibly motivating. We're inspired to deliver even more innovative products, solutions, and tutorials in the coming year. Stay tuned!
Want to learn more about Grafana Champions or share your own content? Connect with the community on Grafana Forums!
Release Dashboard Tutorial
Our mission at Volkov Labs is to empower the Grafana community with practical tools and knowledge. One of our most popular resources is the YouTube video "Create Your Business Grafana Dashboard", which has garnered over 34,000 views. This highlights the community's eagerness to dive into Grafana dashboards and explore their potential.
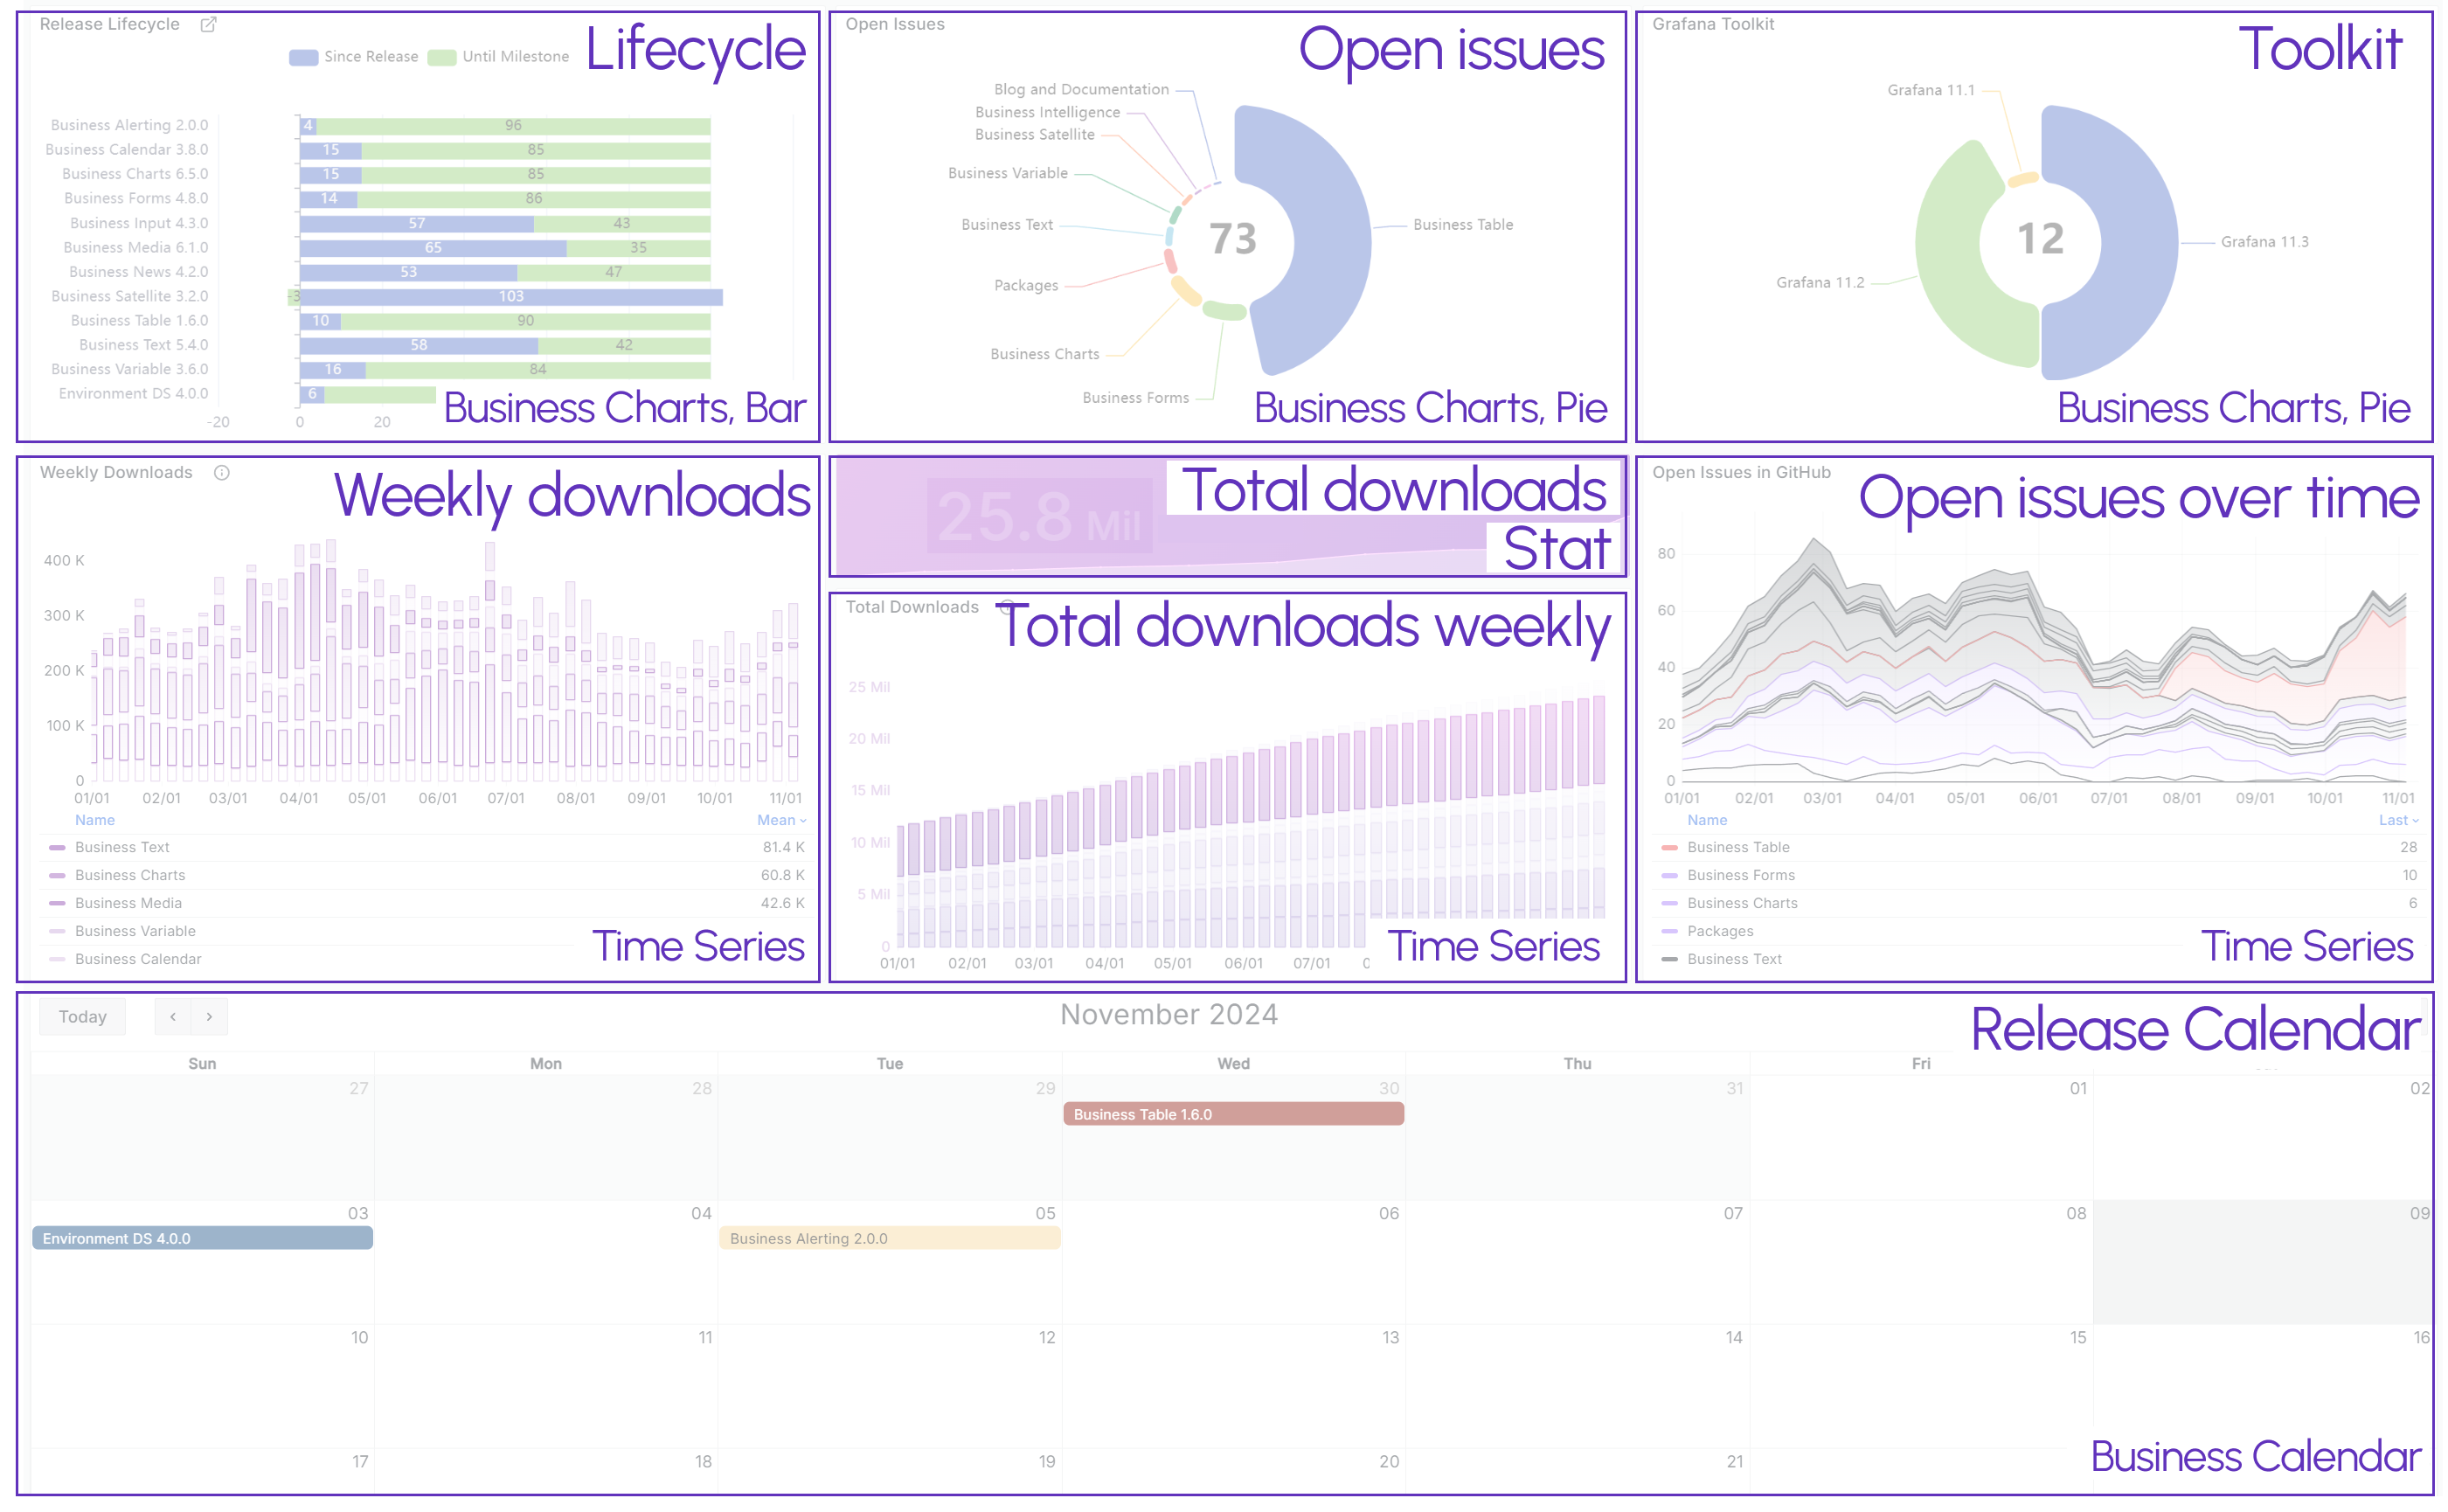
To address this demand, we’ve created a detailed tutorial on configuring our Release Dashboard, a tool we use daily to track Business Suite plugin development. This dashboard showcases Grafana's versatility and simplicity.
Why This Tutorial Matters
- Core Visualizations: Features Grafana's Time Series panel in various configurations.
- Custom Plugins: Includes examples of Business Charts and Business Calendar for unique data views.
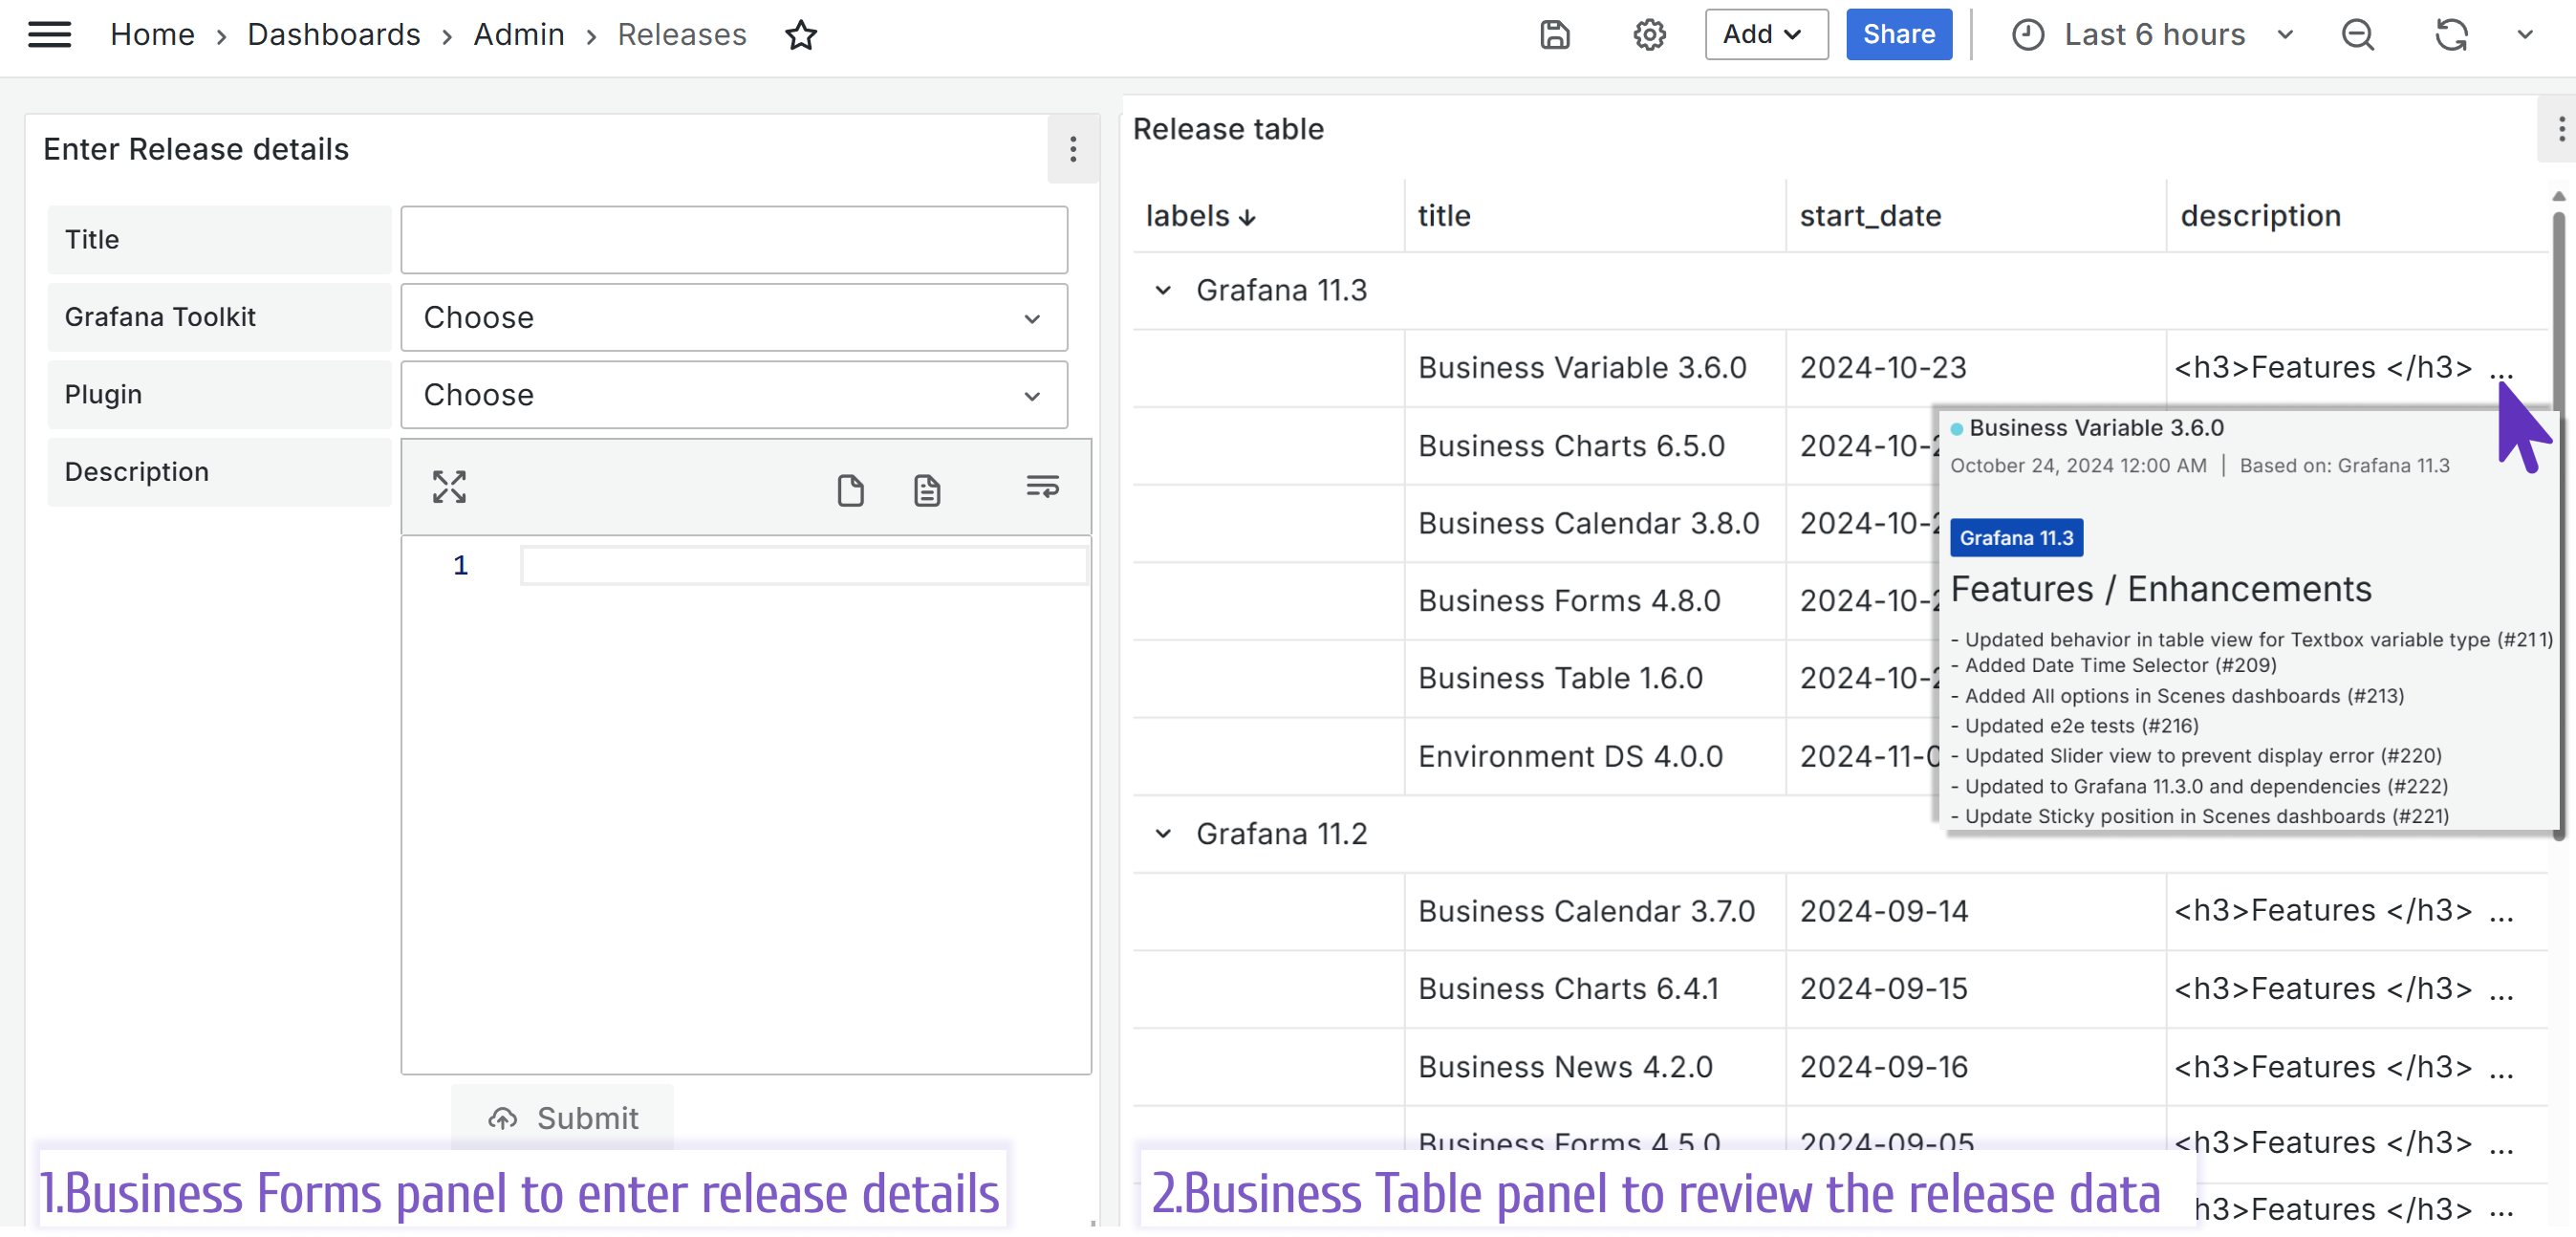
- User Input: Demonstrates the Business Forms panel for entering release details directly into a Timescale data source.
Explore the Resources
- Live Dashboard: Check out the Release Dashboard in action.
- Blog Post: Dive into our detailed guide covering configuration, database structure, and panel setup.

Create a Business Dashboard in Grafana for release management - Video Tutorial: Watch our in-depth video for additional insights on data sources, transformations, and more.
How to Create a Business Dashboard in Grafana | Plugin Release Dashboard
28 Million Downloads Milestone
We’re ecstatic to share that the total downloads for our Business Suite plugins are approaching 30 million! As of November 2024, we've hit 28 million, and we’re hopeful to reach the next milestone before the year ends.

Plugin Release News
All updated plugins are fully compatible with Grafana 11.3 scenes-powered dashboards.
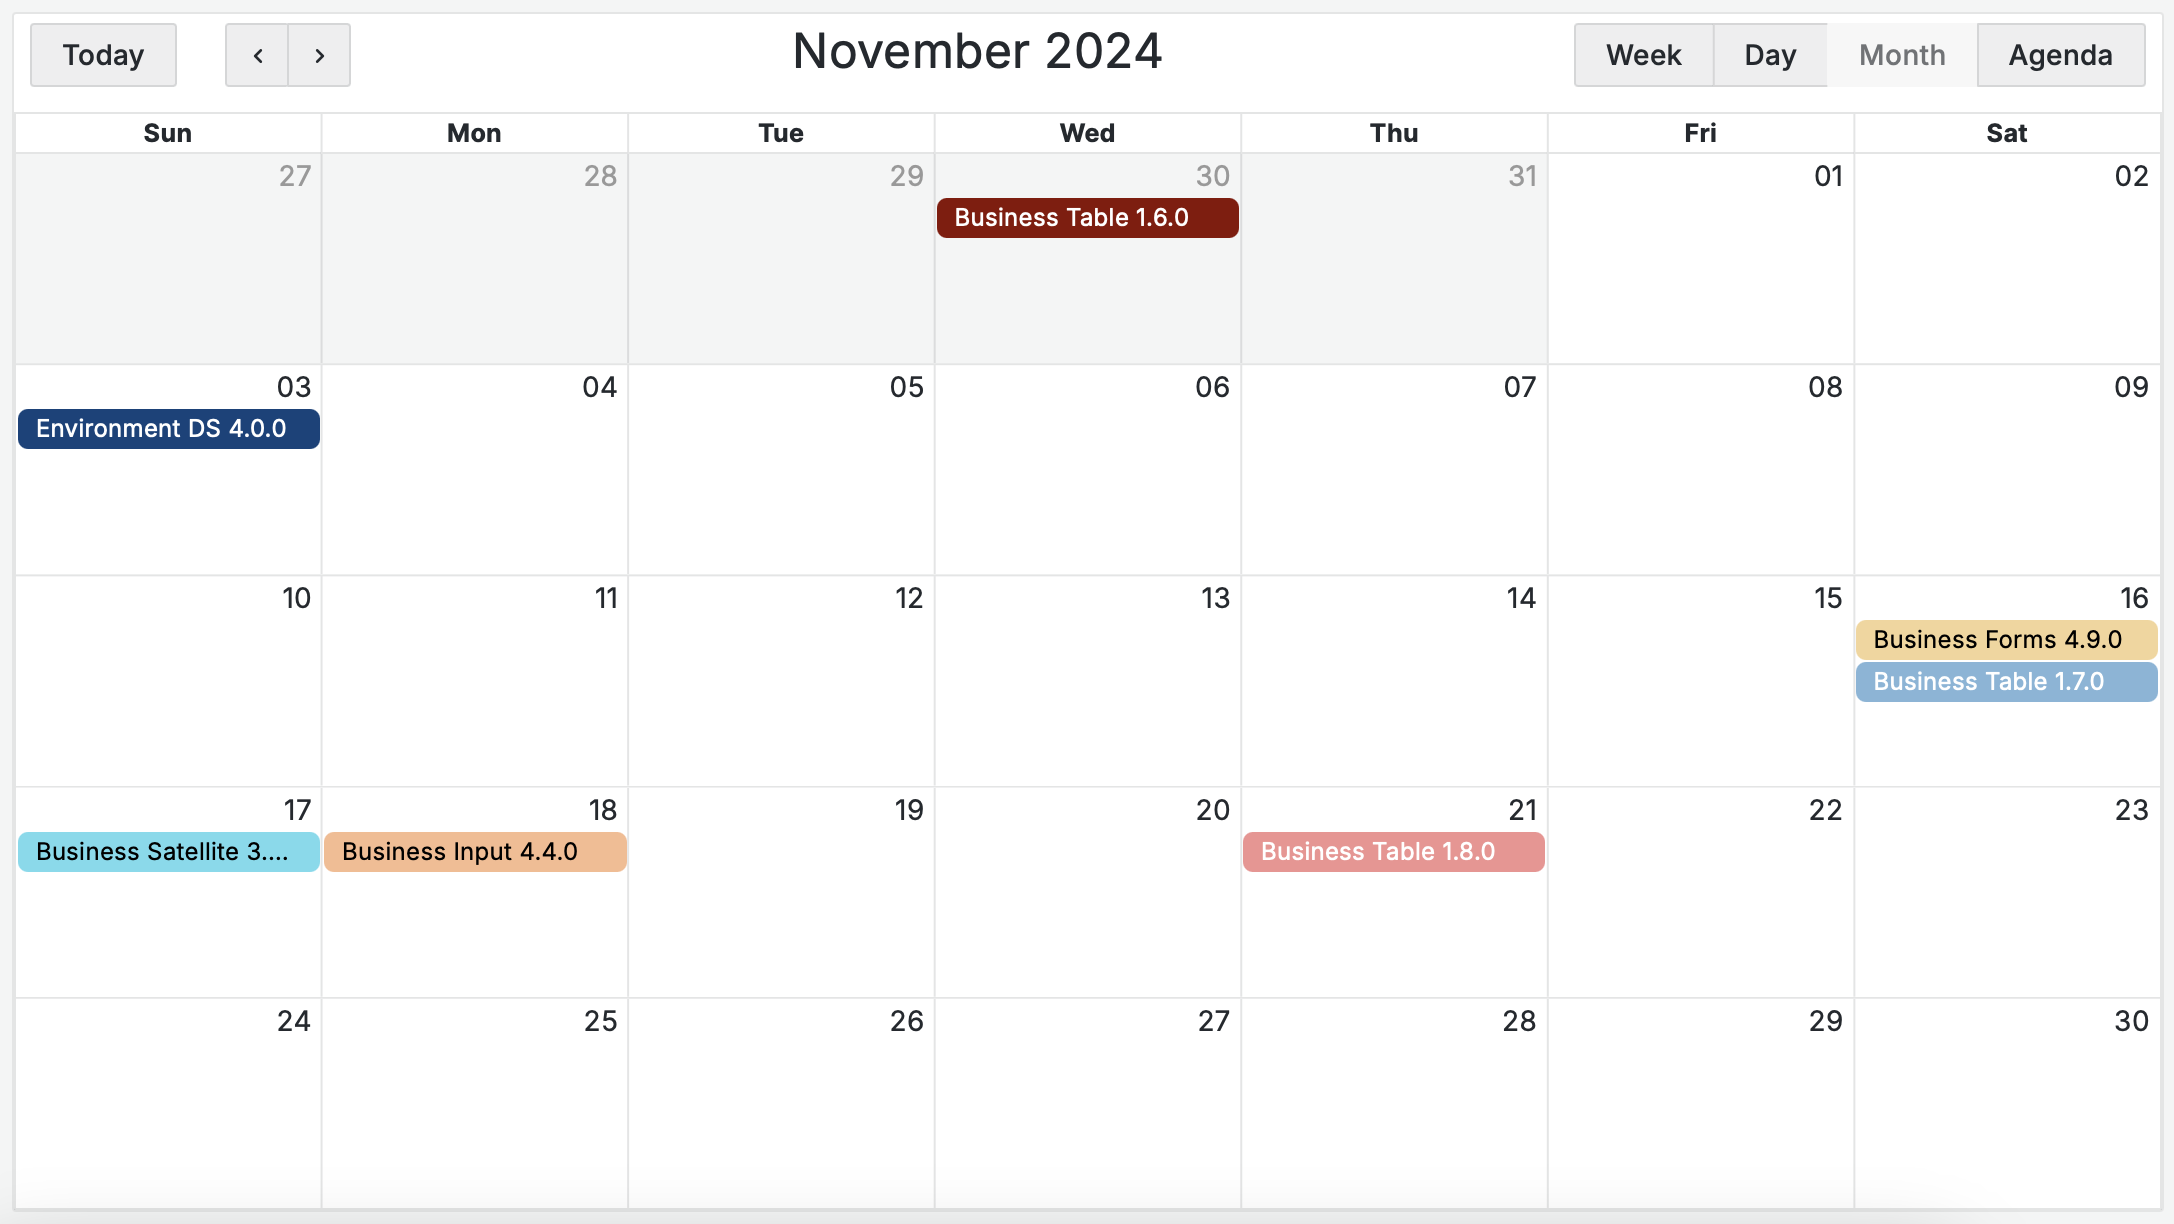
November 2024 saw six plugin releases, with a special focus on the rapidly growing Business Table panel. Here's a summary of the updates:
Business Table 1.9.0
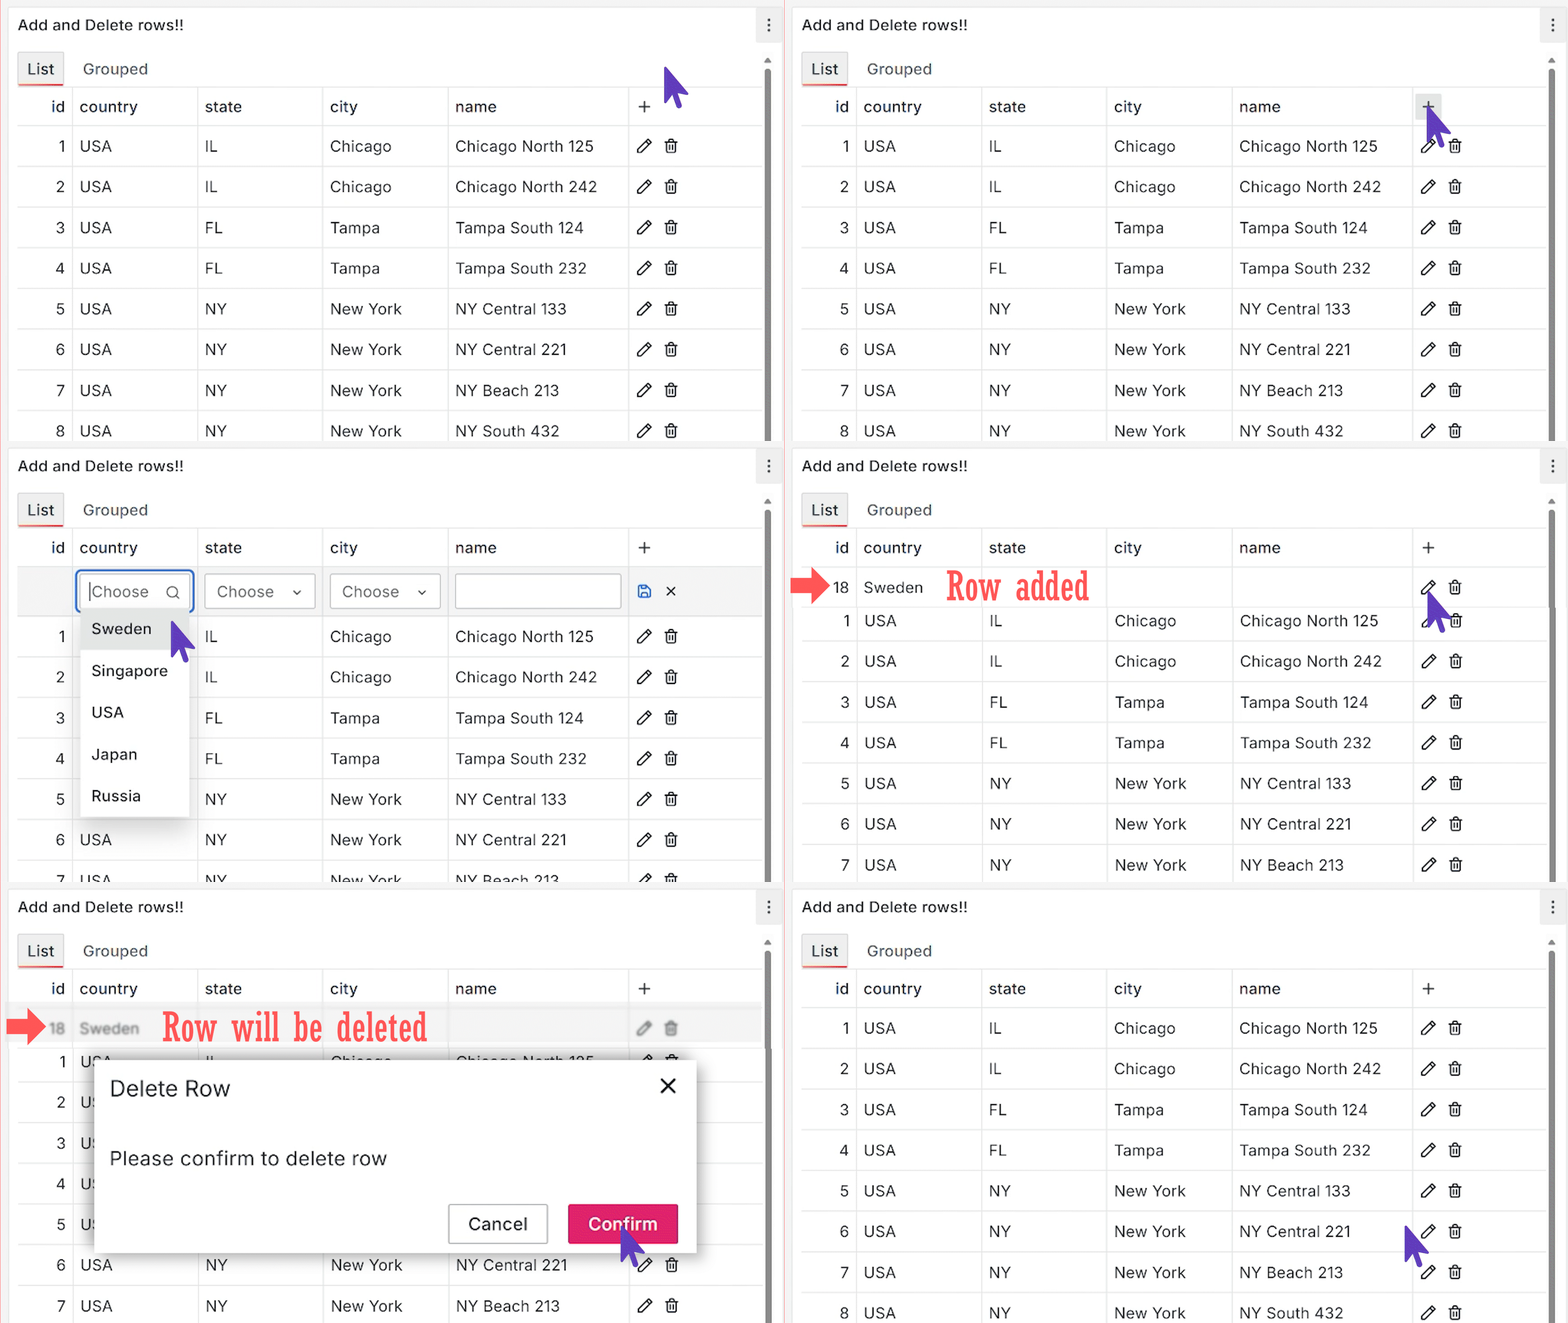
Added the highly requested add/delete row feature, new display column types, and editable types. This makes it the second plugin after Business Forms to support data transmission back to the source.

Business Charts 6.5.0
The Visual Editor now supports scatter and boxplot chart types.

Business Calendar 3.8.0
Enhanced Year Layout and added panel-specific language/datetime formats for multi-language dashboards.

Business Forms 4.9.0
Introduced dynamic section generation alongside existing dynamic visual elements.

Documentation Revamp
Keeping documentation current with rapidly evolving plugin features is a challenge. In November, we overhauled the documentation for the Business Table panel to make configuration steps clearer.
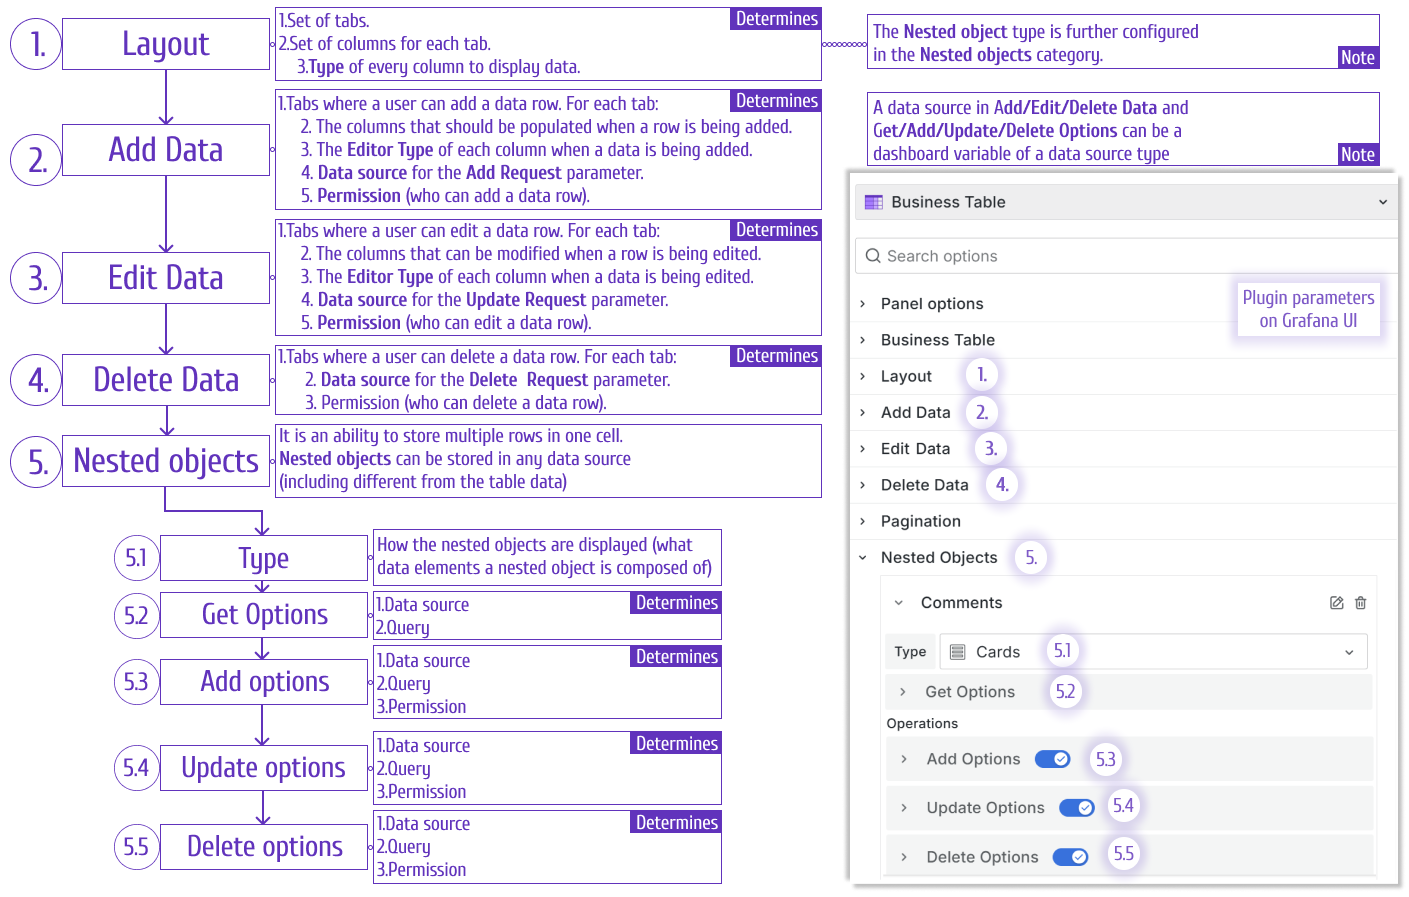
What do you think of the updated schema? Does it simplify the configuration process? Let us know!
Always happy to hear from you
Subscribe to our YouTube Channel and leave your comments.
Enroll in Business Suite Enterprise


