Create a Business Dashboard in Grafana for release management
We firmly believe that Grafana is not just about observability; Grafana can help build fully functional, user-ready web applications with the right tools, like the Business Suite plugins.
This article aims to be one example. Release dashboard is an internal Volkov Labs project available for the public to view. We use it daily to monitor our plugin release schedule and community interest by using various metrics such as number of downloads, open issues, etc.
Below is the screenshot of the main dashboard with noted visualization panels.
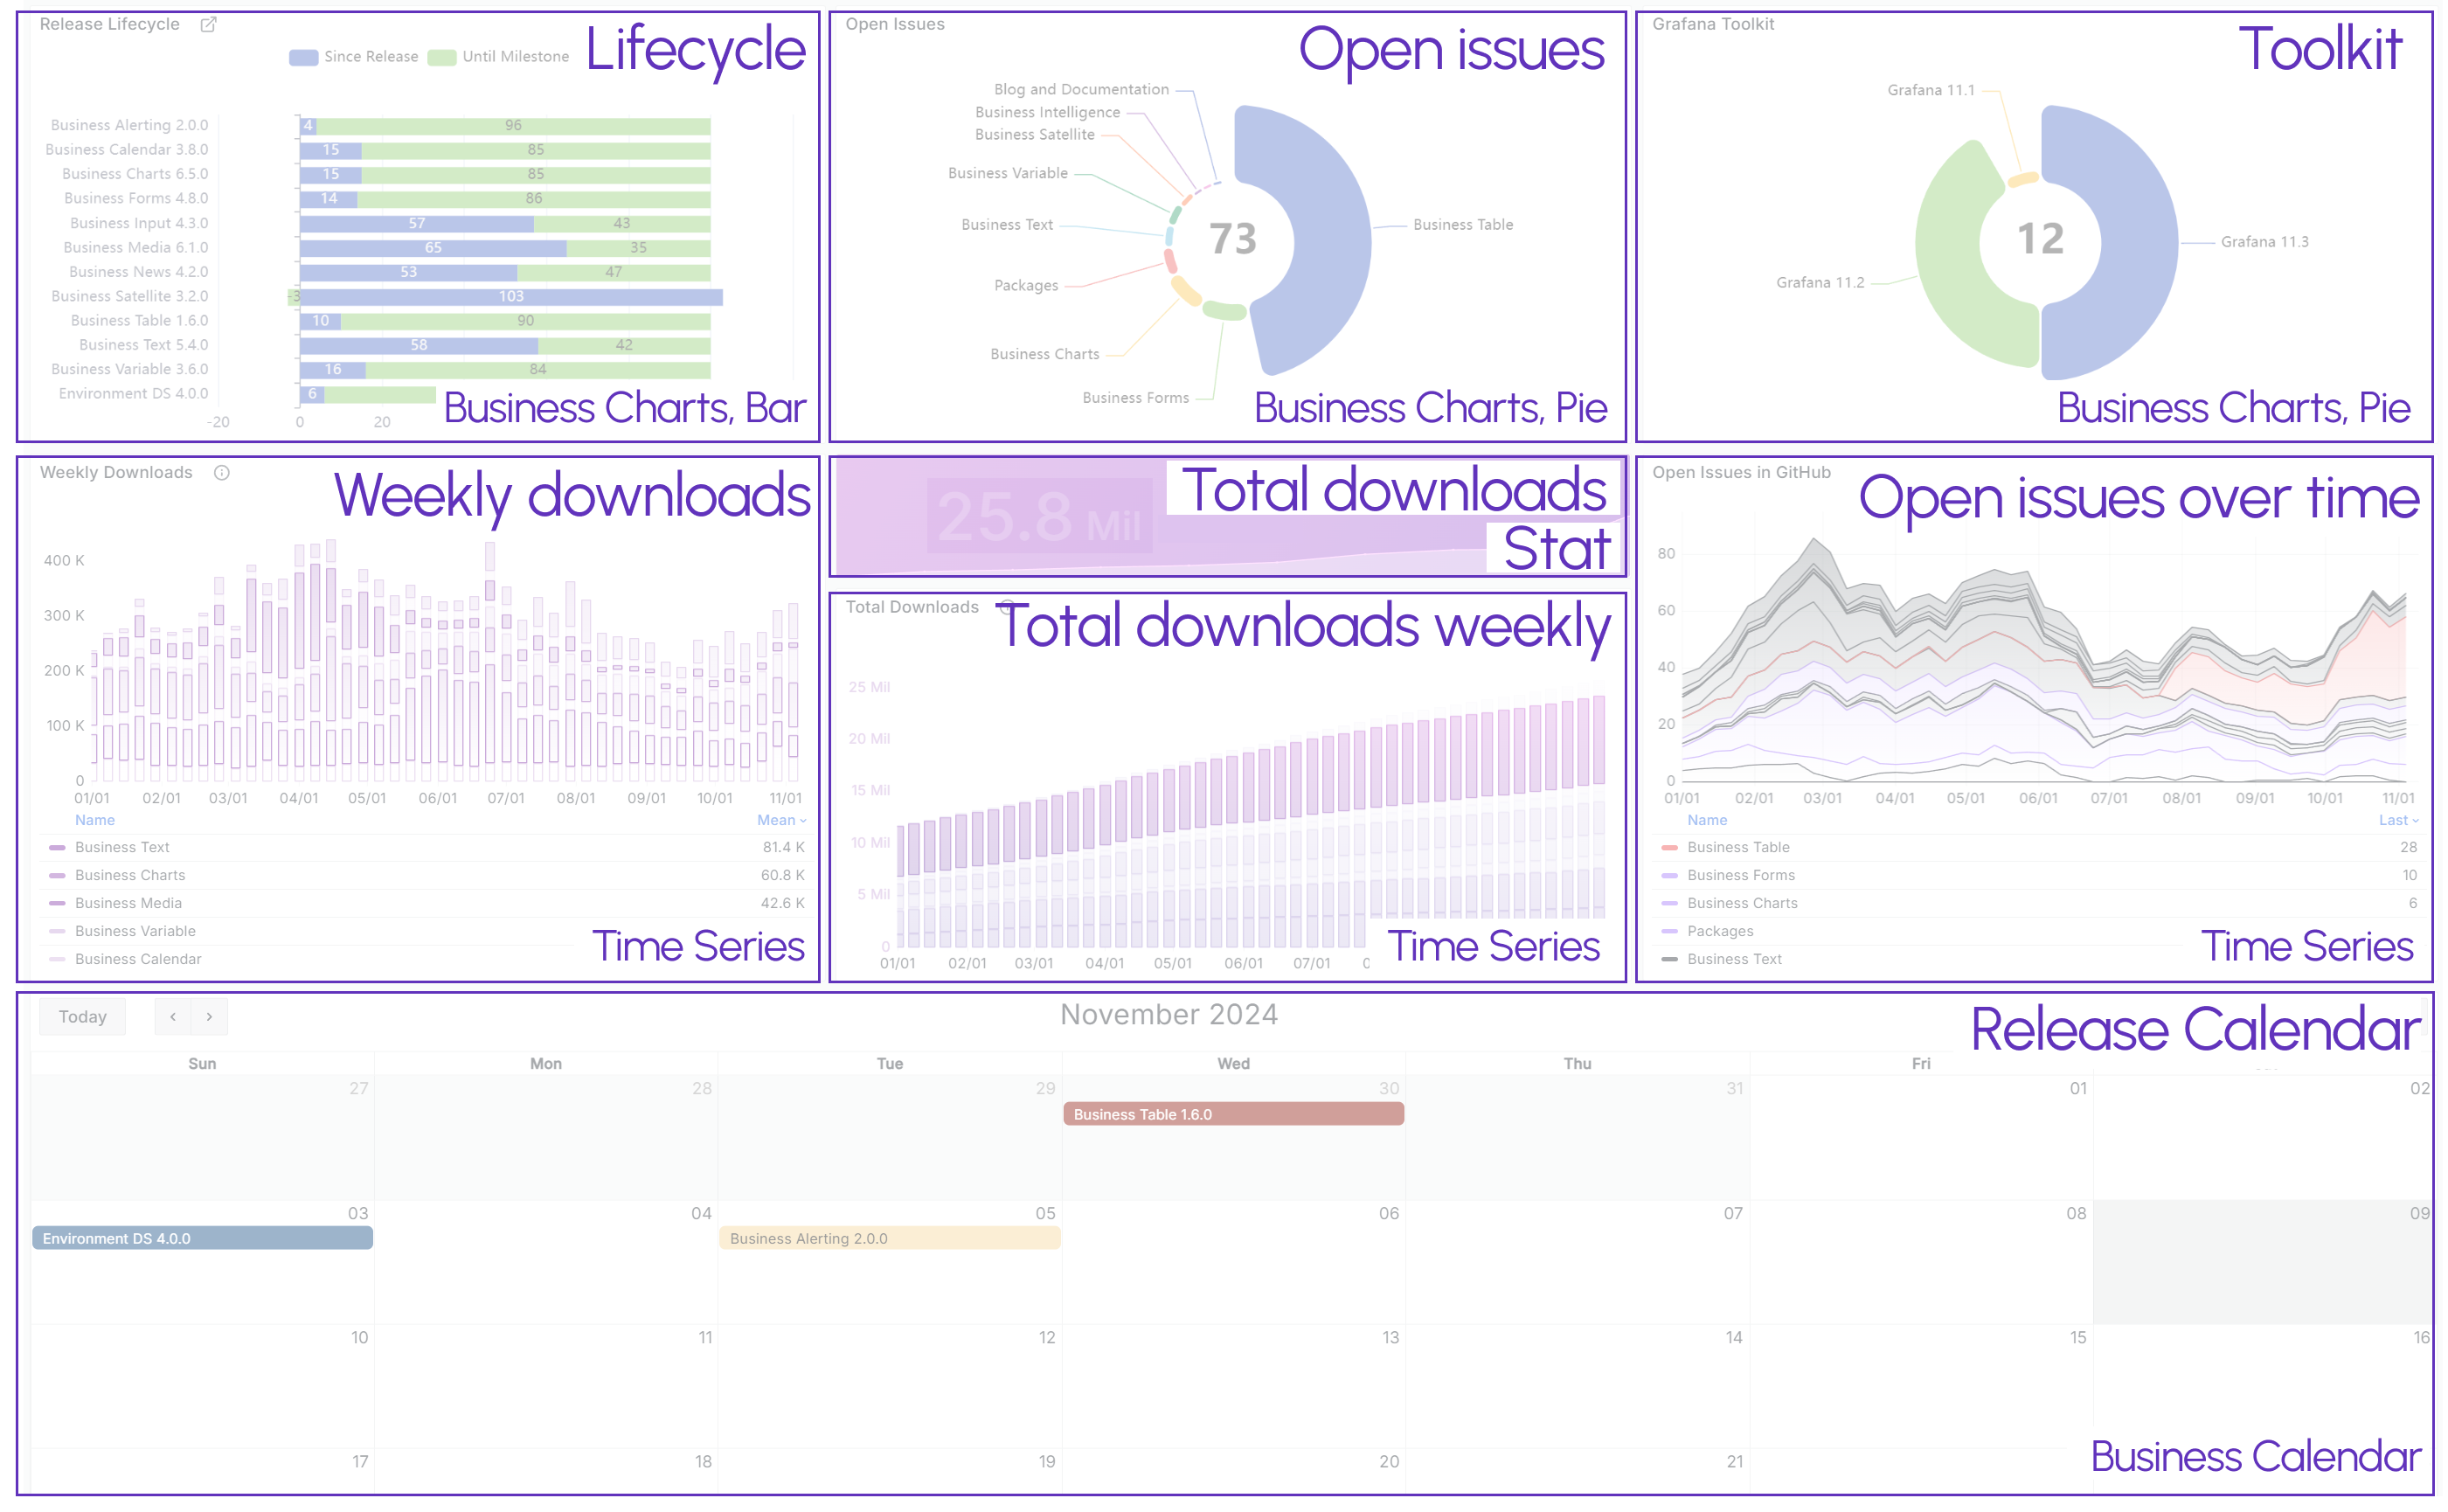
You can jump into the specific panel configuration using the listing below:
- Lifecycle panel
- Open issues panel
- Toolkit panel
- Weekly downloads panel
- Total downloads panel
- Total downloads weekly panel
- Open issues over time panel
- Release Calendar panel
- Release Entry form panel
Data Flow
Let's delve into the details of our data flow. This brief explanation will equip you with a deeper understanding of where our data comes from and how it's collected, making you more informed and knowledgeable about our processes.

The data that we use in our Release dashboard is collected from three different sources:
- From
grafana.comusing Grafana API and hourly CRON script. - From
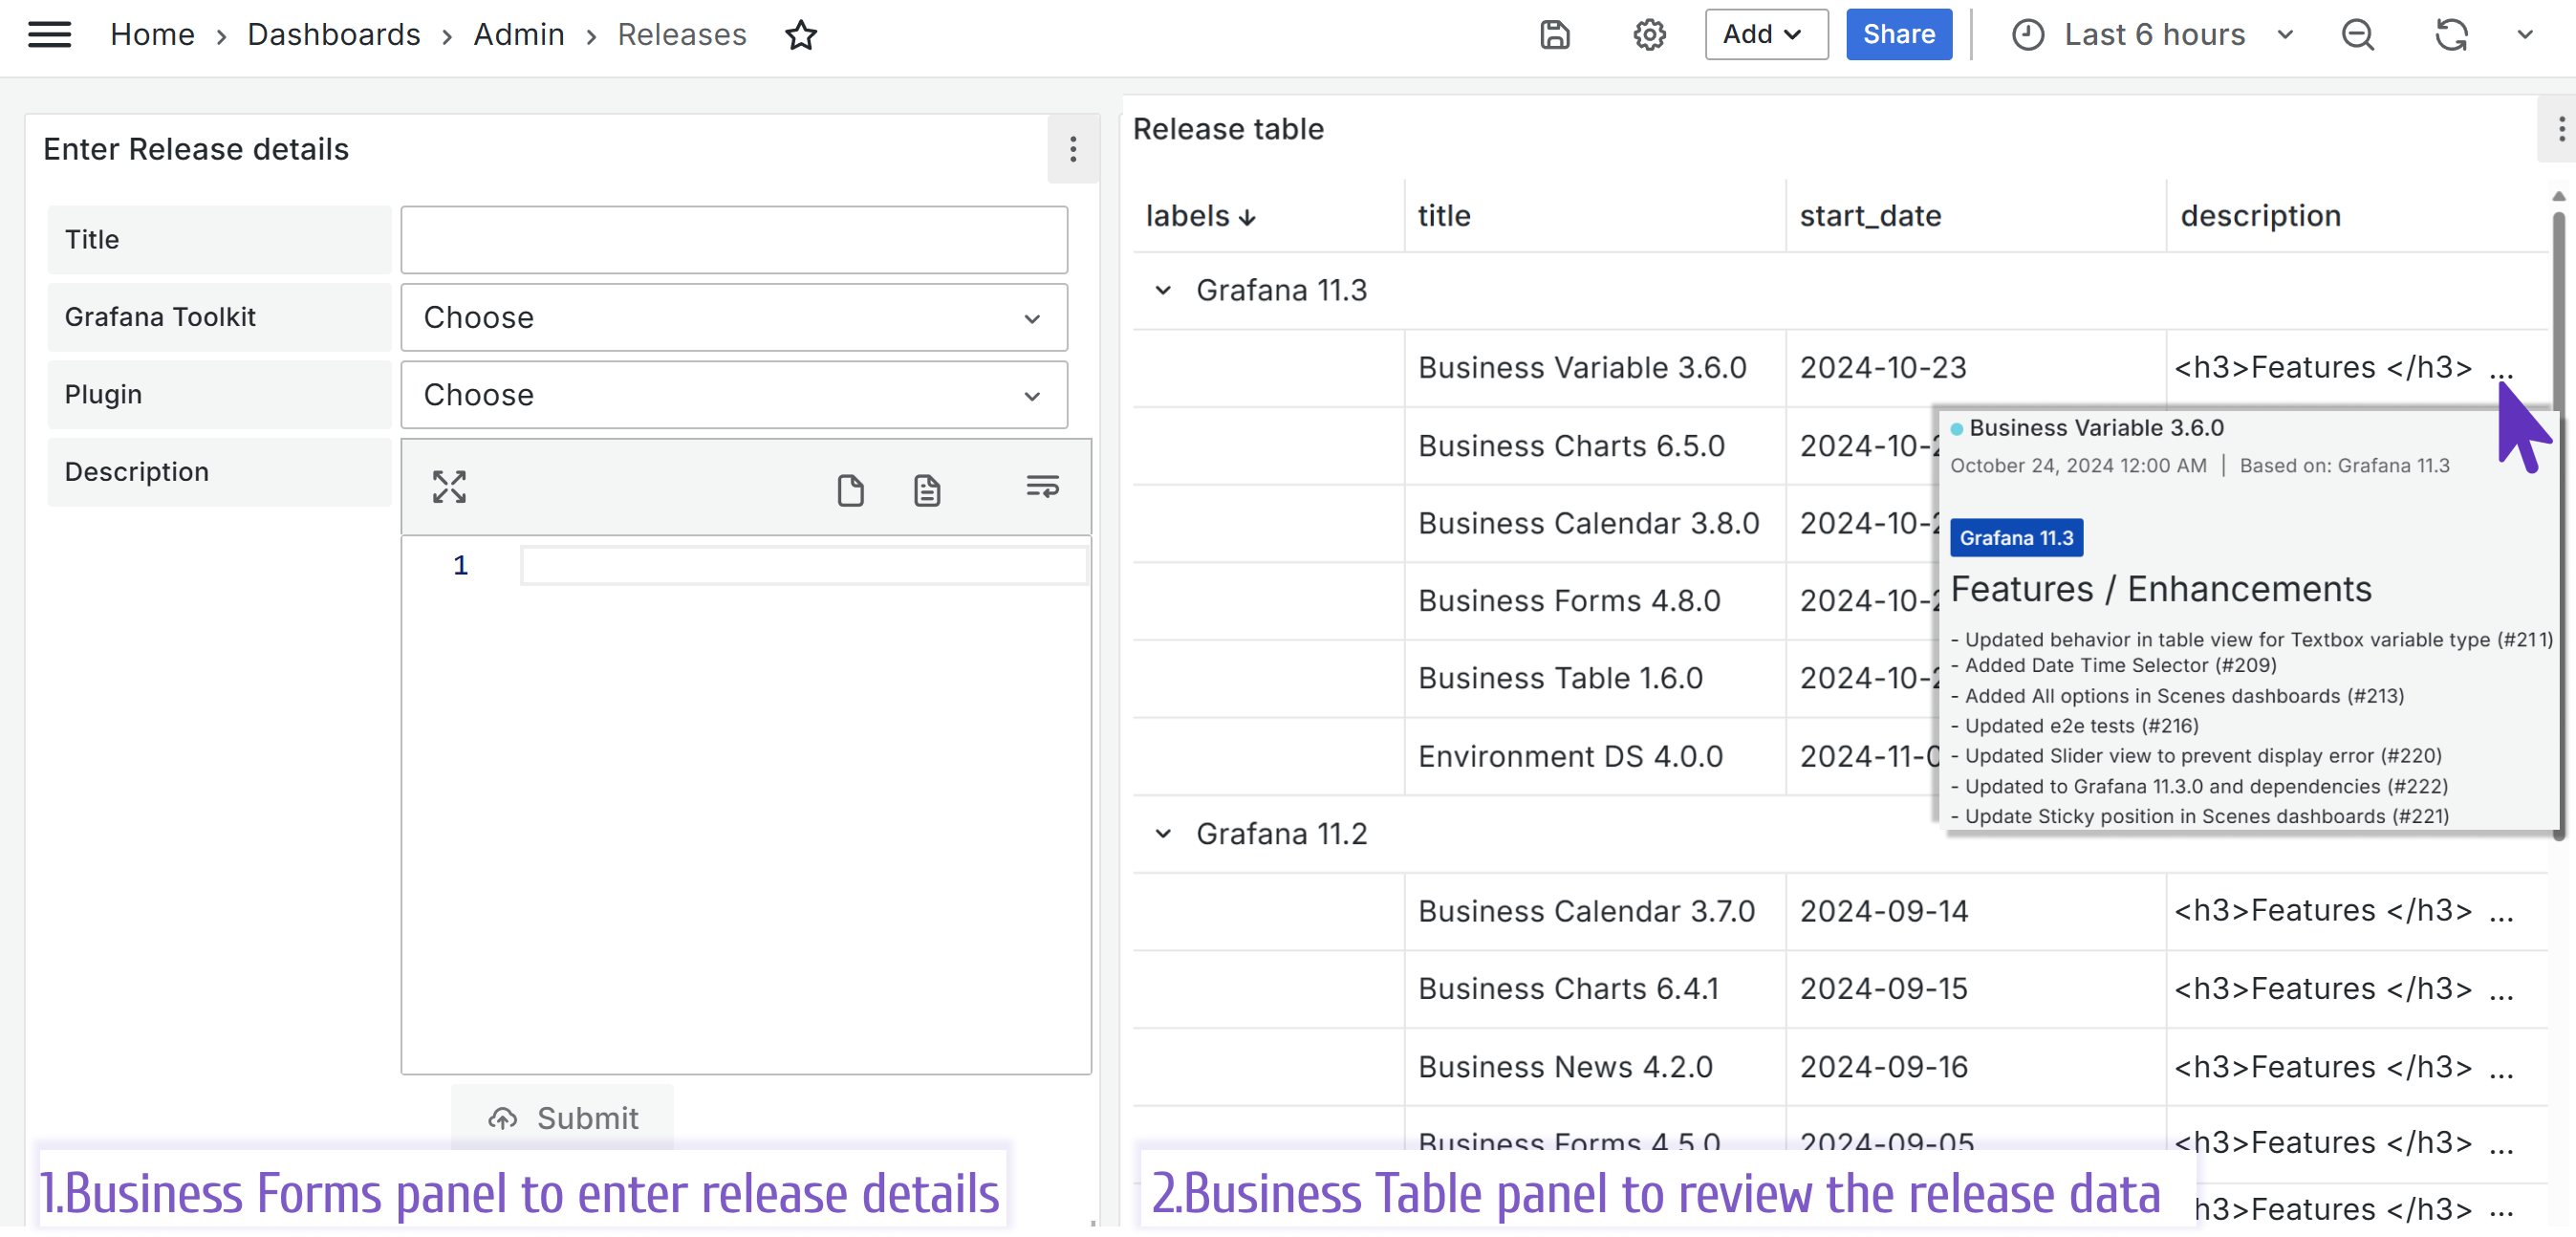
github.comusing GitHub API and hourly CRON script. - Release entry. When the release is published, release manager enters all required information via the Grafana dashboard using the Business Forms panel.
Timescale database
We use Timescale database to store all collected data. The primary reason for our choice in the Release project is Timescale's ability to combine table structured data with time-series format and allow querying both simultaneously.
For more reasons to choose Timescale, please review this blog post.
As you can see on the data flow schema above, we primarely use three tables: grafana, github, and releases.
Grafana plugins
Below is a part of the grafana table to illustrate the collected data about plugins and number of downloads from Grafana catalog.
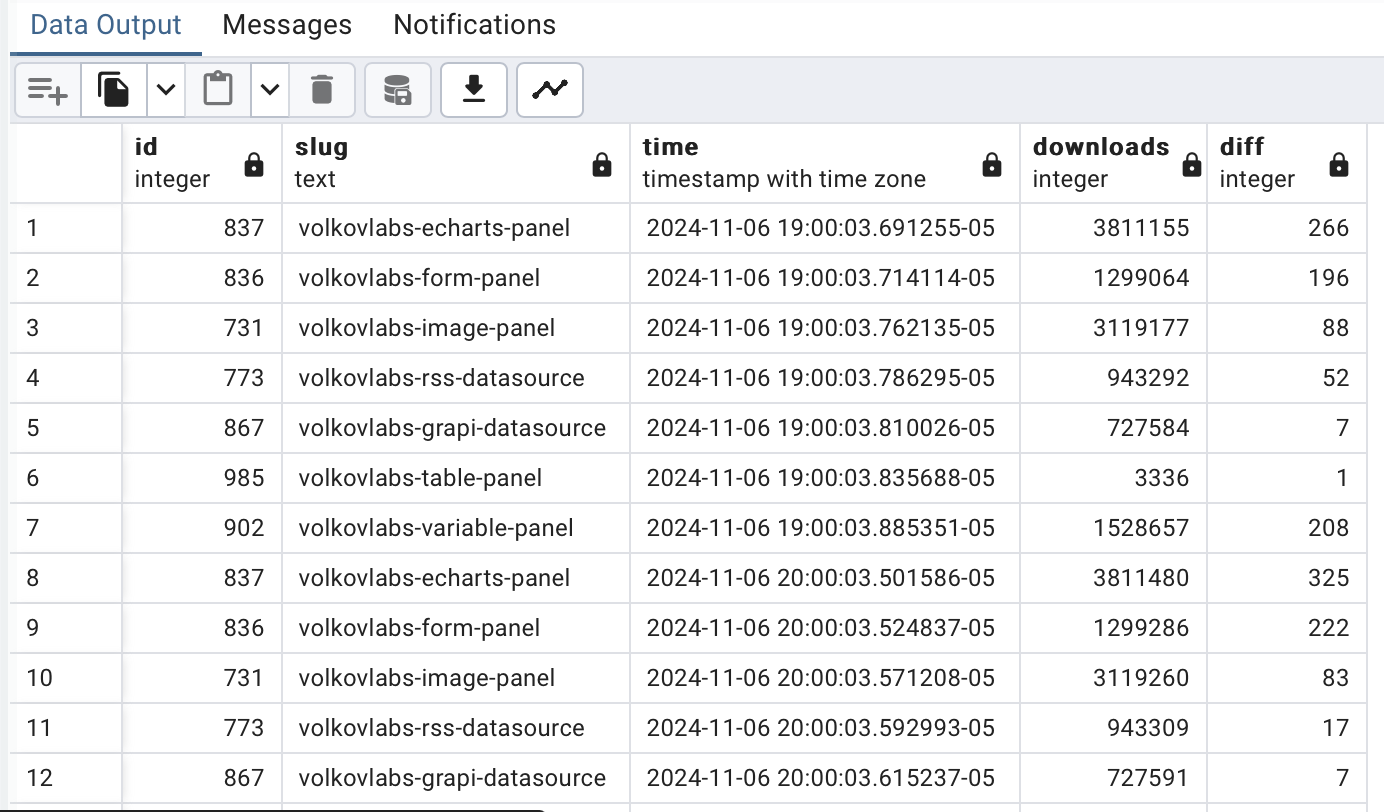
- id. A unique Grafana plugin identifier in the integer format.
- slug. A unique Grafana plugin identifier in the text format.
- time. The time when a data is collected.
- downloads. Number of downloads.
- diff. The number of downloads increase since the last time the data was collected.
GitHub issues
Below is a part of the github table to illustrate the collected data about issue, stars, and forks from our GitHub organization.
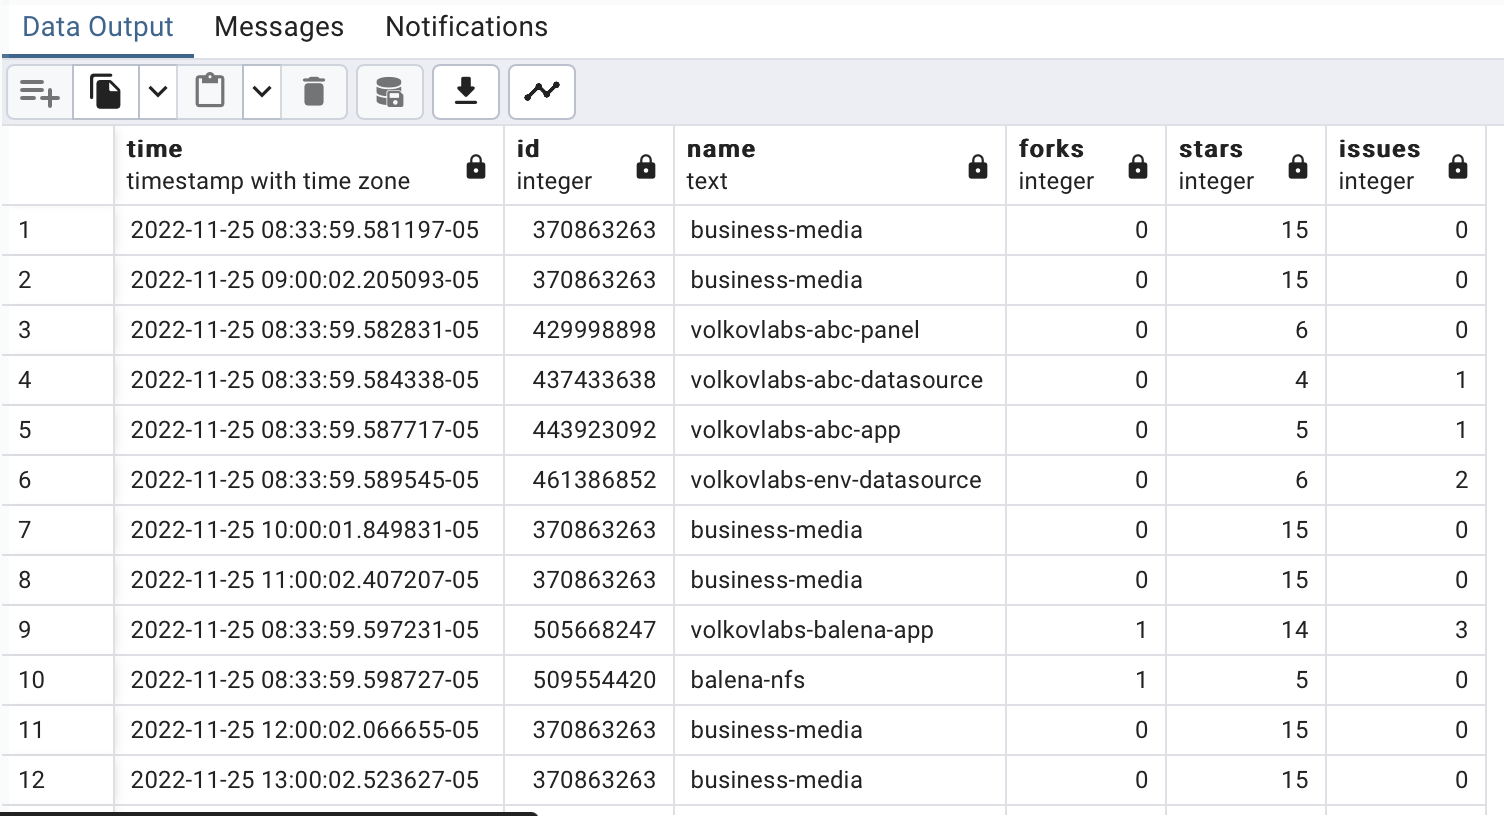
- time. The time when a GitHub project data is collected.
- id. A unique GitHub project identifier in the integer format.
- name. A unique GitHub project identifier in the text format.
- forks. A number of project's forks.
- stars. A number of project's stars.
- issues. A number of project's open issues.
Business Suite releases
Below is a part of the releases table to illustrate the collected data about Business Suite releases.
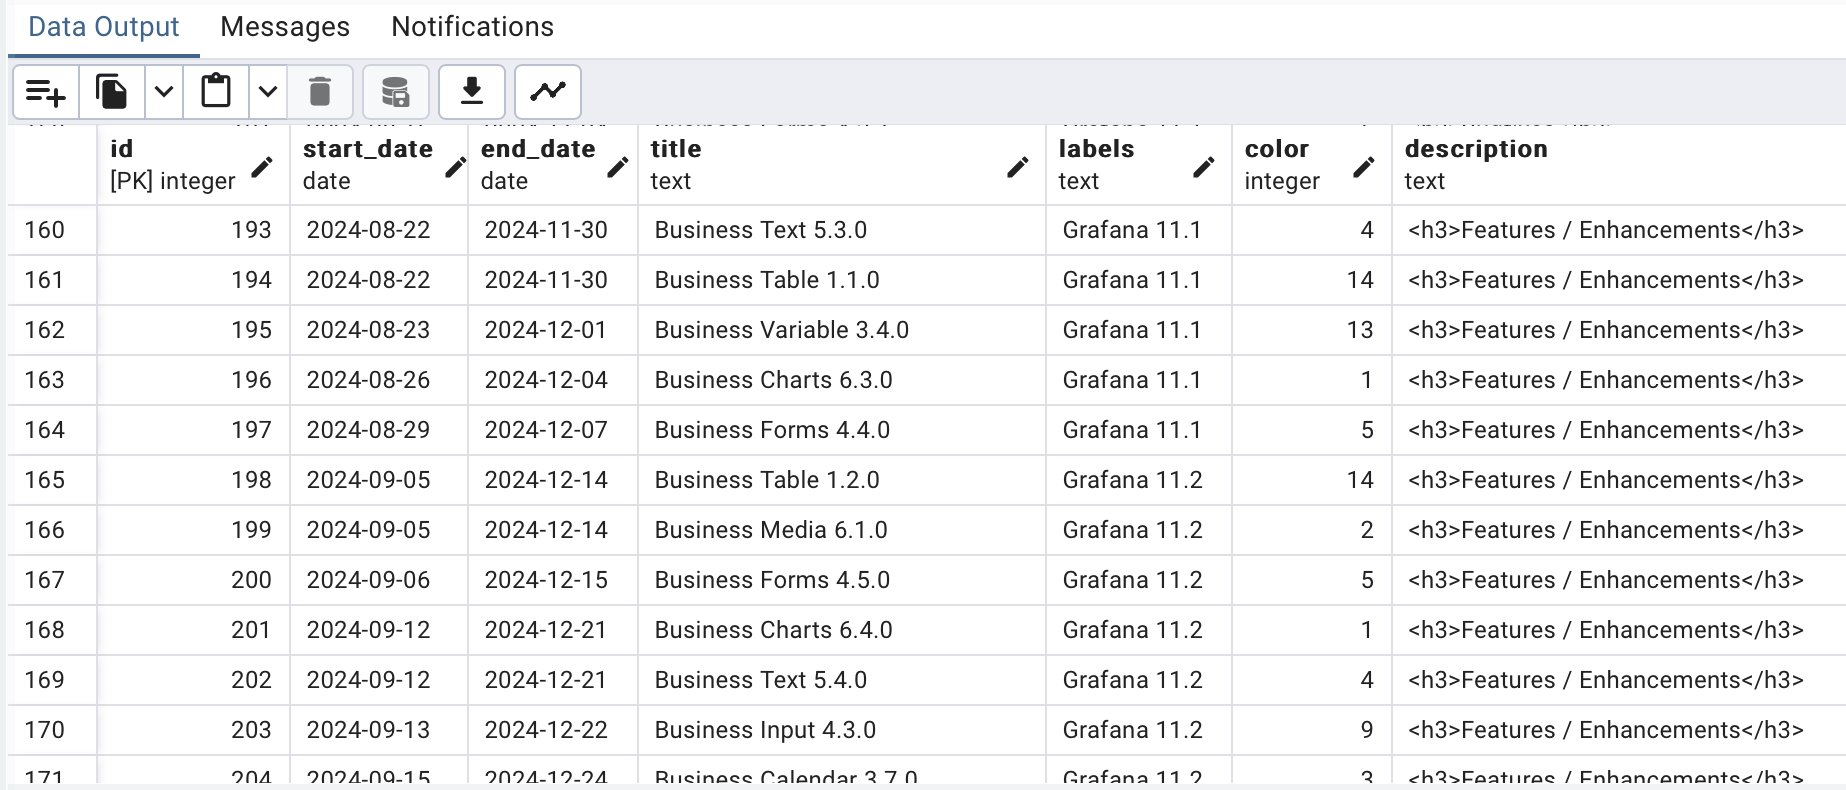
- id. A unique row identifier.
- start_date. The data when a release is first available.
- end_date. The start_date + 100 days.
- title. The plugin name + version.
- labels. The Grafana version compatible with the release.
- color. A unique plugin identifier.
- description. The most significant release features are in HTML format.
Any panel configuration
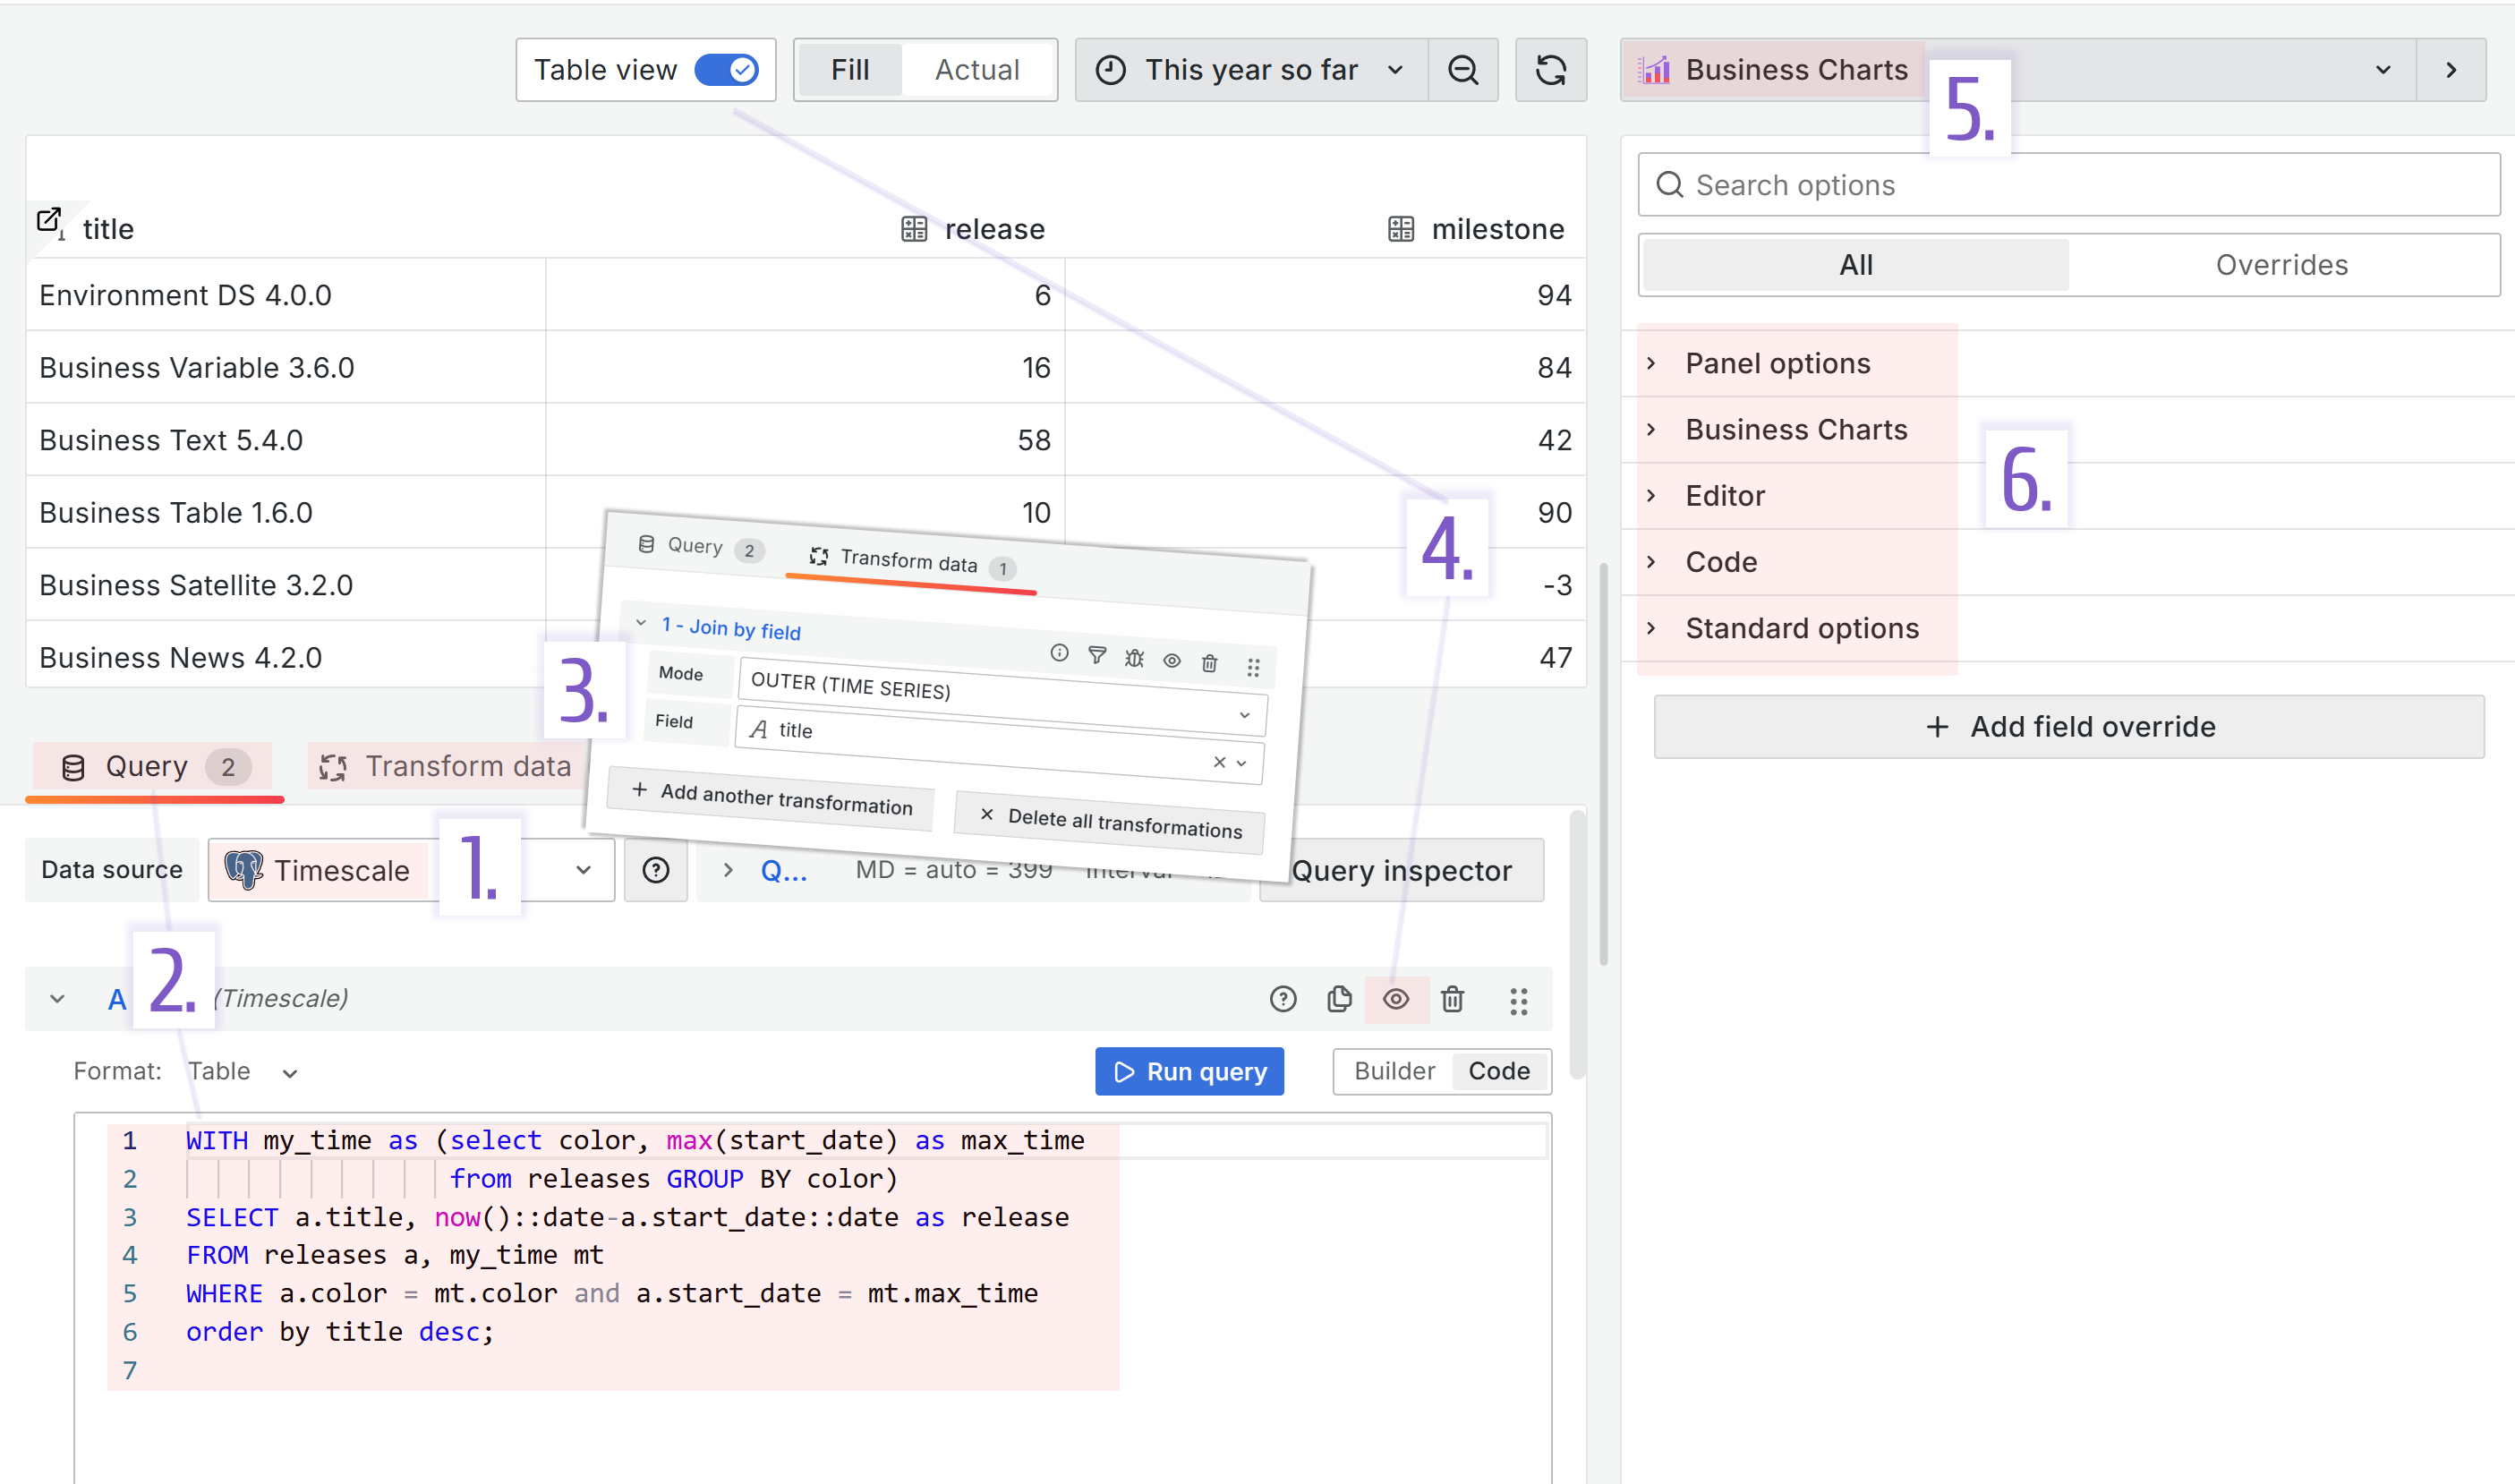
Any Grafana dashboard consists of various visualization panels. Though the variety of panel types is staggering, the configuration of any kind can be summarized in the following steps.
| Step | Notes |
|---|---|
| 1. Data source selection | One or multiple data sources per one panel. You can reference the other panel on the same dashboard as a data source to avoid unnecessary duplicative query runs and, therefore, improve performance |
| 2. Specify query | One or multiple queries per one panel. You can use the query Builder or Code mode to specify a query |
| 3. Apply transformations | One or multiple transformations per panel |
| 4. Data review | Use the Table View control at the top to switch between the data view and the panel view. You can enable a transformation using an eye icon to change from the original data frame to transformed and back. It is an optional step used for troubleshooting |
| 5. Select a visualization panel from a list | Choose from the core visualization panels or pre-installed community panels |
| 6. Configure panel properties | Every panel has common and specific properties |
Grafana dashboard
Lifecycle panel
The panel shows our products: Business Intelligence and open-source Business Suite.
For each, you can see the number of days since the last release and how long is until the next planned release. We aim to have a new release every 100 days for each plugin and so far have been successful with that goal.
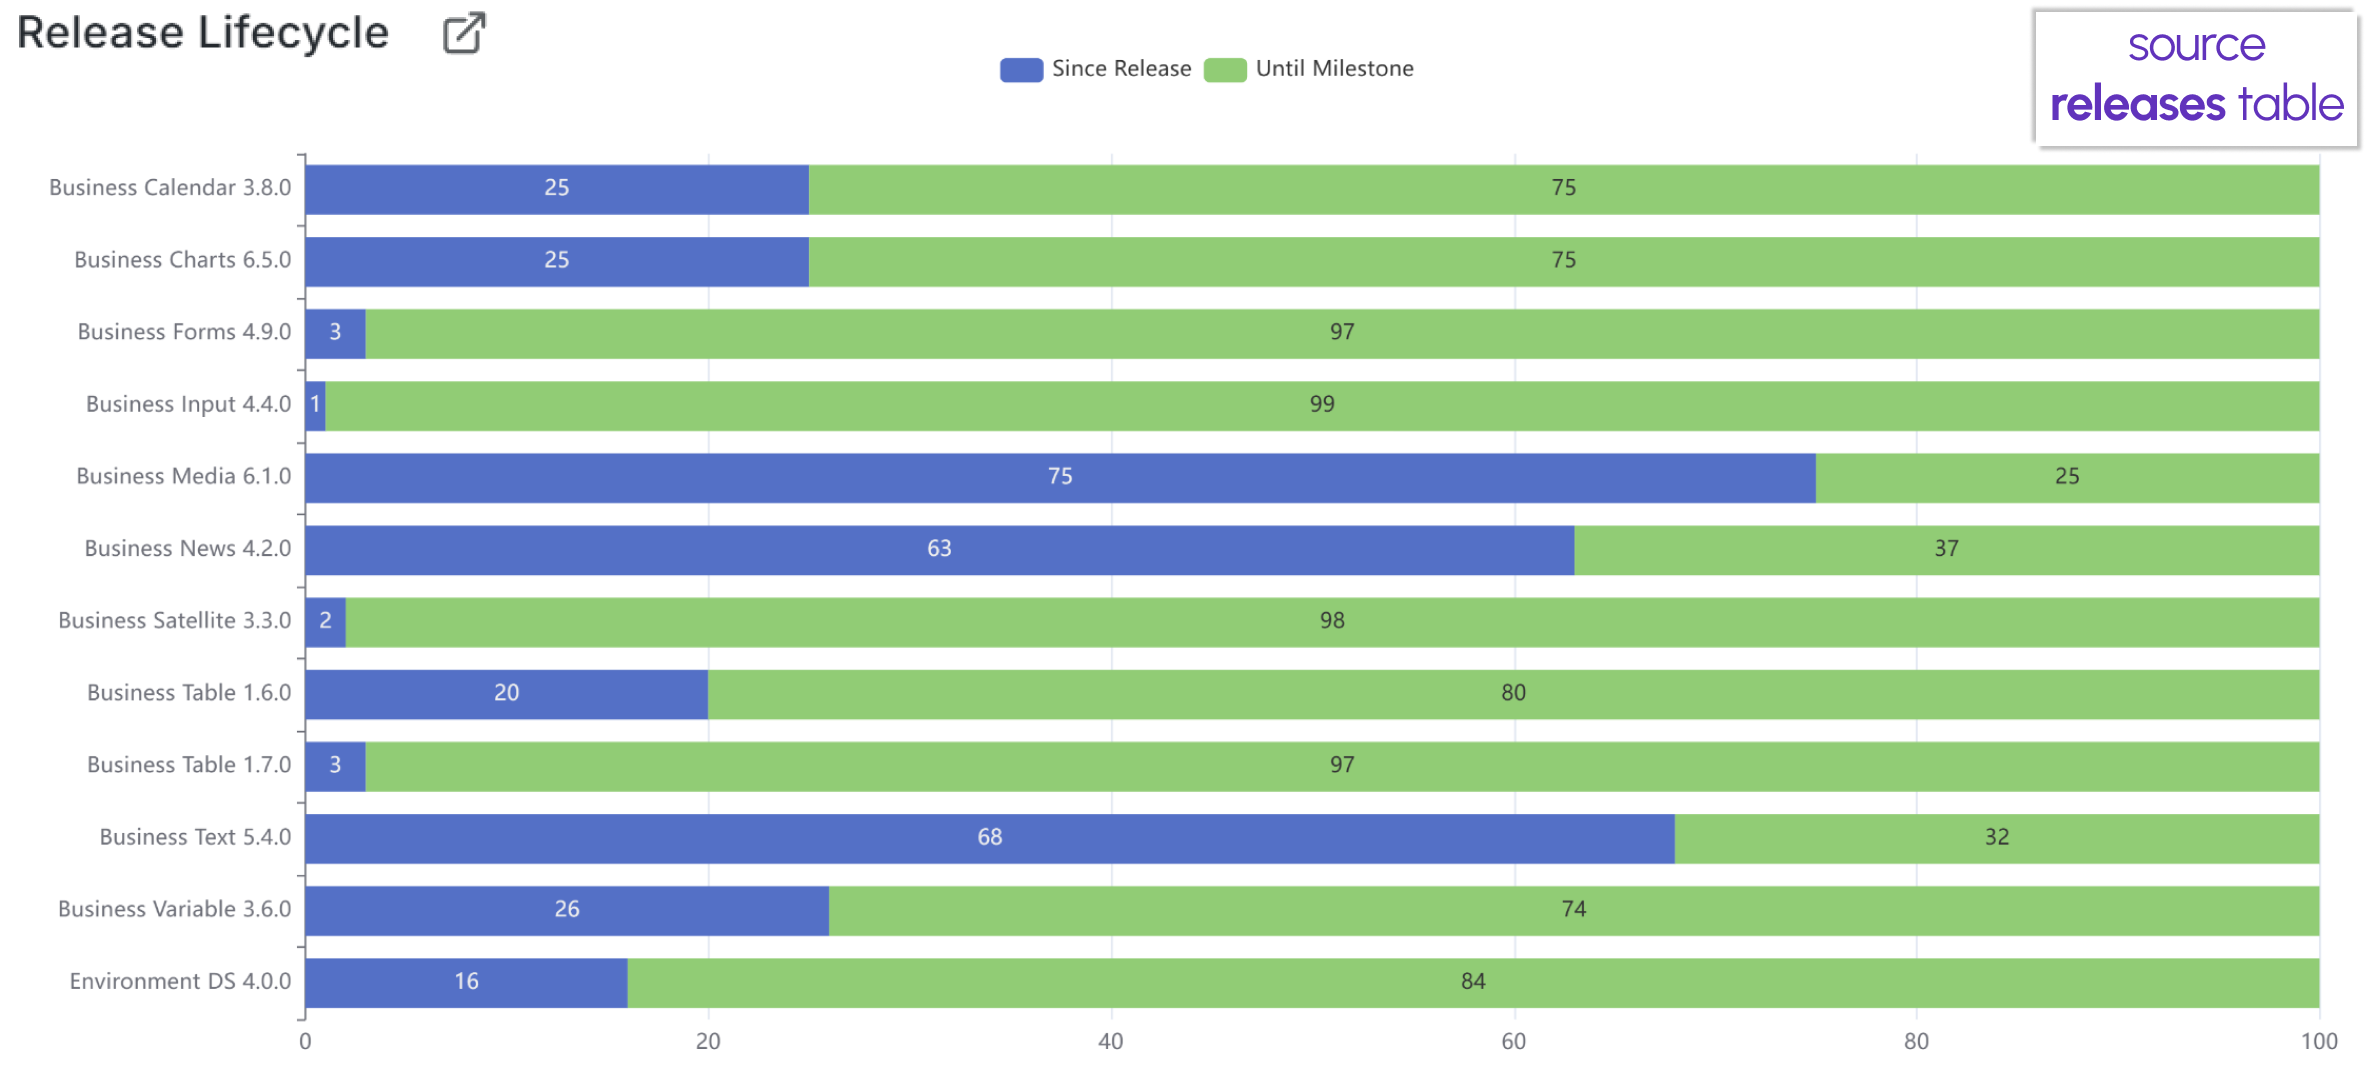
Below is the Lifecycle panel configuration.
| Step | Lifecycle panel configuration |
|---|---|
| 1. Data source selection | Timescale |
| 2. Specify query | The panel runs two SQL queries: Query A returns the product name(title) and the number of days since the last release has been published. Query B returns the product name(title) and the number of days until the next planned release. |
| 3. Apply transformations | We use the Join by field transformation to merge two data frames (results of the Query A and Query B) into one data frame |
| 4. Extracted data review | |
| 5. Select a visualization panel from a list | Business Charts panel |
| 6. Configure panel properties | We use the Code Editor mode. See the code below |
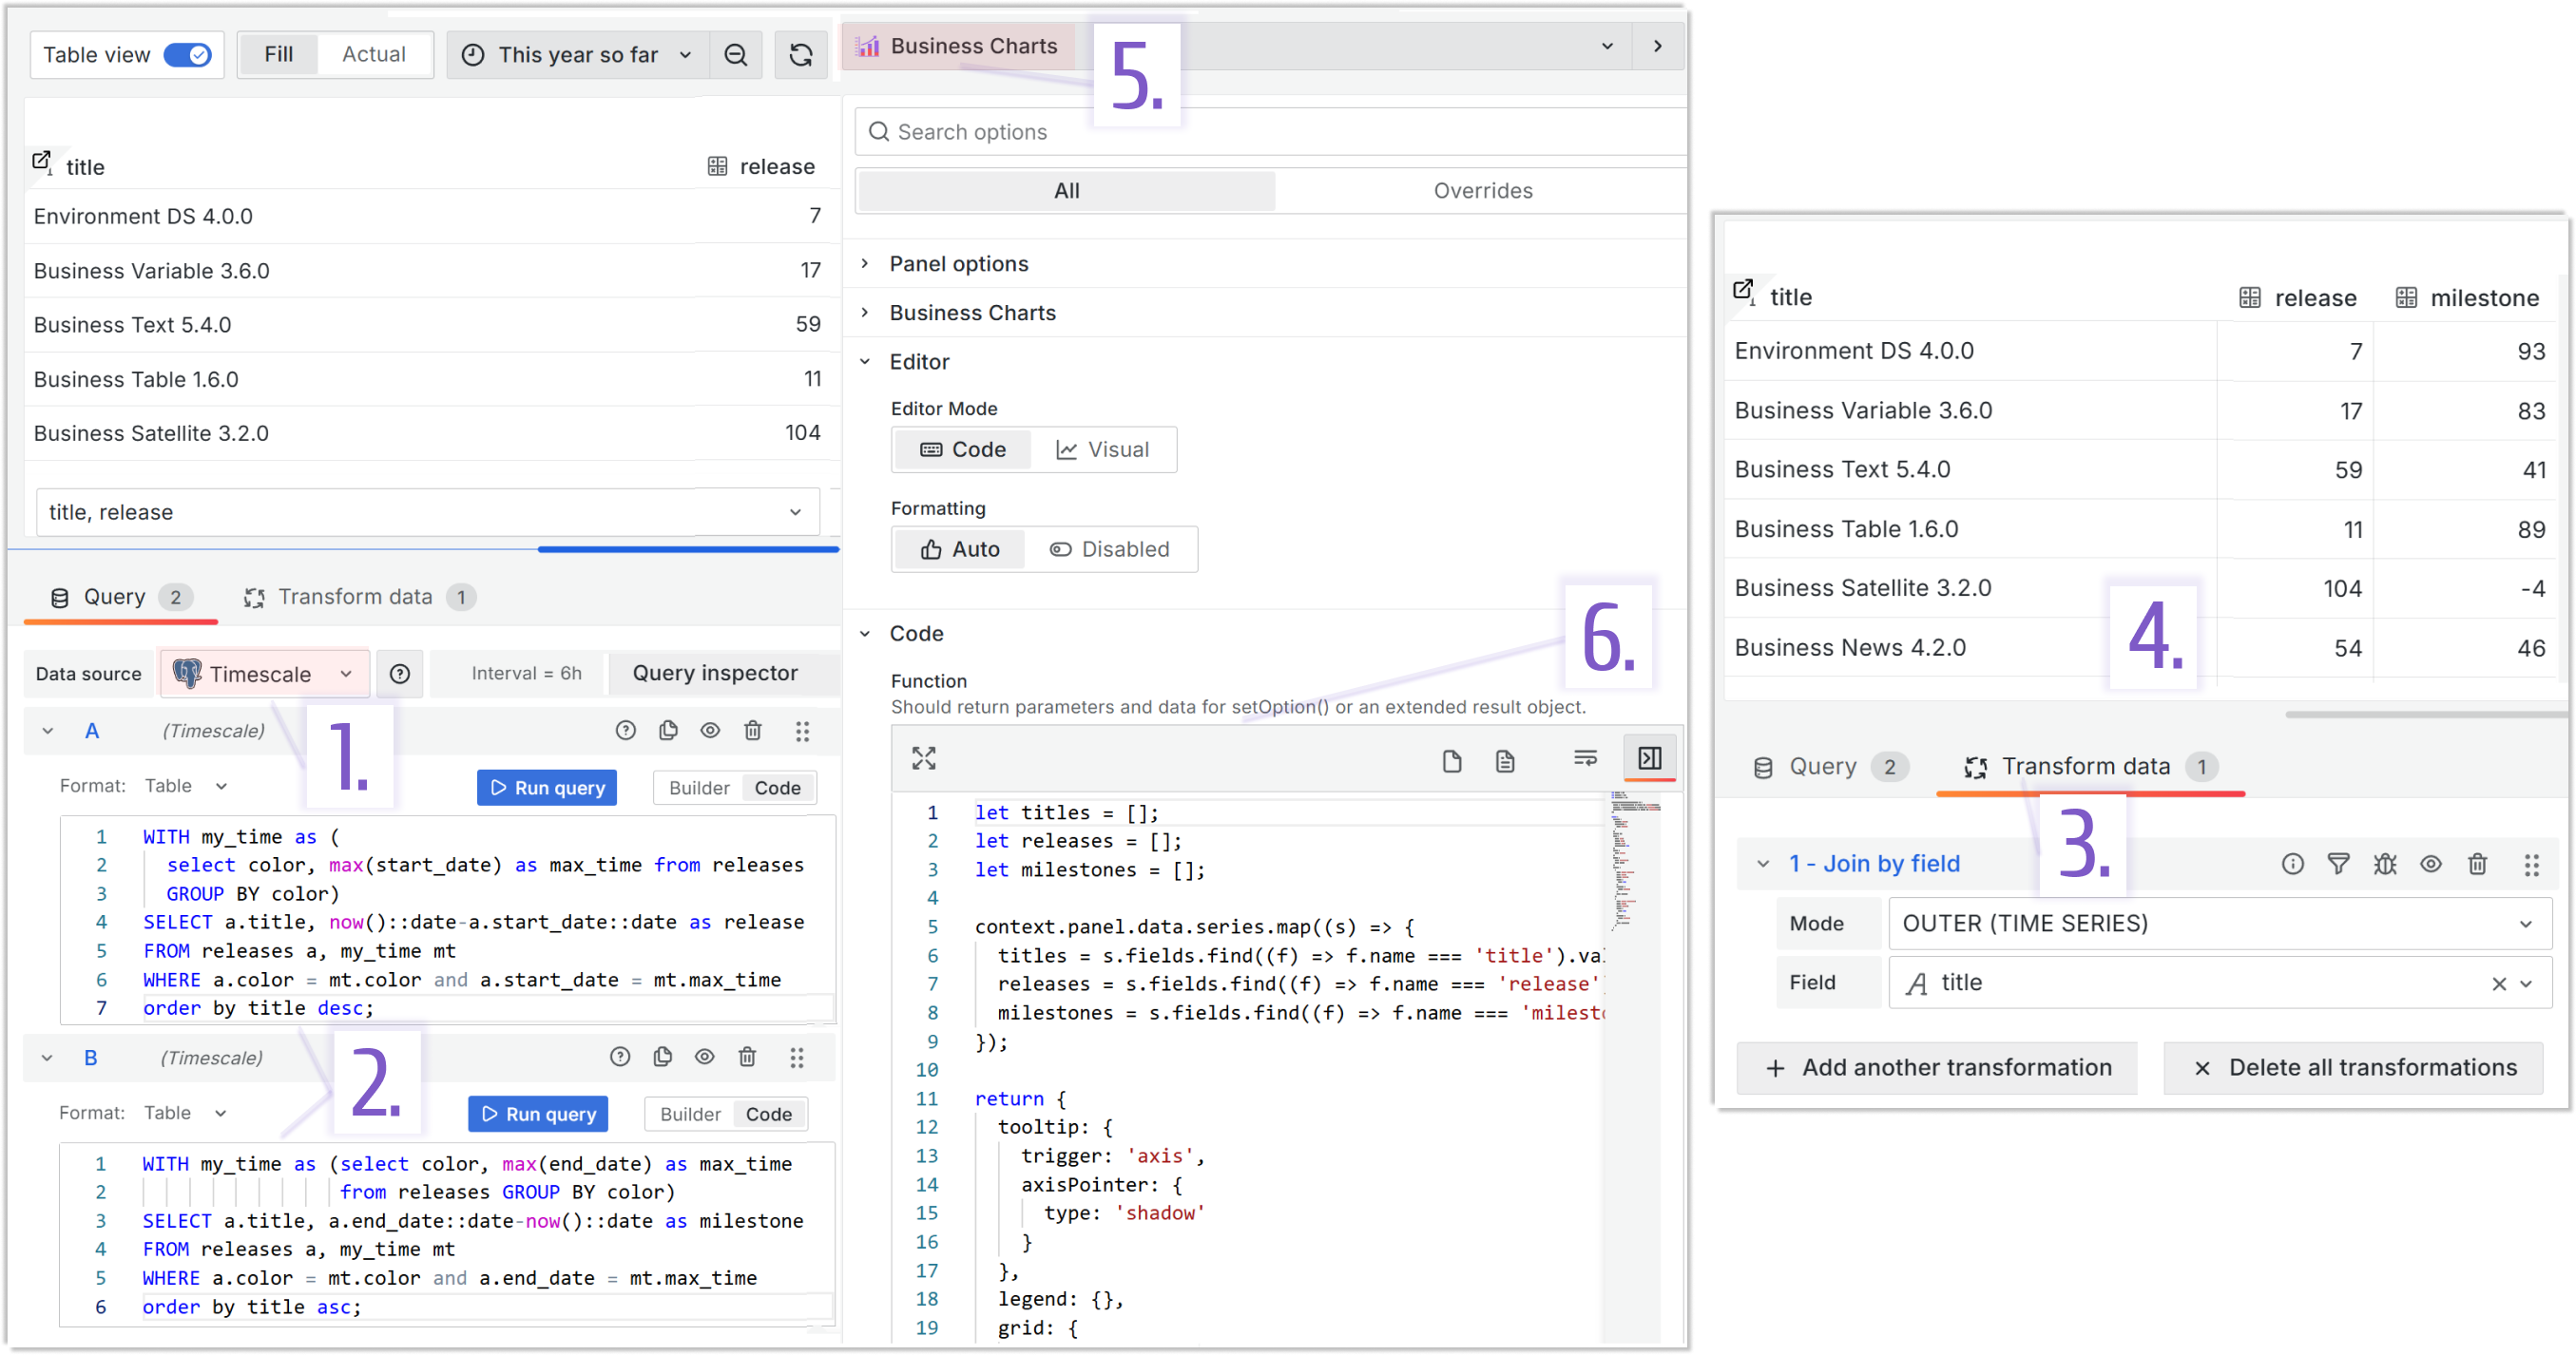
- Query A:
WITH my_time as (SELECT color, max(start_date) as max_time FROM releases GROUP BY color)
SELECT a.title, now()::date-a.start_date::date as release
FROM releases a, my_time mt
WHERE a.color = mt.color and a.start_date = mt.max_time
order by title desc;
- Query B:
WITH my_time as (SELECT color, max(end_date) as max_time FROM releases GROUP BY color)
SELECT a.title, a.end_date::date-now()::date as milestone
FROM releases a, my_time mt
WHERE a.color = mt.color and a.end_date = mt.max_time
order by title asc
There are plently of ways to learn how to configure the Business Charts panel:
- Sandbox echarts.volkovlabs.io.
- Instruction on how to use the Sandbox.
- Visual Editor mode
- Blog posts
- Our video tutorials
- The Function parameter JavaScript code:
let titles = [];
let releases = [];
let milestones = [];

context.panel.data.series.map((s) => {
  titles = s.fields.find((f) => f.name === "title").values;
  releases = s.fields.find((f) => f.name === "release").values;
  milestones = s.fields.find((f) => f.name === "milestone").values;
});

return {
  tooltip: {
    trigger: "axis",
    axisPointer: {
      type: "shadow",
    },
  },
  legend: {},
  grid: {
    left: "3%",
    right: "4%",
    bottom: "3%",
    containLabel: true,
  },
  xAxis: {
    type: "value",
  },
  yAxis: {
    type: "category",
    data: titles,
  },
  series: [
    {
      name: "Since Release",
      type: "bar",
      stack: "total",
      label: {
        show: true,
      },
      emphasis: {
        focus: "series",
      },
      data: releases,
    },
    {
      name: "Until Milestone",
      type: "bar",
      stack: "total",
      label: {
        show: true,
      },
      emphasis: {
        focus: "series",
      },
      data: milestones,
    },
  ],
};
Open Issues panel
This visualization shows the number of currently open issues per each plugin. This metric highlights the plugins with the most interest from the Grafana community. At this moment, our Business Table panel is a star with 34 open issues, while the second place takes the Business Forms panel with only 8.
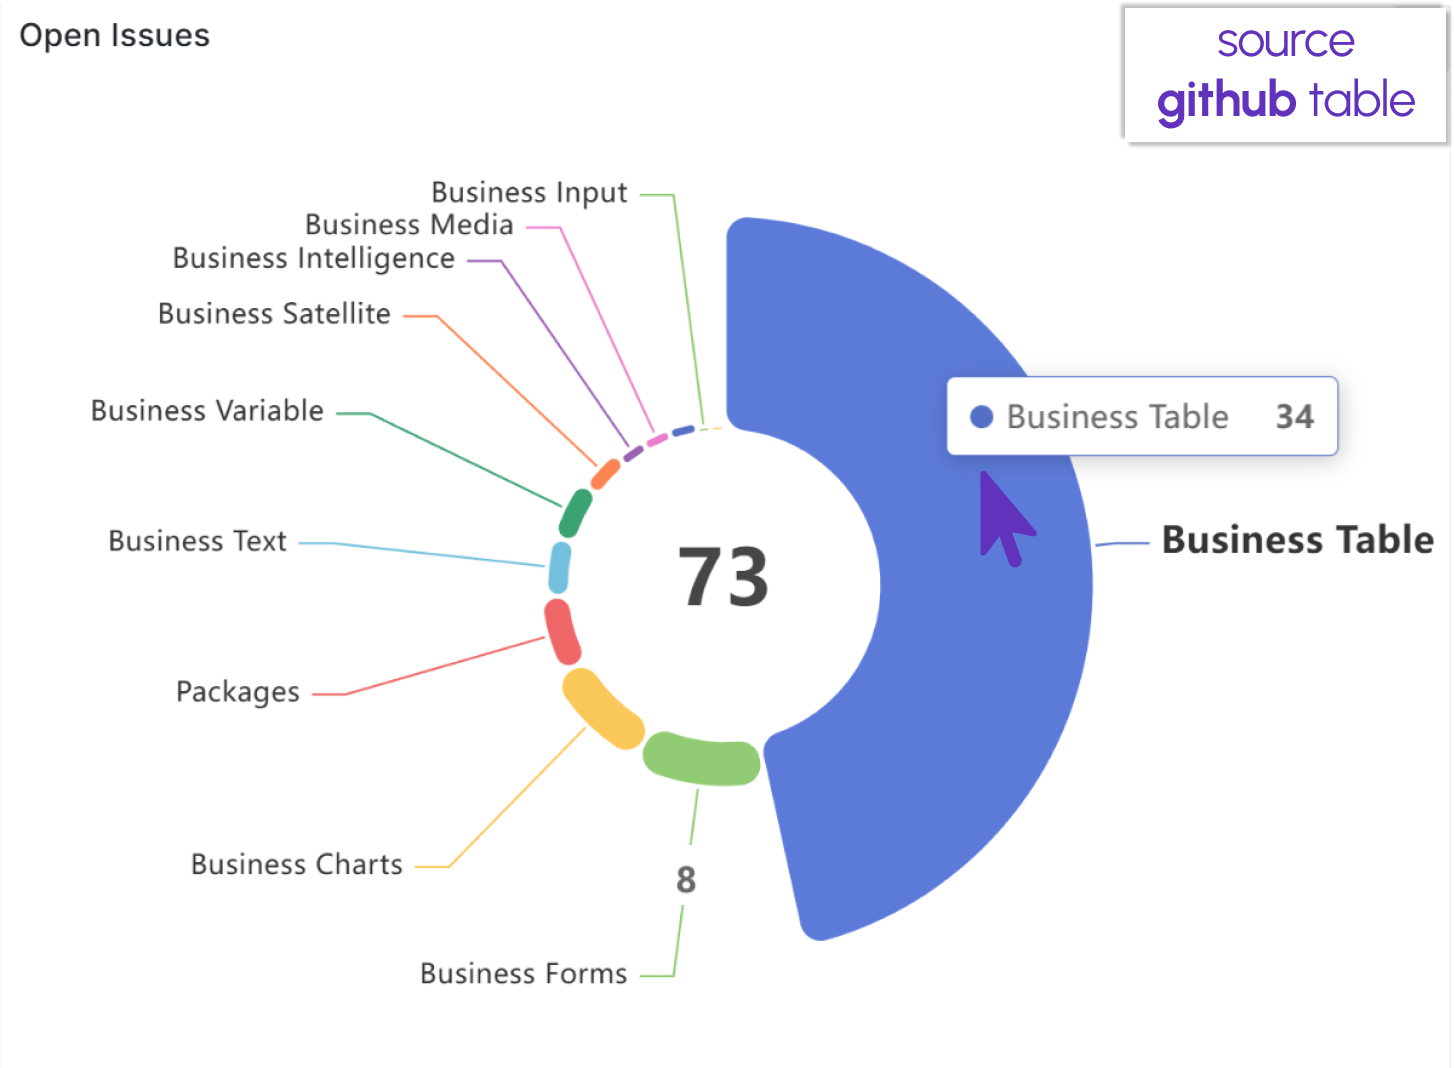
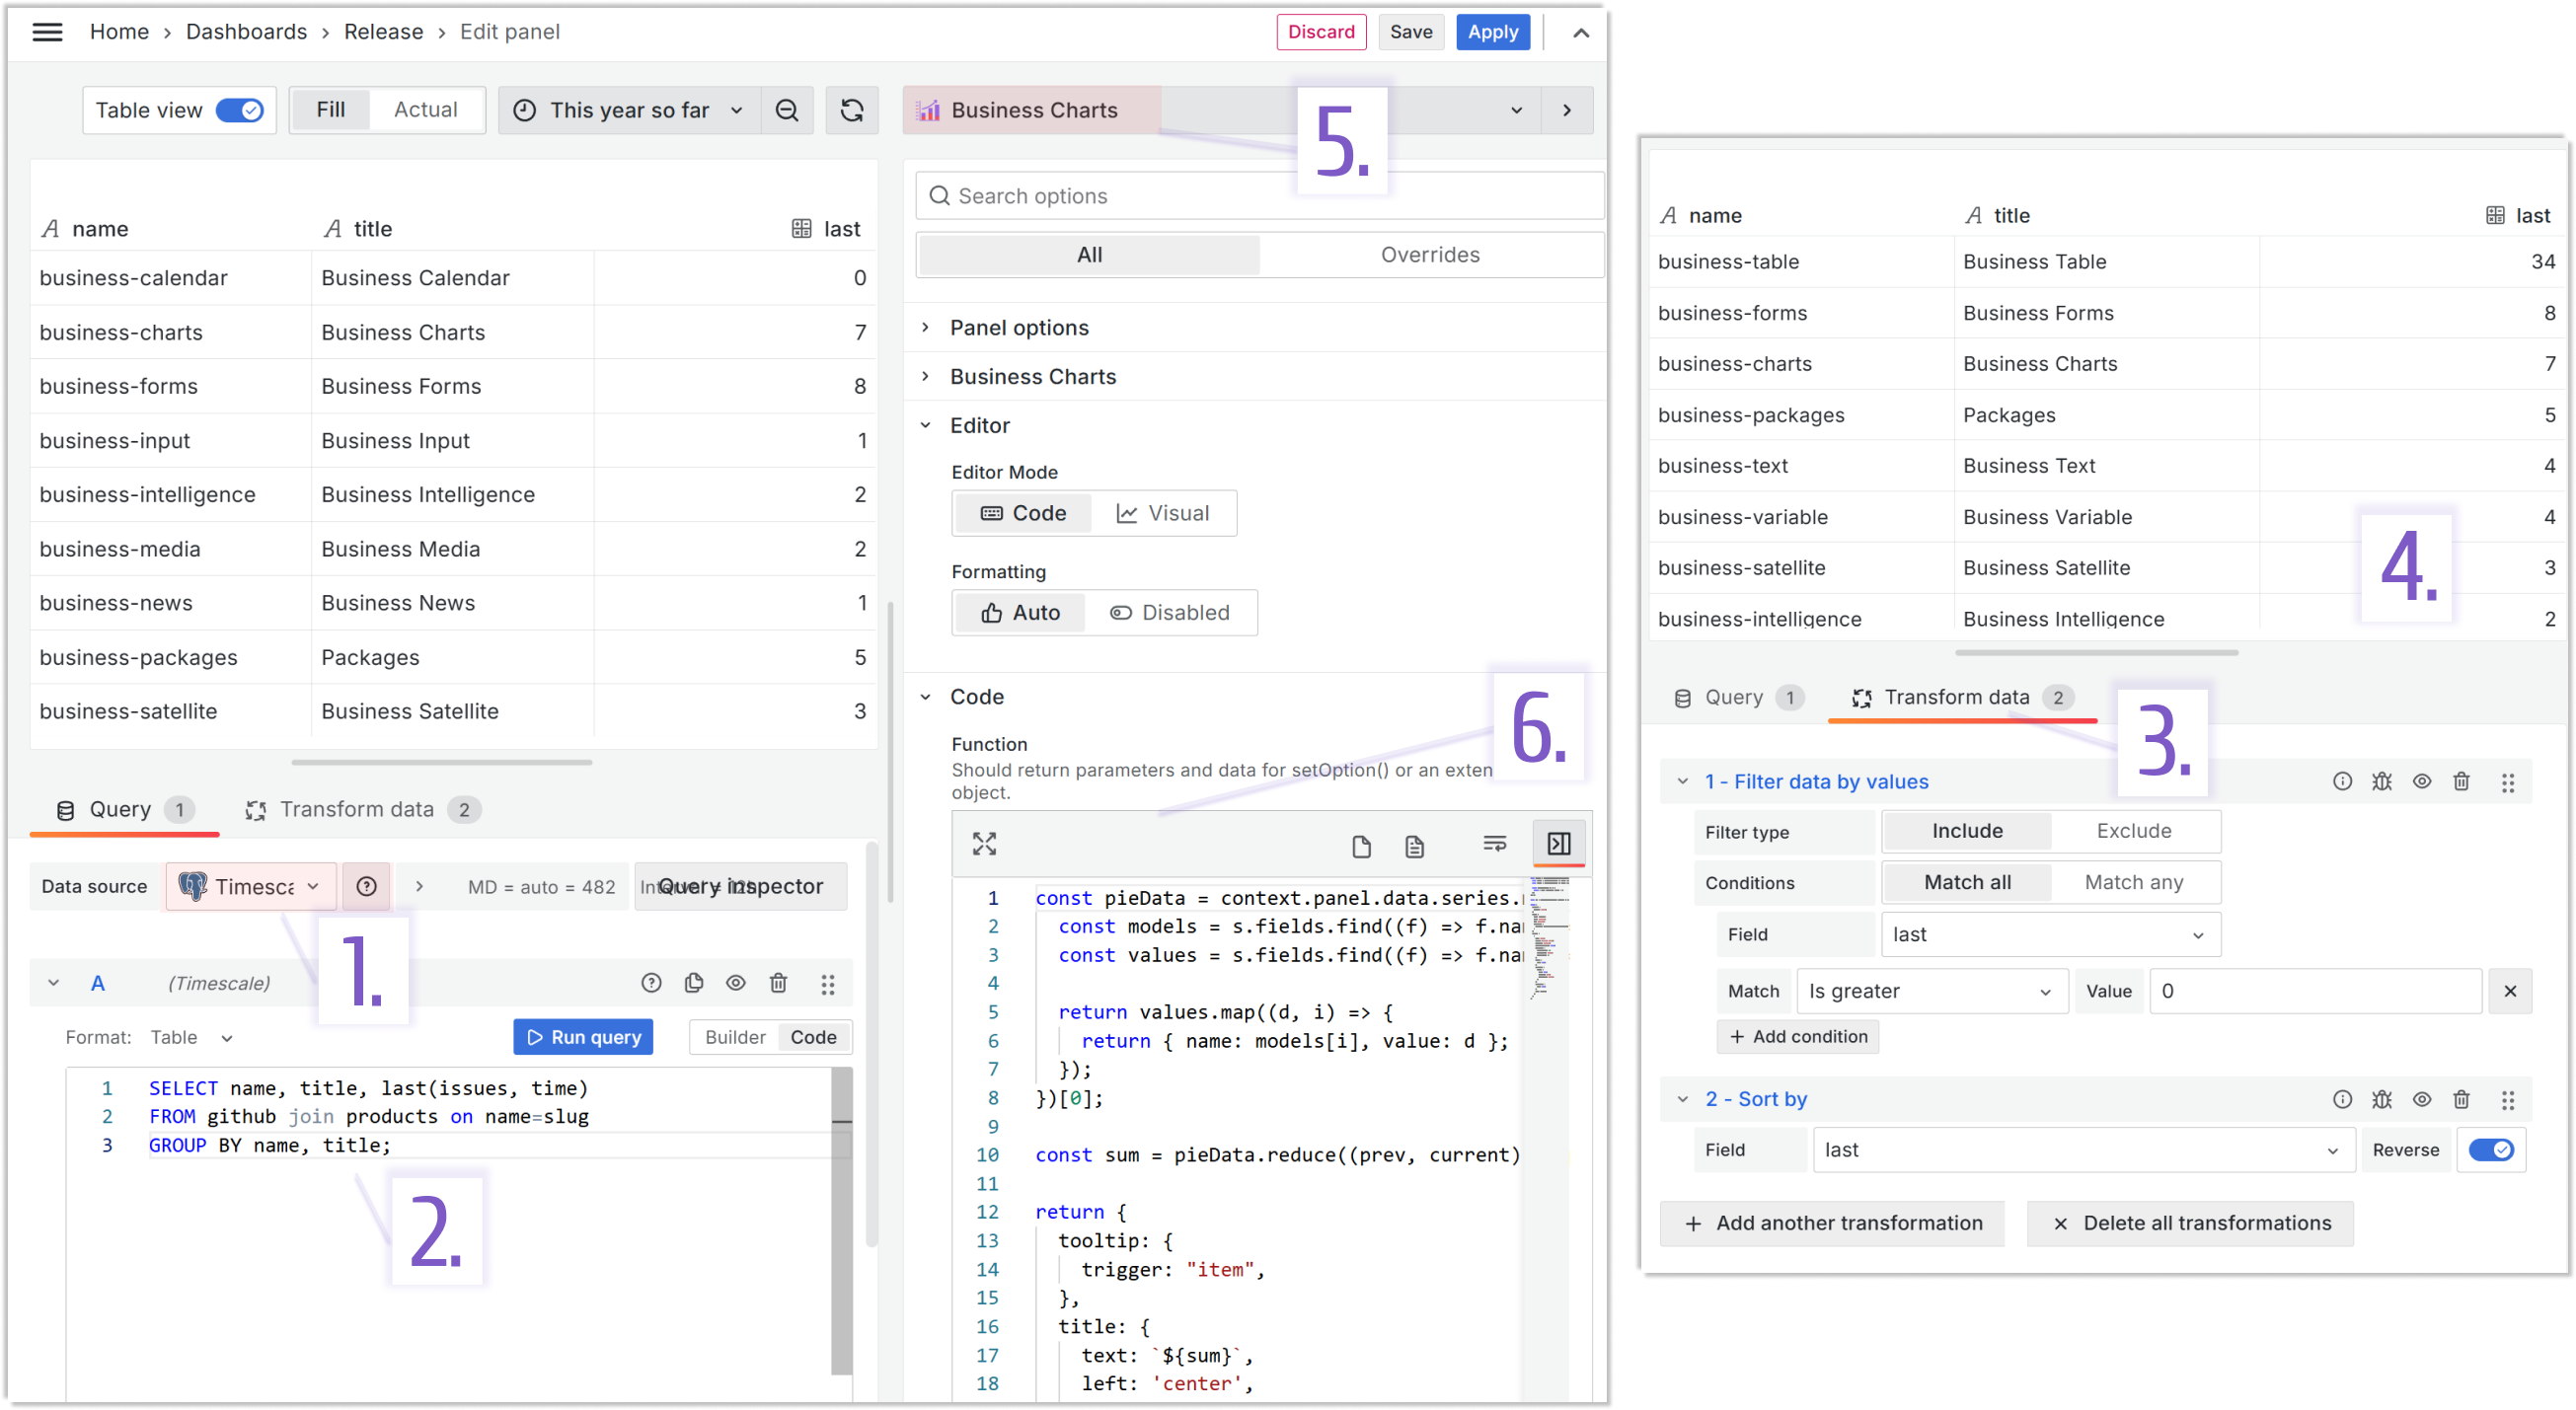
Below is the Open Issues panel configuration.
| Step | Open Issues panel configuration |
|---|---|
| 1. Data source selection | Timescale |
| 2. Specify query | The panel runs one SQL query which returns the number of open issues per plugin |
| 3. Apply transformations | We use the Filter data by values transformation to keep plugins only open issues greater than 0. And then Sort by to order plugins by that number |
| 4. Extracted data review | |
| 5. Select a visualization panel from a list | Business Charts panel |
| 6. Configure panel properties | We use the Code Editor mode. See the code below |
- Query A:
SELECT name, title, last(issues, time)
FROM github join products on name=slug
GROUP BY name, title;
- The Function parameter JavaScript code:
const pieData = context.panel.data.series.map((s) => {
  const models = s.fields.find((f) => f.name === "title").values;
  const values = s.fields.find((f) => f.name === "last").values;

  return values.map((d, i) => {
    return { name: models[i], value: d };
  });
})[0];

const sum = pieData.reduce((prev, current) => prev + current.value, 0);

return {
  tooltip: {
    trigger: "item",
  },
  title: {
    text: `${sum}`,
    left: "center",
    top: "center",
    textStyle: {
      fontSize: context.panel.chart.getHeight() / 10,
    },
  },
  series: [
    {
      type: "pie",
      radius: ["30%", "70%"],
      roseType: "radius",
      avoidLabelOverlap: false,
      itemStyle: {
        borderRadius: 10,
        borderColor: "#fff",
        borderWidth: 2,
      },
      label: {
        show: true,
      },
      emphasis: {
        label: {
          show: true,
          fontSize: "16",
          fontWeight: "bold",
        },
      },
      labelLine: {
        show: true,
      },
      data: pieData,
    },
  ],
};
Toolkit panel
This panel shows the number of our plugins that have migrated to the latest Grafana versions. All our products migrate promptly. At this moment, all of them are at least on Grafana 11.1
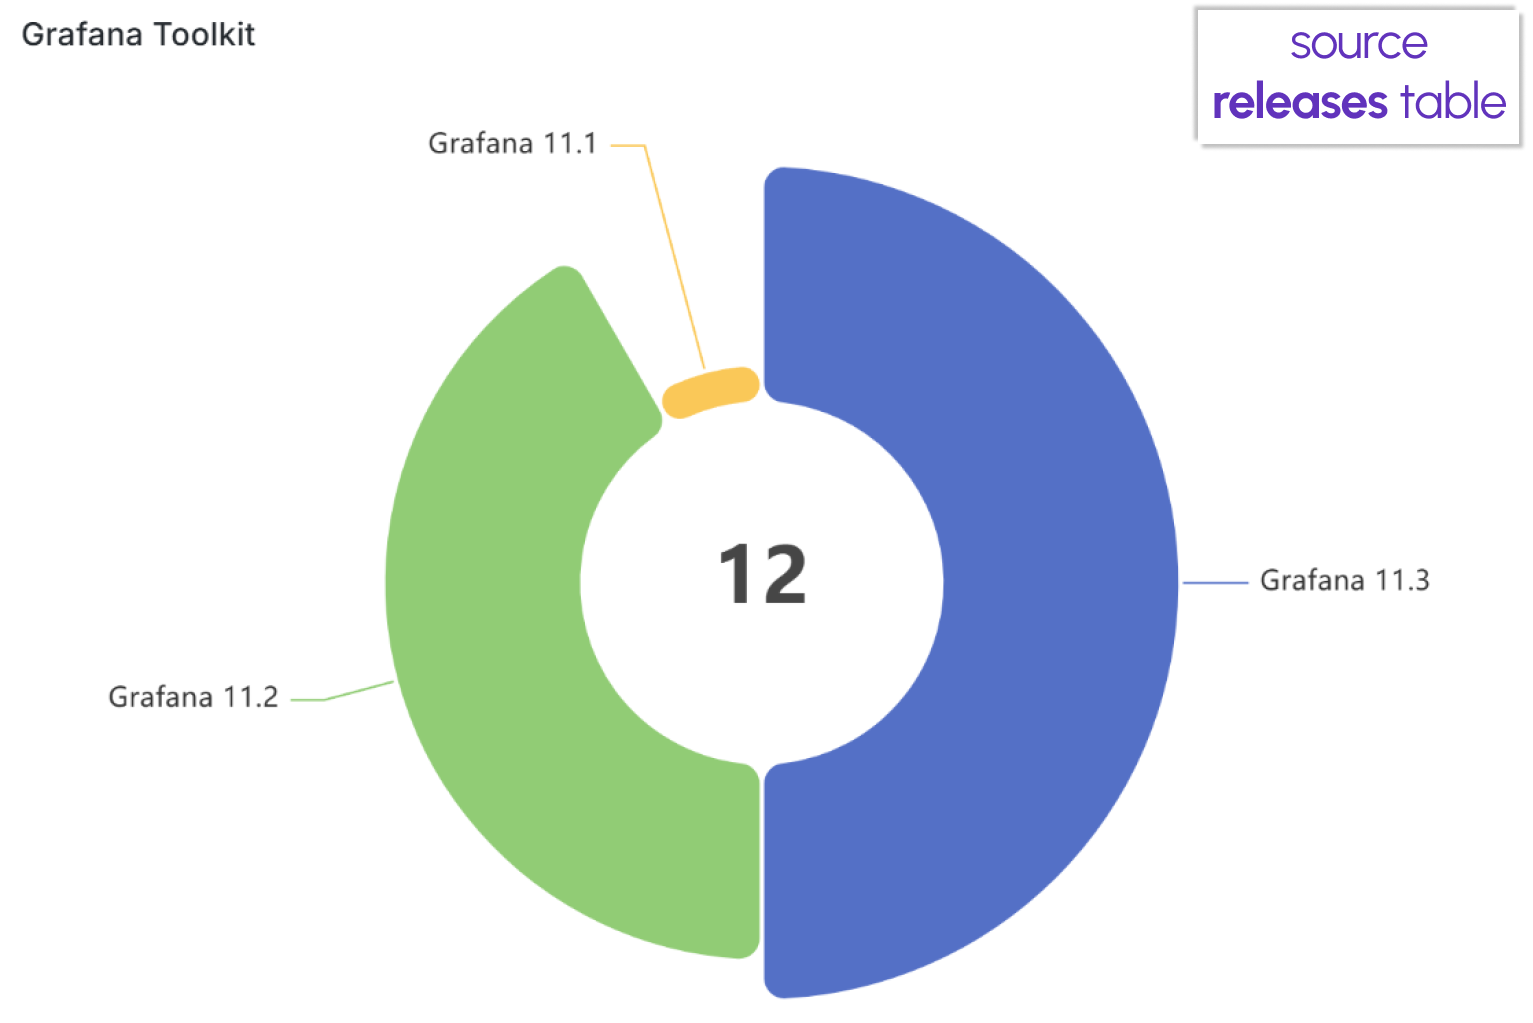
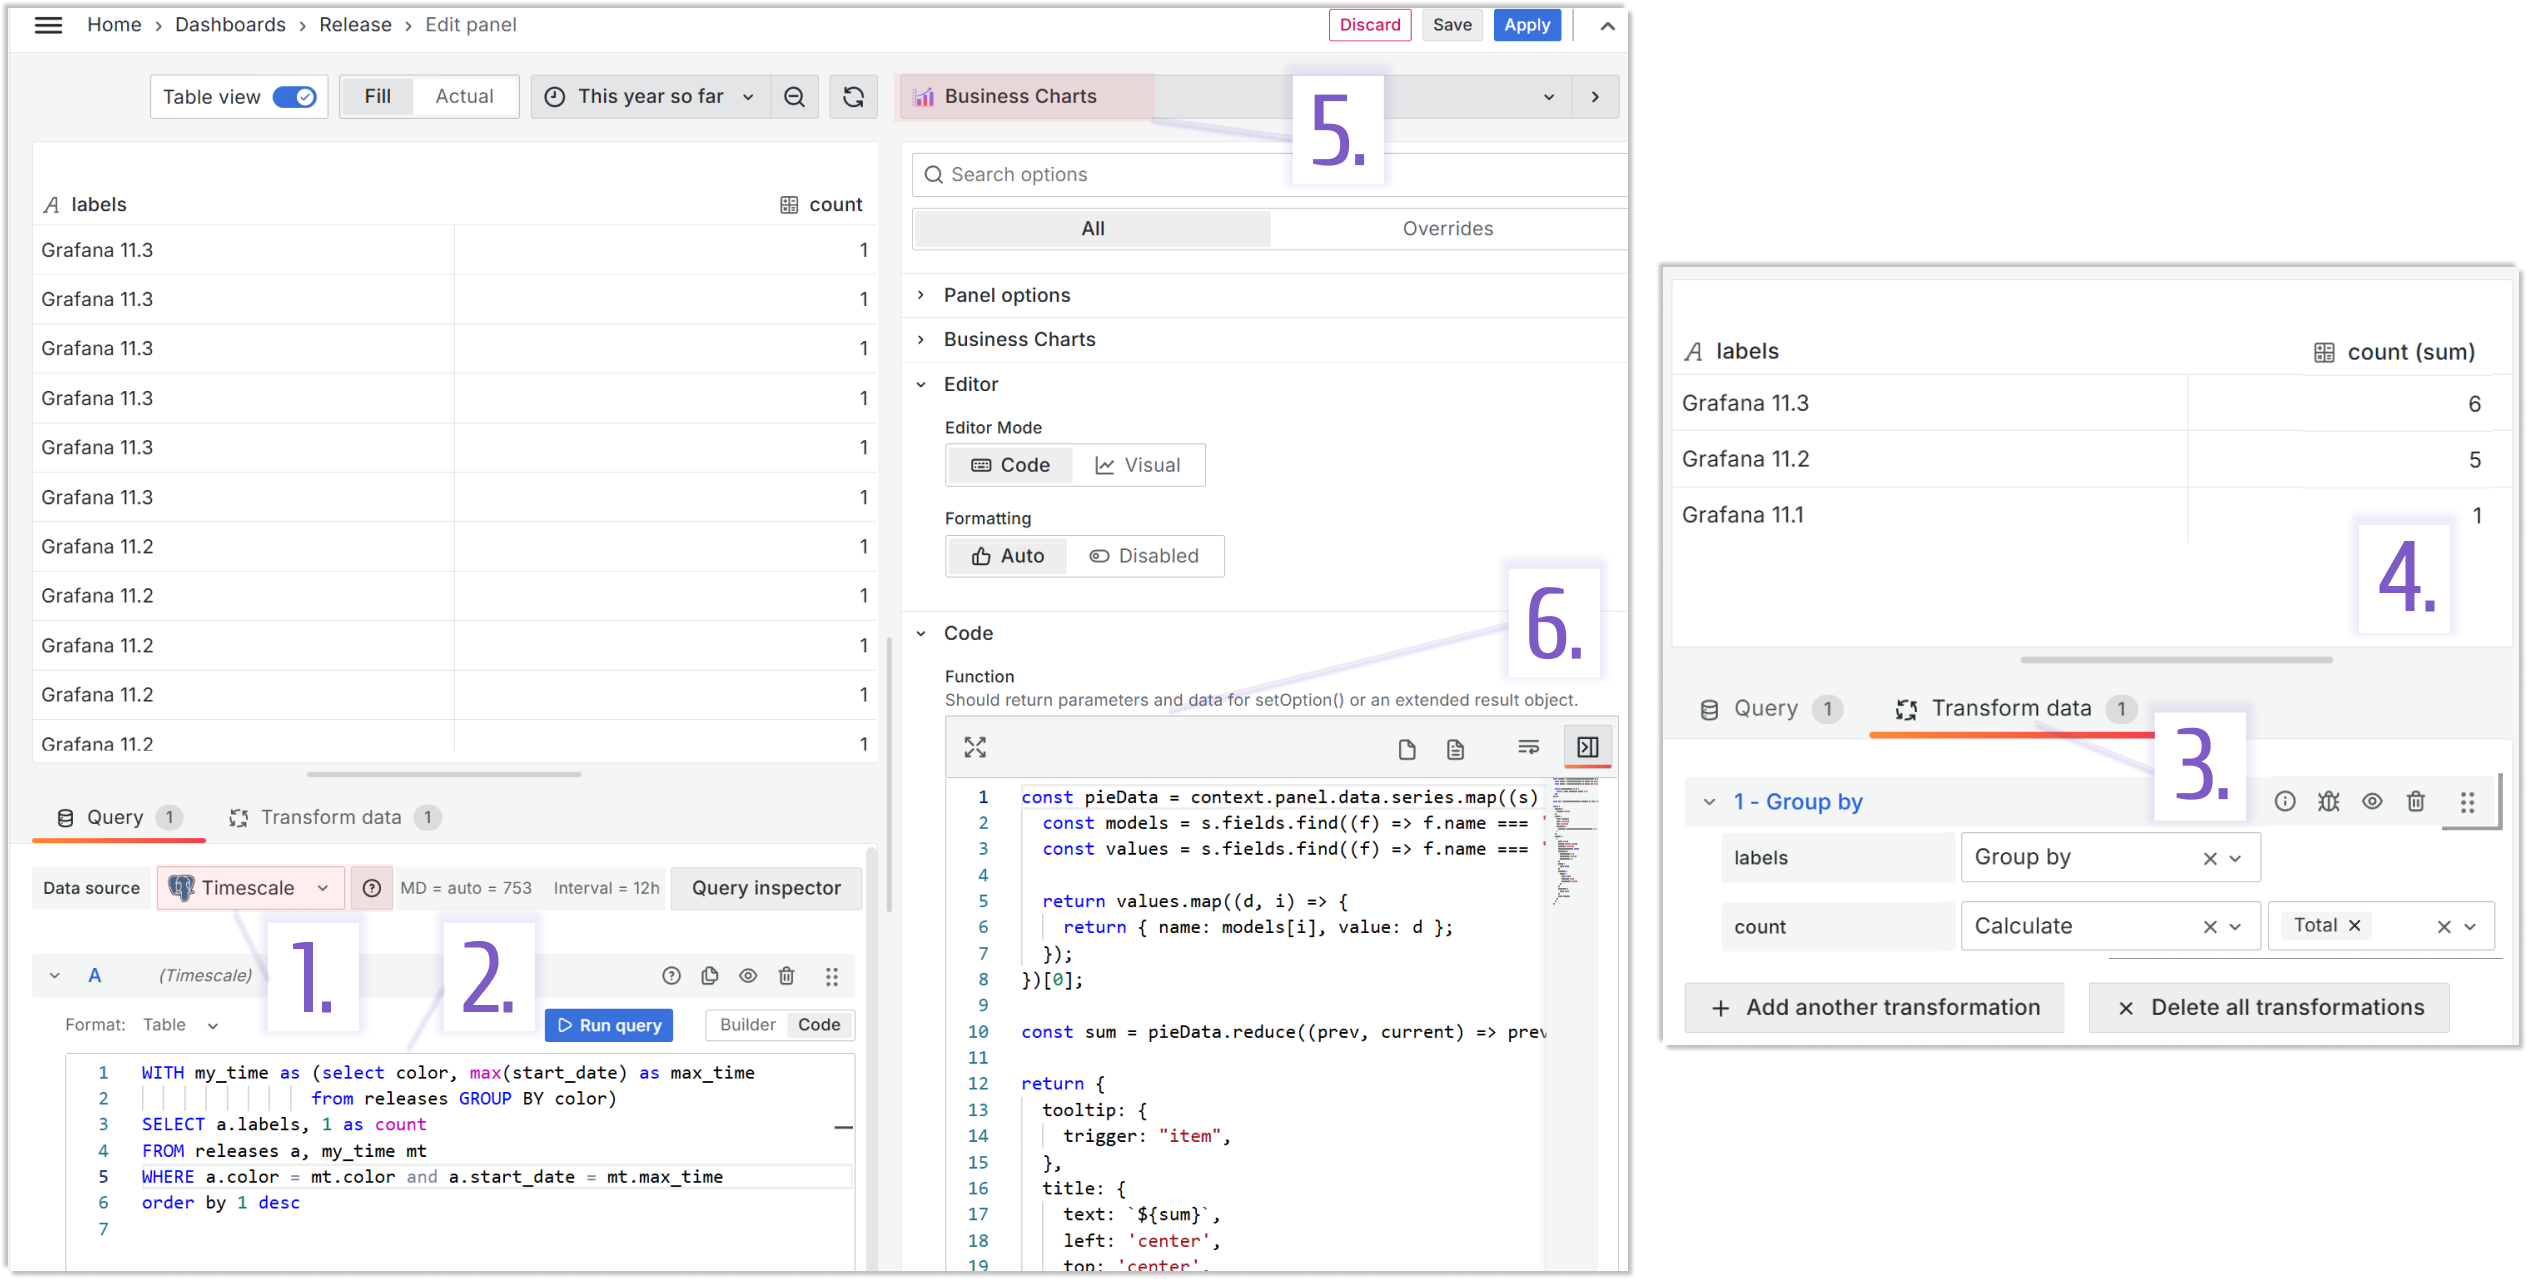
Below is the Grafana Toolkit panel configuration.
| Step | Grafana Toolkit panel configuration |
|---|---|
| 1. Data source selection | Timescale |
| 2. Specify query | The panel runs one SQL query which returns Grafana version for each plugin |
| 3. Apply transformations | We use the Group by transformation to calculate the number of supported plugins by each Grafana version |
| 4. Extracted data review | |
| 5. Select a visualization panel from a list | Business Charts panel |
| 6. Configure panel properties | We use the Code Editor mode. See the code below |
- Query A:
WITH my_time as (SELECT color, max(start_date) as max_time FROM releases GROUP BY color)
SELECT a.labels, 1 as count FROM releases a, my_time mt
WHERE a.color = mt.color and a.start_date = mt.max_time
order by 1 desc
- The Function parameter JavaScript code:
const pieData = context.panel.data.series.map((s) => {
  const models = s.fields.find((f) => f.name === "labels").values;
  const values = s.fields.find((f) => f.name === "count (sum)").values;

  return values.map((d, i) => {
    return { name: models[i], value: d };
  });
})[0];

const sum = pieData.reduce((prev, current) => prev + current.value, 0);

return {
  tooltip: {
    trigger: "item",
  },
  title: {
    text: `${sum}`,
    left: "center",
    top: "center",
    textStyle: {
      fontSize: context.panel.chart.getHeight() / 10,
    },
  },
  series: [
    {
      type: "pie",
      radius: ["30%", "70%"],
      roseType: "radius",
      avoidLabelOverlap: false,
      itemStyle: {
        borderRadius: 10,
        borderColor: "#fff",
        borderWidth: 2,
      },
      label: {
        show: true,
      },
      emphasis: {
        label: {
          show: true,
          fontSize: "20",
          fontWeight: "bold",
        },
      },
      labelLine: {
        show: true,
      },
      data: pieData,
    },
  ],
};
Weekly downloads panel
This panel is the first of the three, showing the number of our plugin downloads. This visualization focuses on the weekly downloads to illustrate community interest from one week to another.
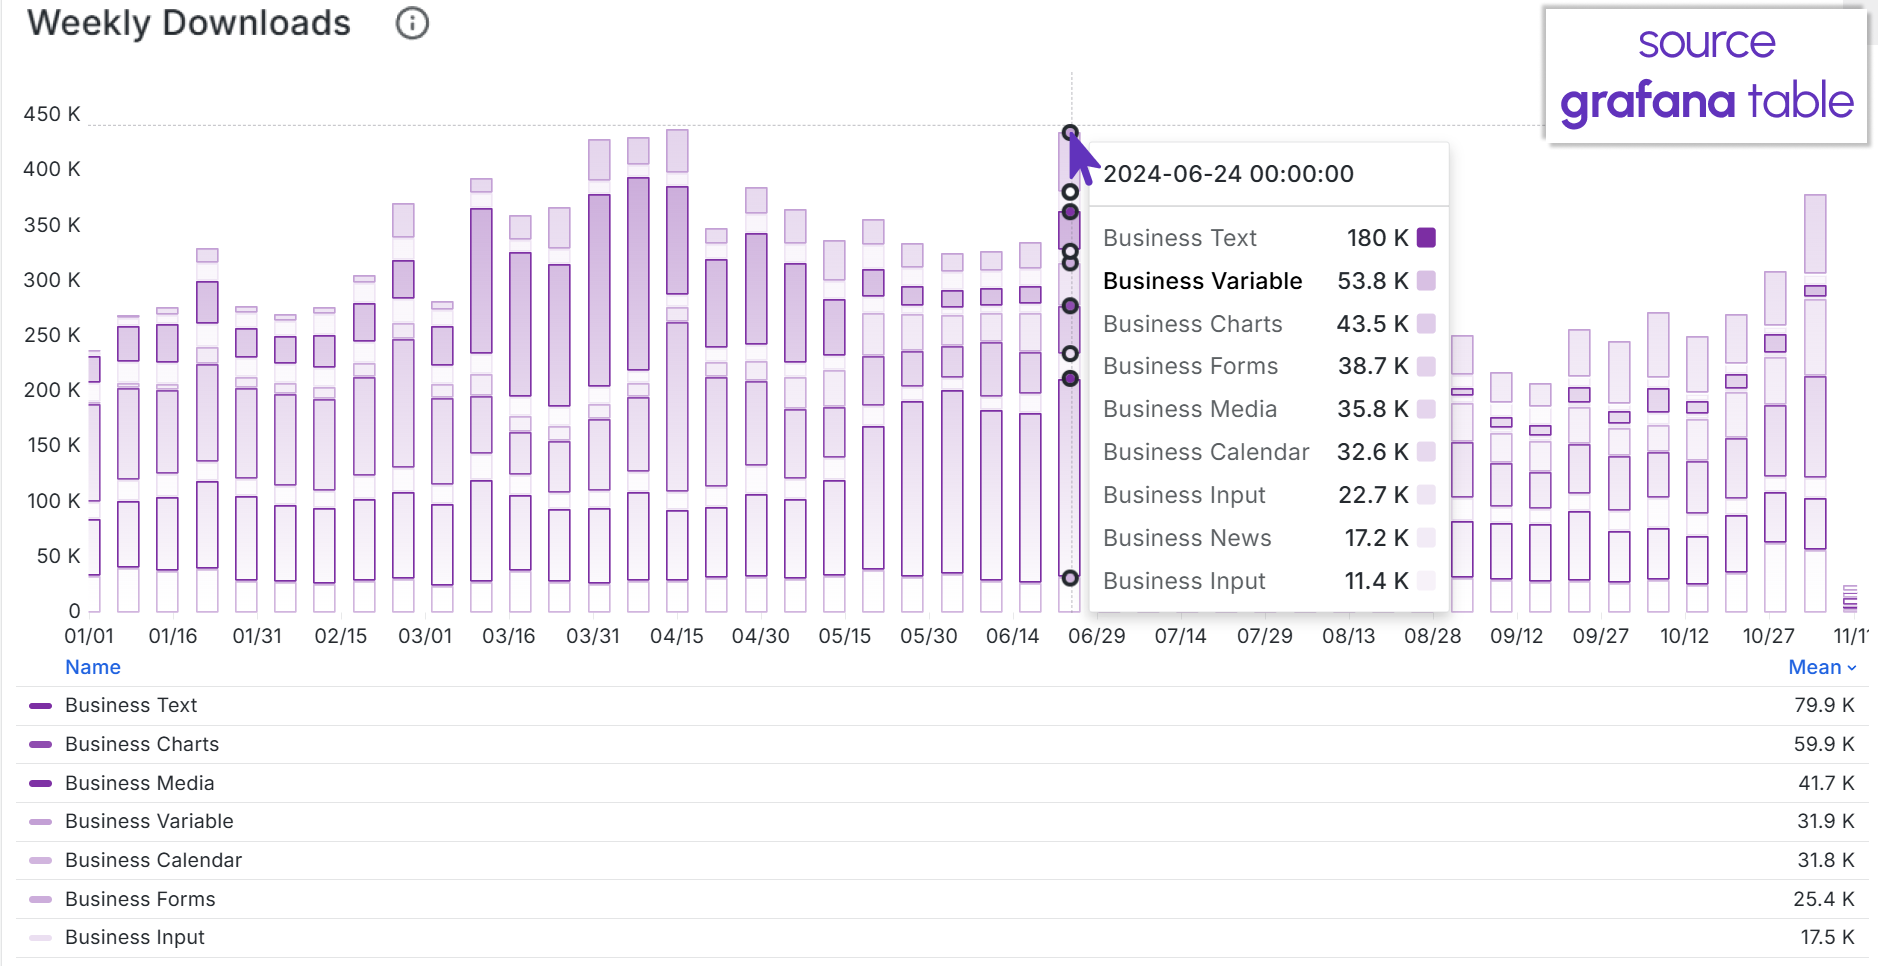
Below is the Weekly downloads panel configuration.
| Step | Weekly downloads panel configuration |
|---|---|
| 1. Data source selection | Timescale |
| 2. Specify query | The panel runs one SQL query in the Time series format, which returns a date and then a number of weekly downloads for each of the specified in the query products |
| 3. Apply transformations | We use the Organize fields by name transformation to convert database specific product names into user-friendly names |
| 4. Extracted data review | |
| 5. Select a visualization panel from a list | Time series |
| 6. Configure panel properties | Use the panel parameter to configure the appearance |
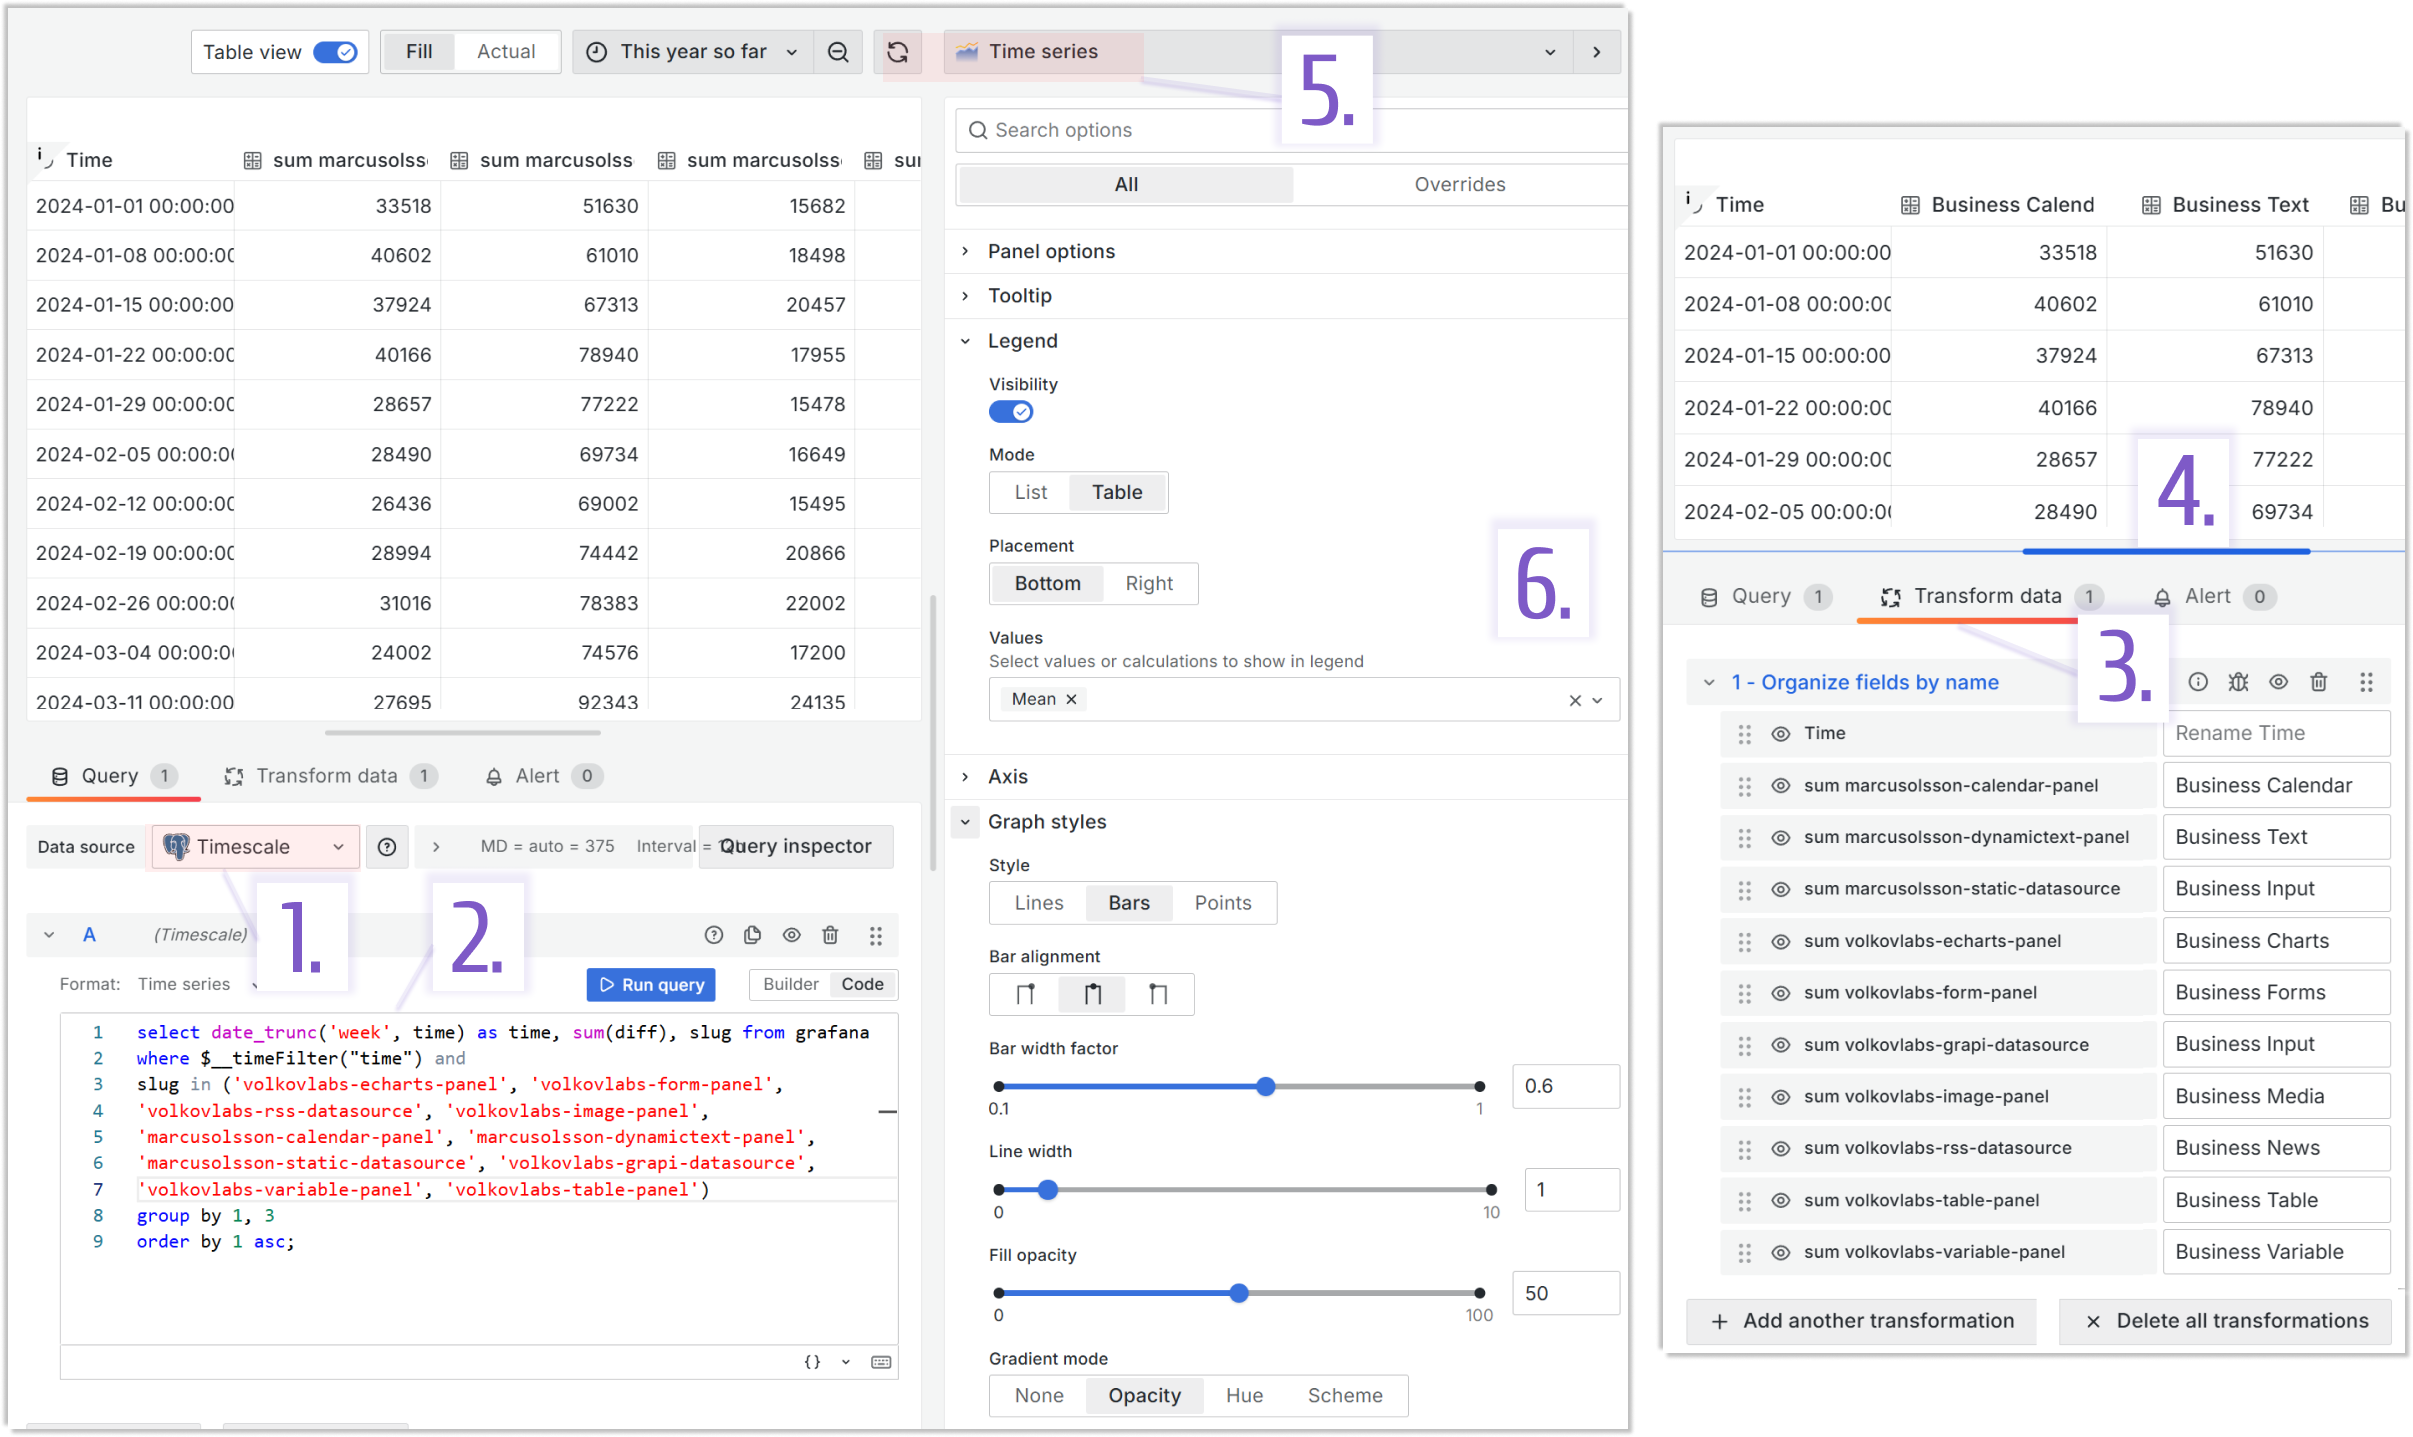
- Query A:
select date_trunc('week', time) as time, sum(diff), slug from grafana
where $__timeFilter("time") and
slug in ('volkovlabs-echarts-panel', 'volkovlabs-form-panel',
'volkovlabs-rss-datasource', 'volkovlabs-image-panel',
'marcusolsson-calendar-panel', 'marcusolsson-dynamictext-panel', 'marcusolsson-static-datasource',
'volkovlabs-grapi-datasource', 'volkovlabs-variable-panel', 'volkovlabs-table-panel')
group by 1, 3
order by 1 asc;
Total downloads panel
This panel is the second of the three, showing the number of our plugin downloads. This visualizaiton focuses on the total downloads from the begining of time until now.
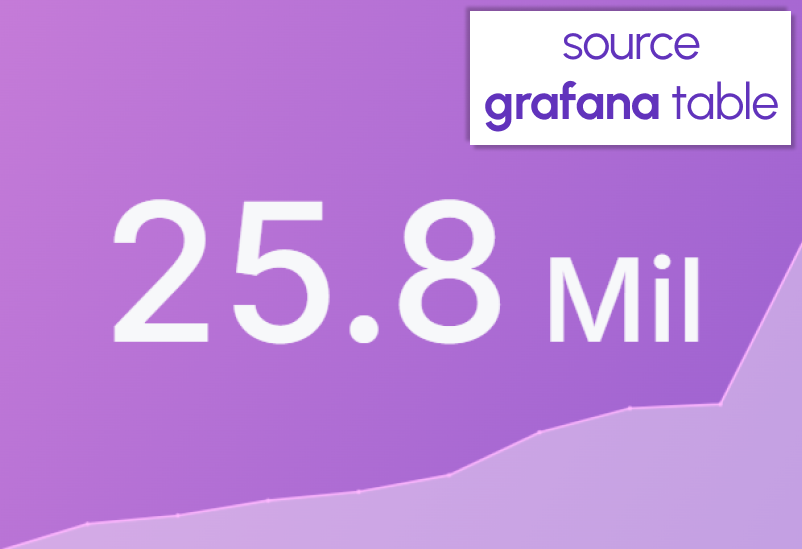
Below is the Total downloads panel configuration.
| Step | Total downloads panel configuration |
|---|---|
| 1. Data source selection | Timescale |
| 2. Specify query | The panel runs one SQL query which returns a last counted number of downloads for each specified plugin |
| 3. Apply transformations | No need for transformation in this panel |
| 4. Extracted data review | |
| 5. Select a visualization panel from a list | Stat |
| 6. Configure panel properties | We use the Total Grafana function, to sum up downloads across all plugins |
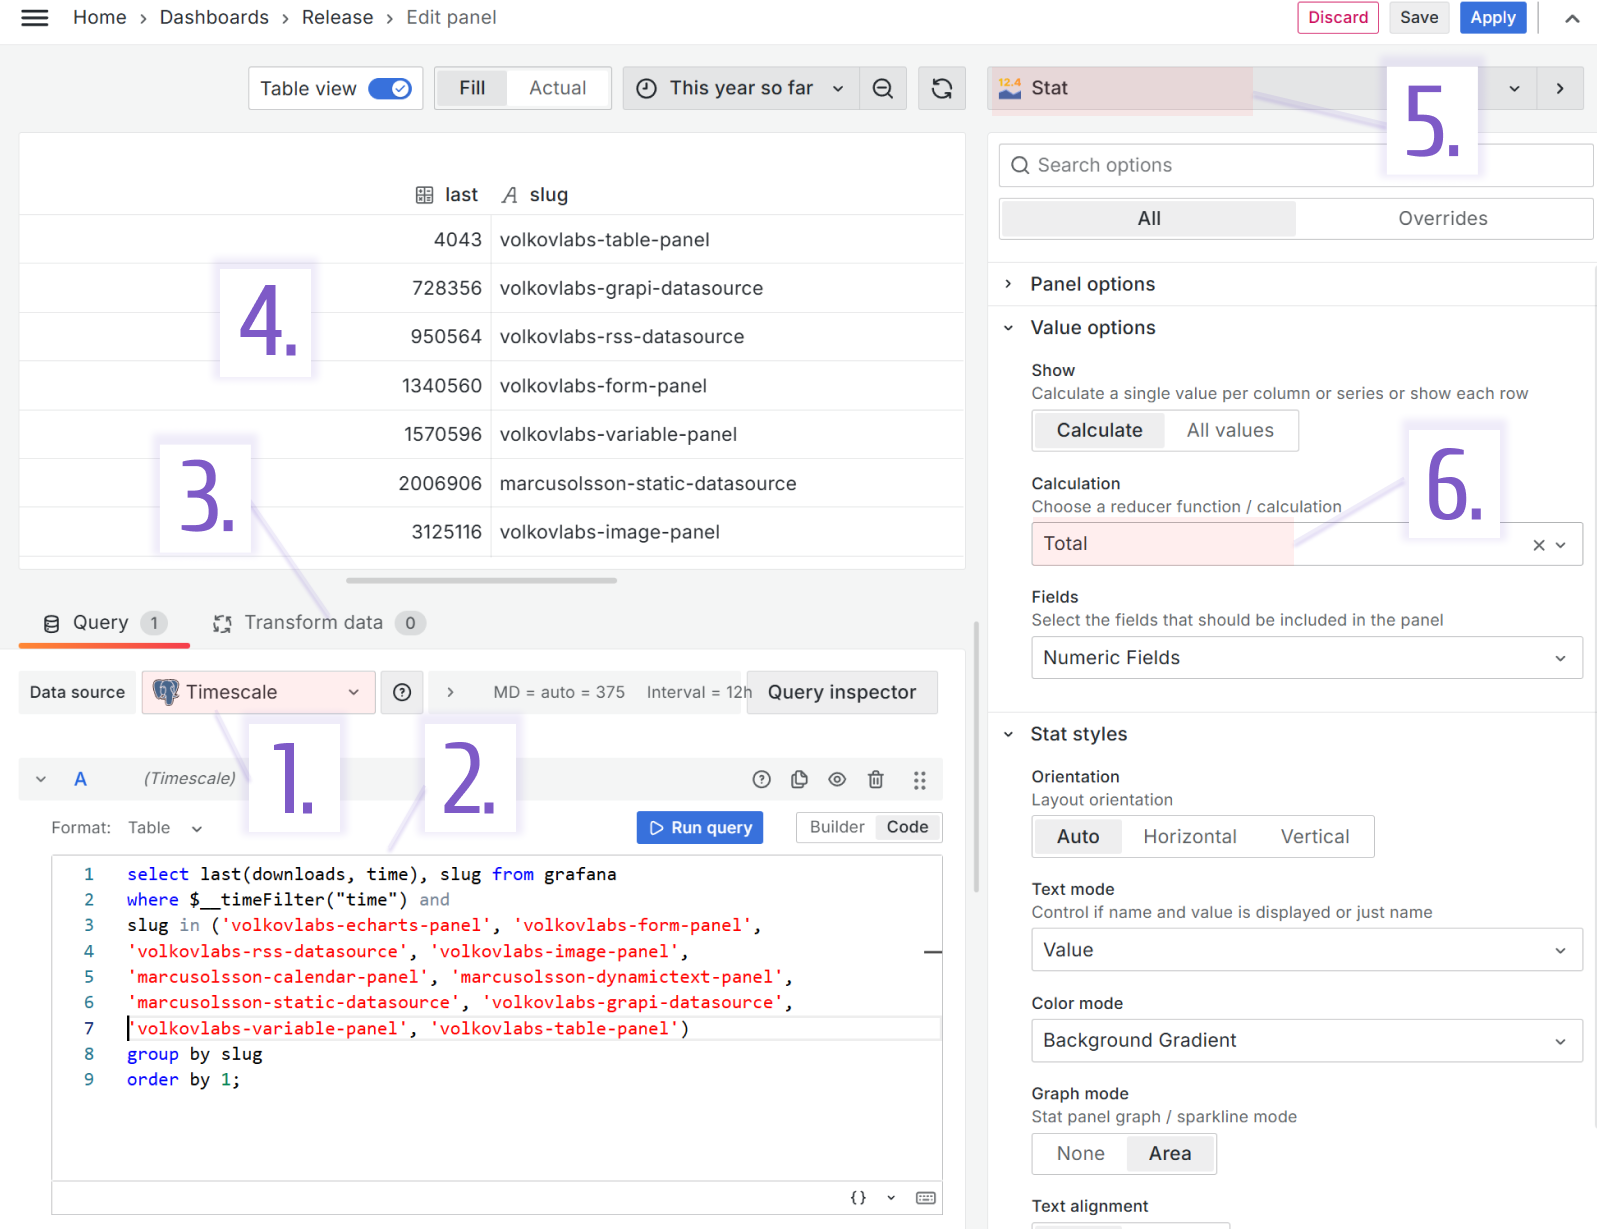
- Query A:
select last(downloads, time), slug from grafana
where $__timeFilter("time") and
slug in ('volkovlabs-echarts-panel', 'volkovlabs-form-panel',
'volkovlabs-rss-datasource', 'volkovlabs-image-panel',
'marcusolsson-calendar-panel', 'marcusolsson-dynamictext-panel', 'marcusolsson-static-datasource',
'volkovlabs-grapi-datasource', 'volkovlabs-variable-panel', 'volkovlabs-table-panel')
group by slug
order by 1;
Total downloads weekly panel
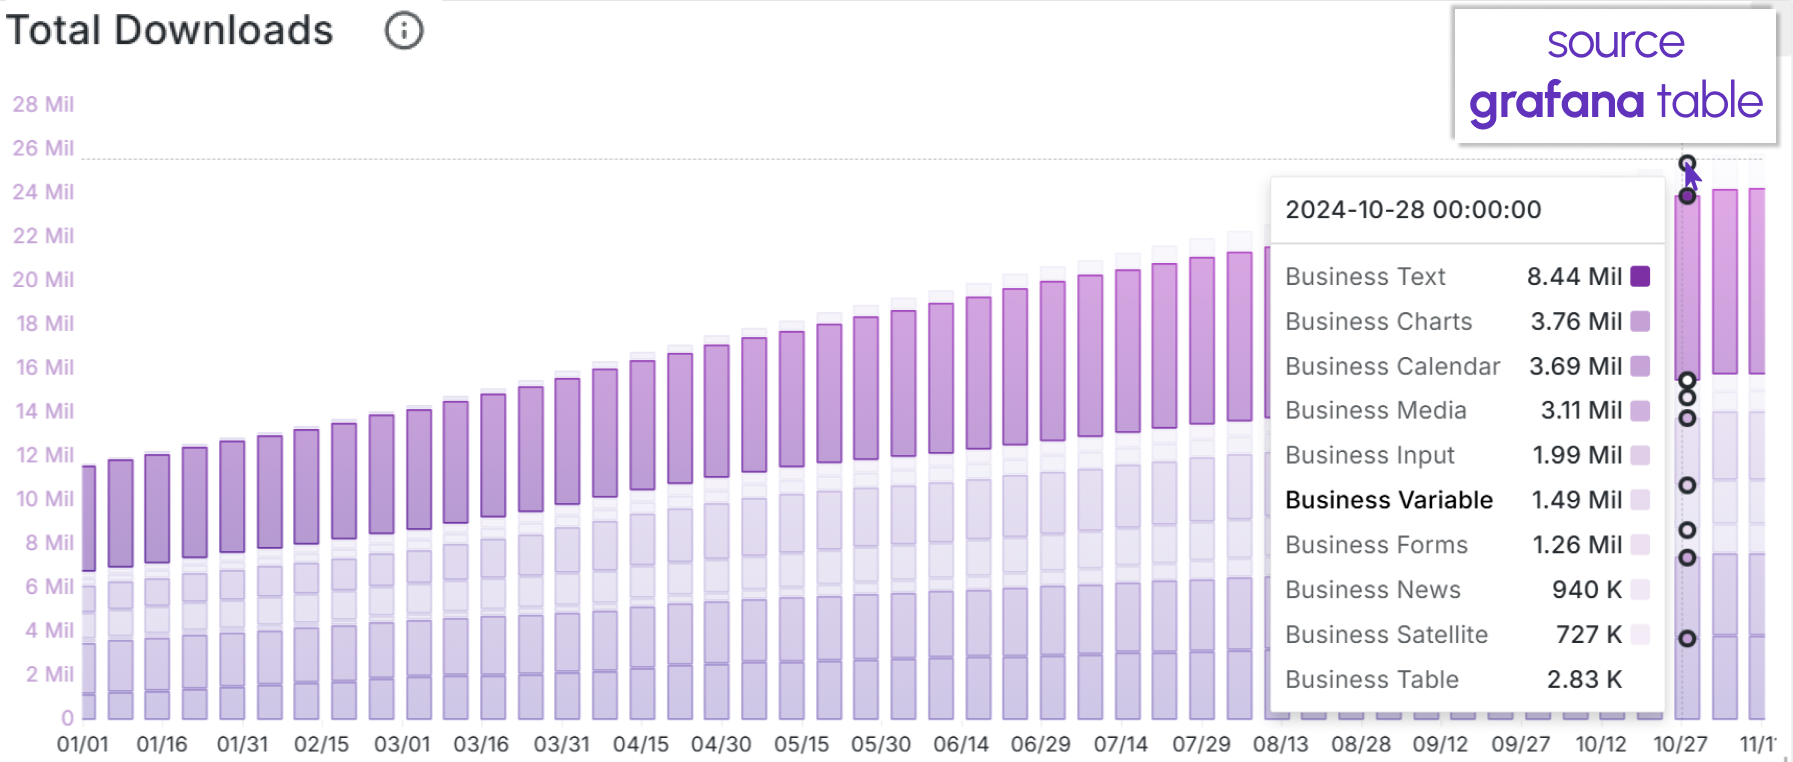
This panel is the third of the three, showing the number of our plugin downloads. It provides details for plugin downloads every week. We can see steadily growing interest in all our Business Suite plugins.
Below is the Total downloads weekly panel configuration.
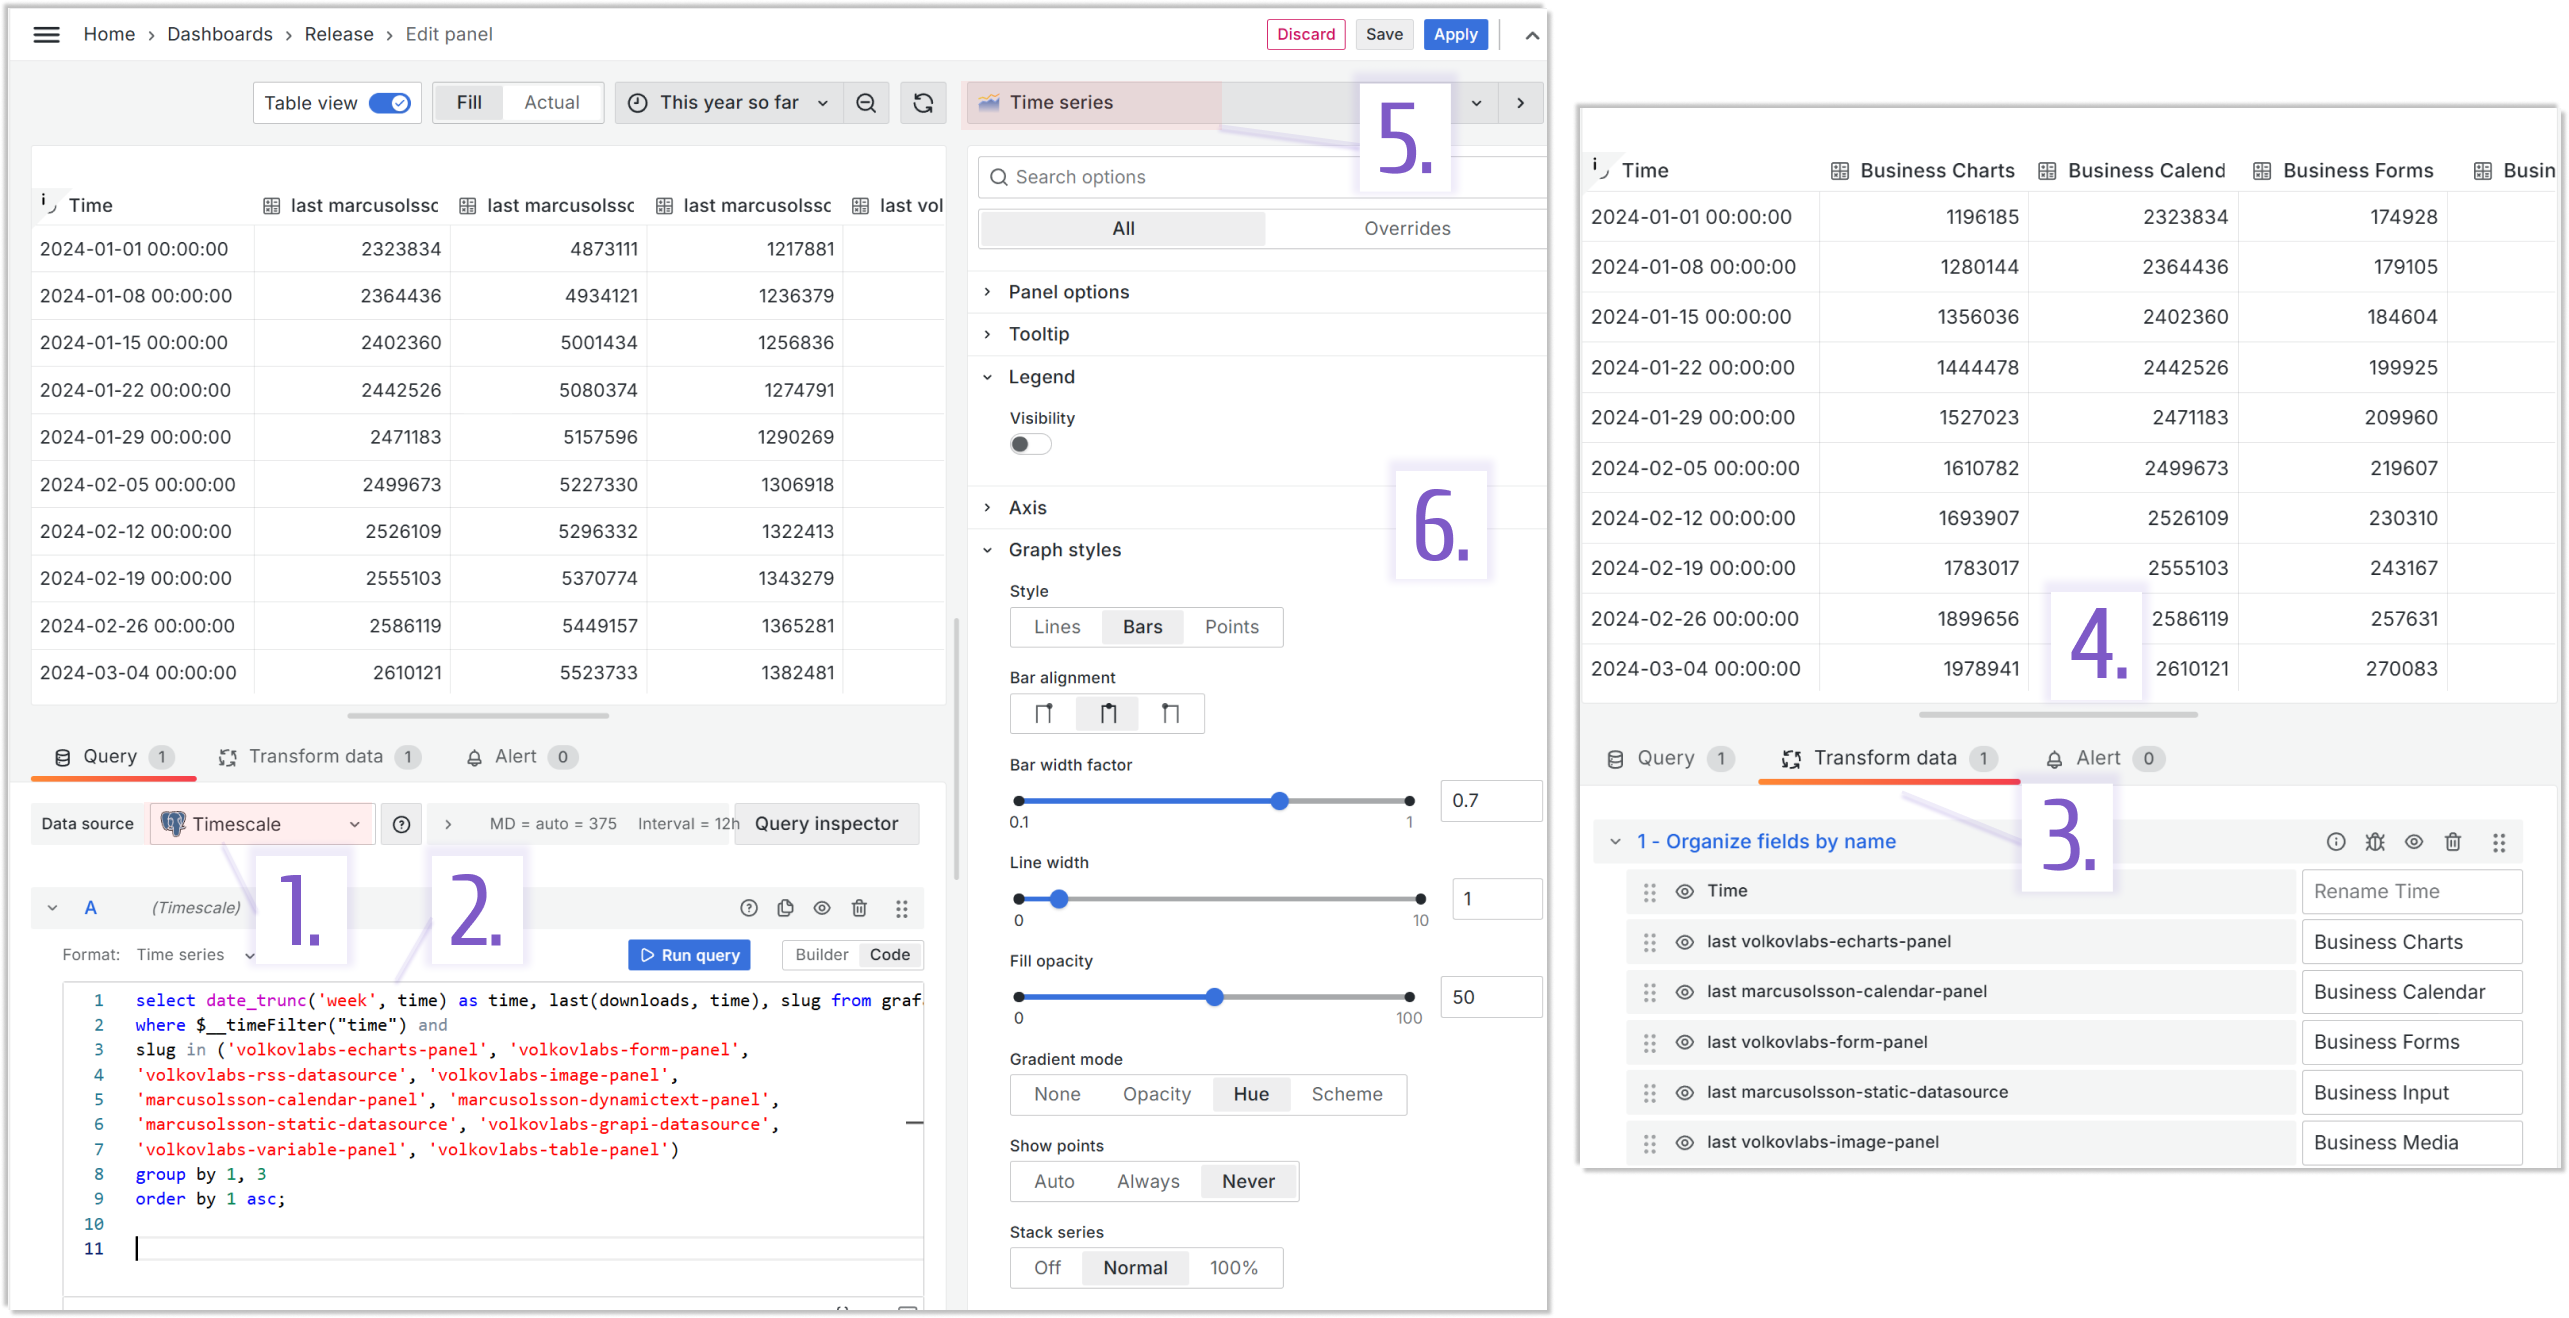
| Step | Total downloads weekly panel configuration |
|---|---|
| 1. Data source selection | Timescale |
| 2. Specify query | The panel runs one SQL query in the Time series format, which returns a date and the number of plugin downloads weekly |
| 3. Apply transformations | We use the Organize fields by name transformation to convert database specific product names into user-friendly names |
| 4. Extracted data review | |
| 5. Select a visualization panel from a list | Time series |
| 6. Configure panel properties | Use the panel parameter to configure the appearance |
- Query A:
select date_trunc('week', time) as time, last(downloads, time), slug from grafana
where $__timeFilter("time") and
slug in ('volkovlabs-echarts-panel', 'volkovlabs-form-panel',
'volkovlabs-rss-datasource', 'volkovlabs-image-panel',
'marcusolsson-calendar-panel', 'marcusolsson-dynamictext-panel', 'marcusolsson-static-datasource',
'volkovlabs-grapi-datasource', 'volkovlabs-variable-panel', 'volkovlabs-table-panel')
group by 1, 3
order by 1 asc;
Open issues over time panel
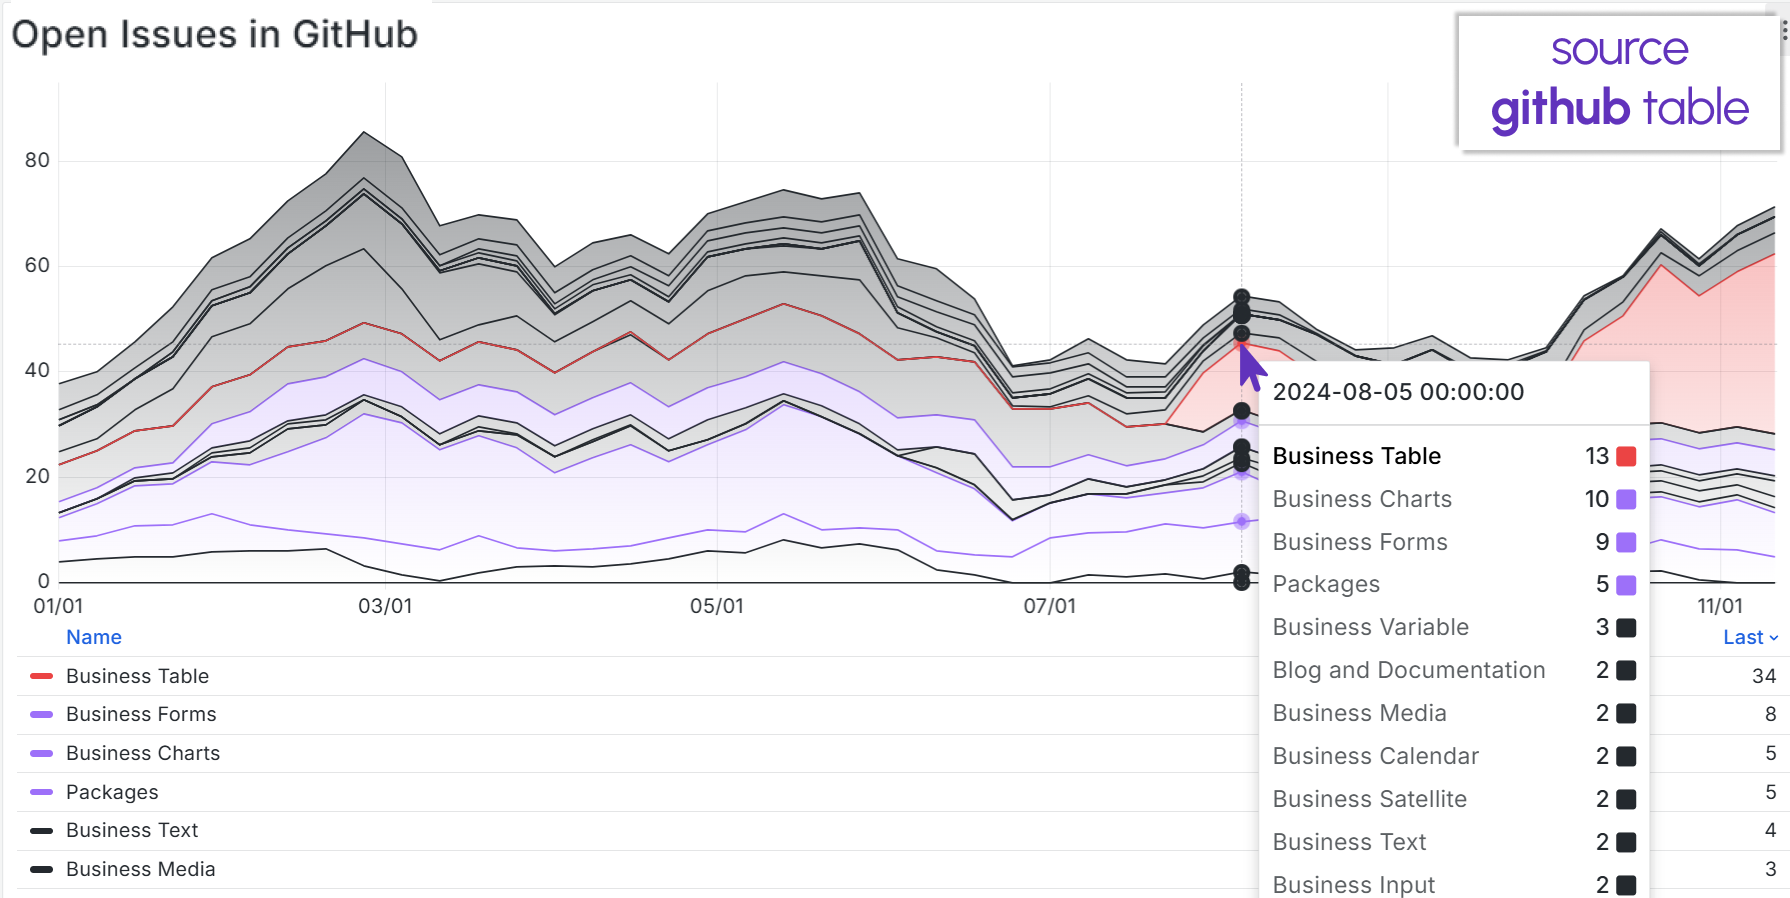
This panel accompanies the open issues snapshot, allowing for deeper community interest analysis.
Below is the Open issues over time panel configuration.
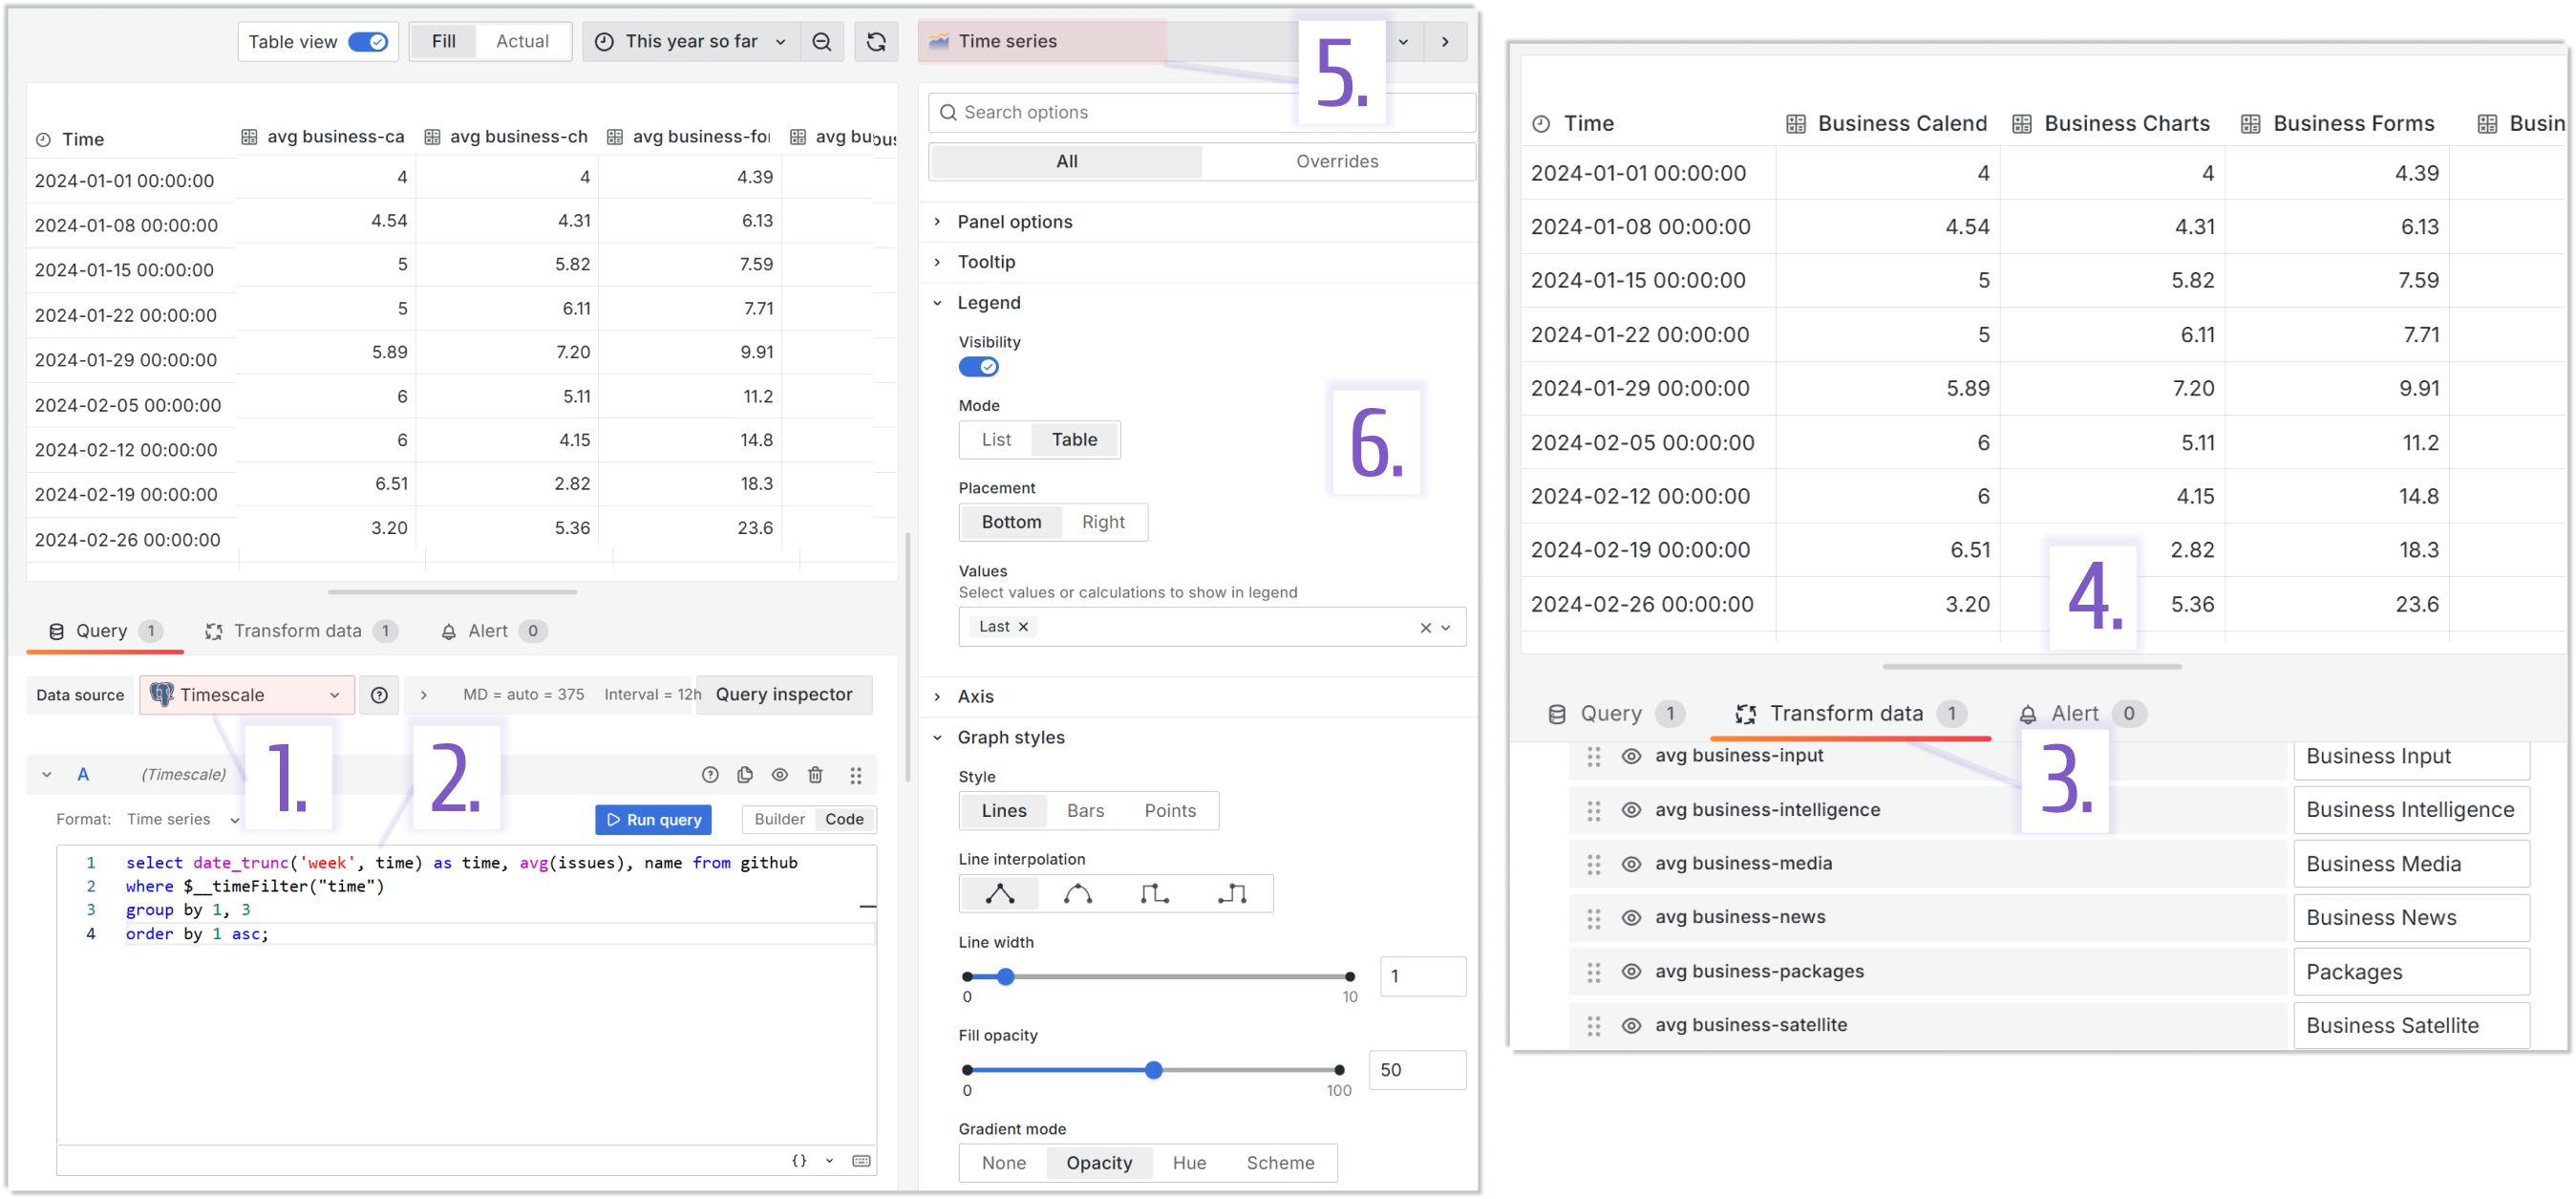
| Step | Open issues over time panel configuration |
|---|---|
| 1. Data source selection | Timescale |
| 2. Specify query | The panel runs one SQL query in the Time series format, which returns a date and then an average number of open issues weekly |
| 3. Apply transformations | We use the Organize fields by name transformation to convert database specific product names into user-friendly names |
| 4. Extracted data review | |
| 5. Select a visualization panel from a list | Time series |
| 6. Configure panel properties | Use the panel parameter to configure the appearance |
- Query A:
select date_trunc('week', time) as time, avg(issues), name from github
where $__timeFilter("time")
group by 1, 3
order by 1 asc;
Release Calendar panel
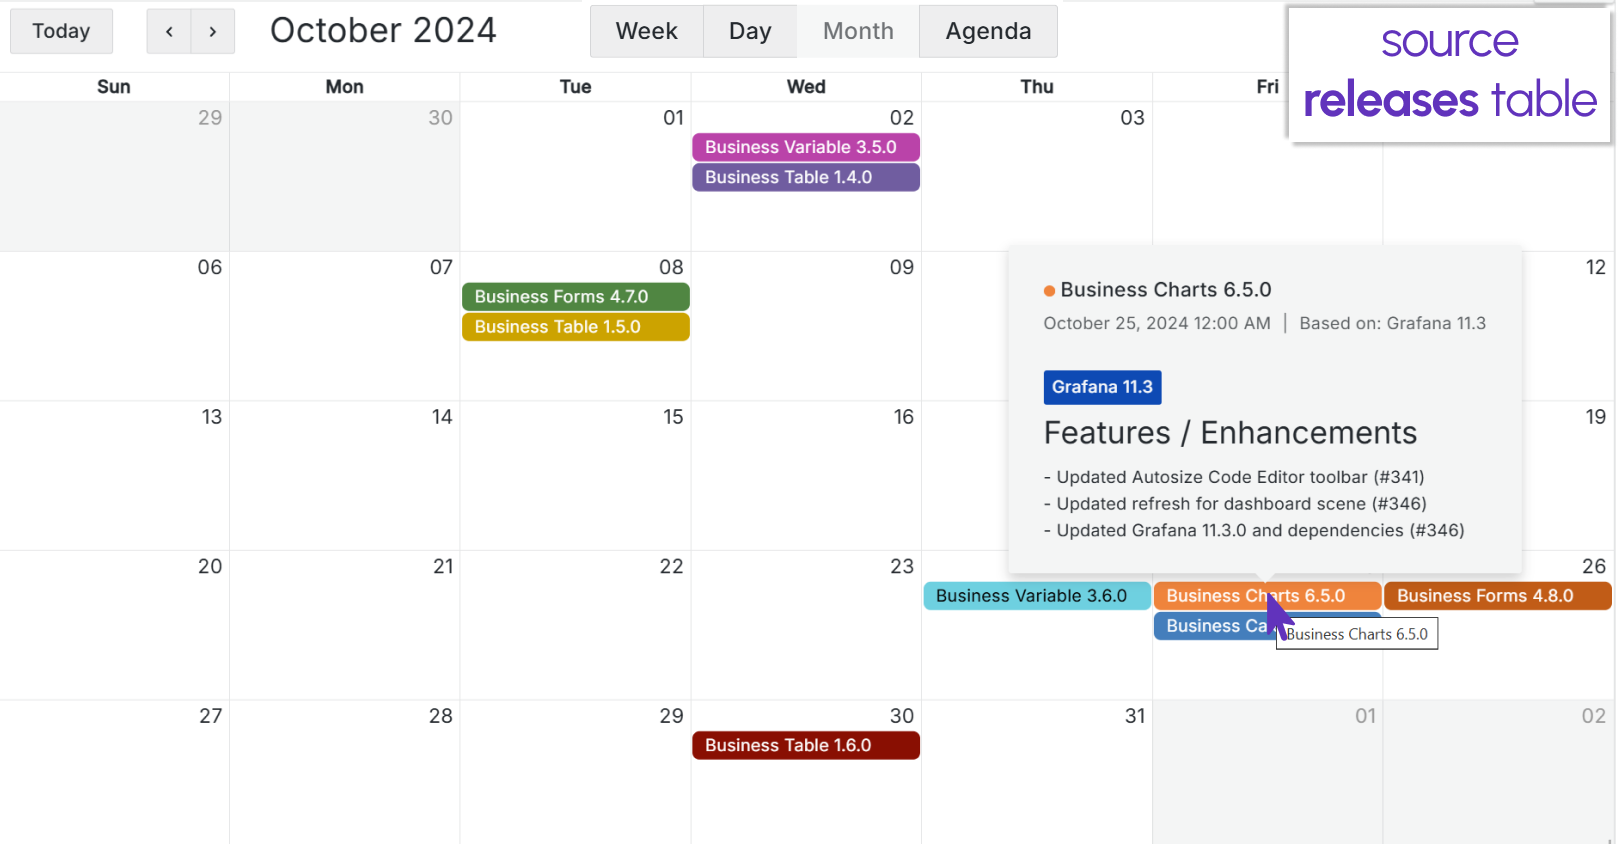
On this panel, releases have been published in the calendar format. When a mouse hovers over a plugin name, you can see the release details in HTML format.
Below is the Release Calendar panel configuration.
| Step | Release Calendar panel configuration |
|---|---|
| 1. Data source selection | Timescale |
| 2. Specify query | The panel runs one SQL query, which returns all data elements necessary to display an informative calendar |
| 3. Apply transformations | No transformation needed |
| 4. Extracted data review | |
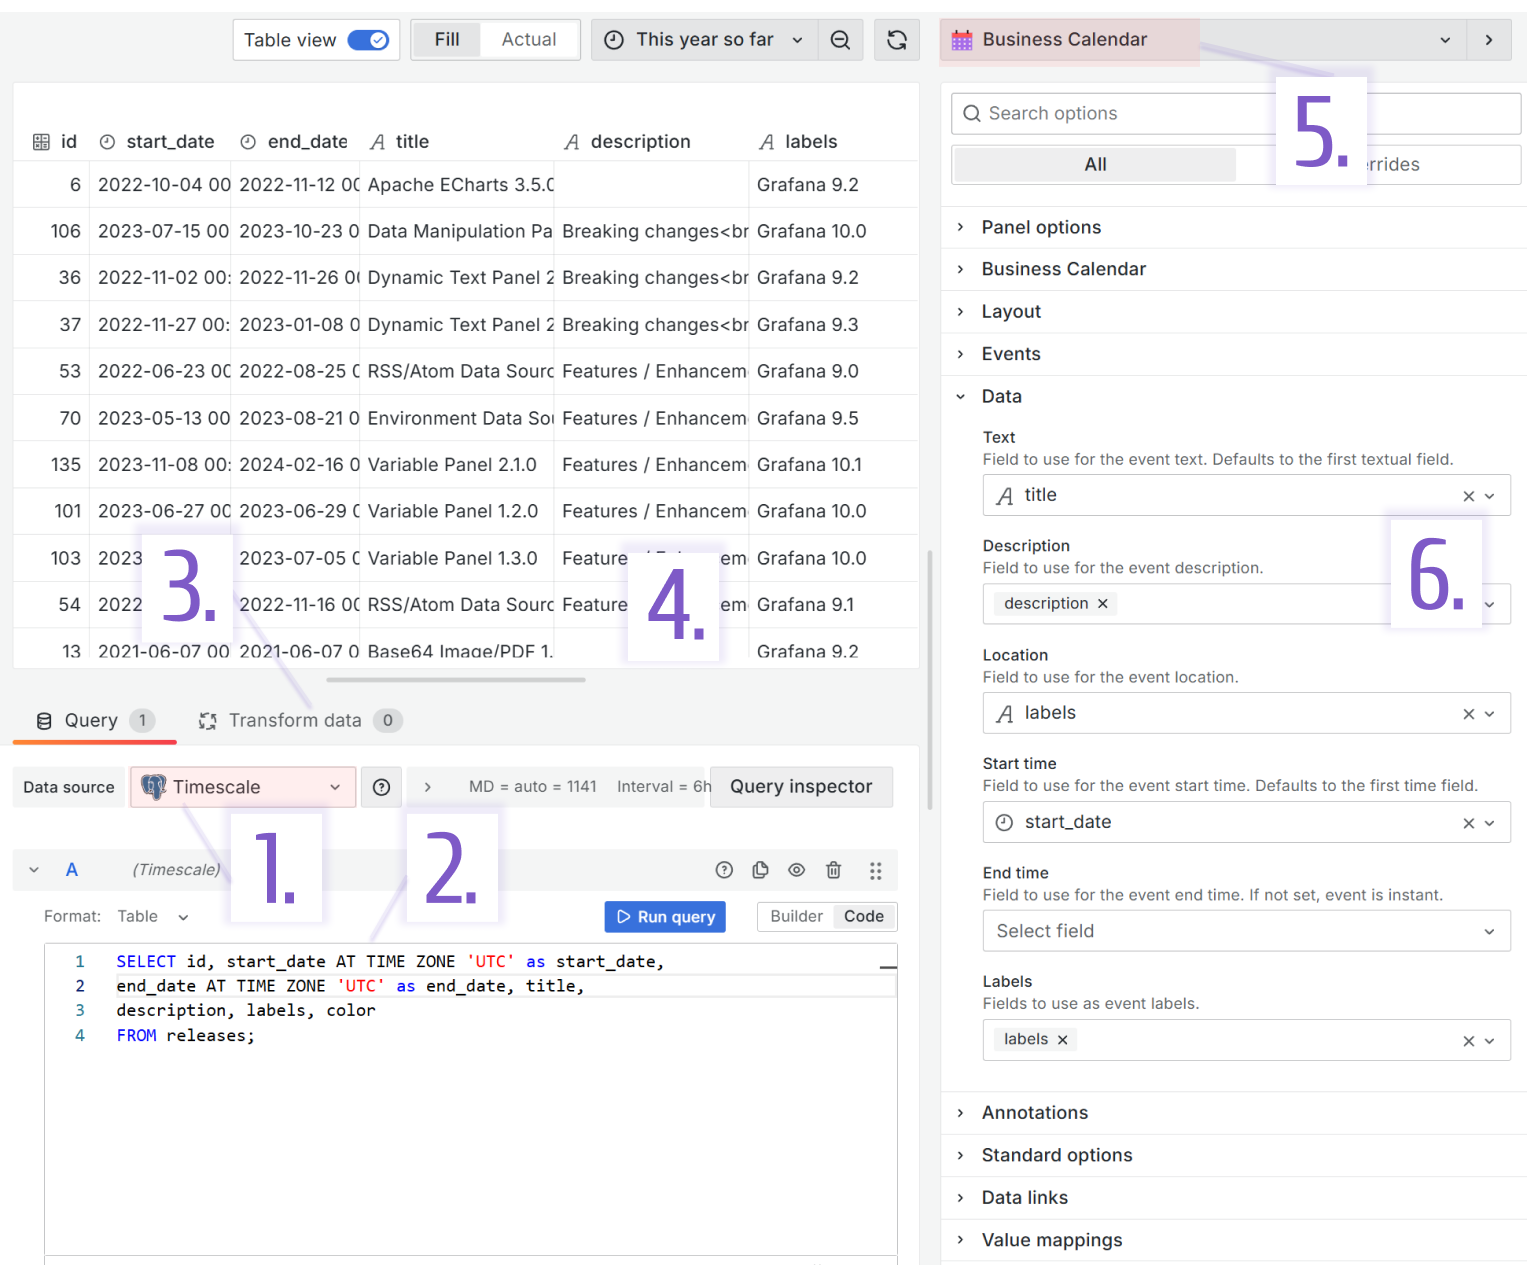
| 5. Select a visualization panel from a list | Business Calendar |
| 6. Configure panel properties | Use the Data parameter category to map data frame columns with the Business Calendar data elements |
- Query A:
SELECT id, start_date AT TIME ZONE 'UTC' as start_date,
end_date AT TIME ZONE 'UTC' as end_date, title,
description, labels, color
FROM releases;
Release Entry form
The Business Forms provides unique functionality, allowing users to directly interact with the database by entering/editing/deleting data from it.
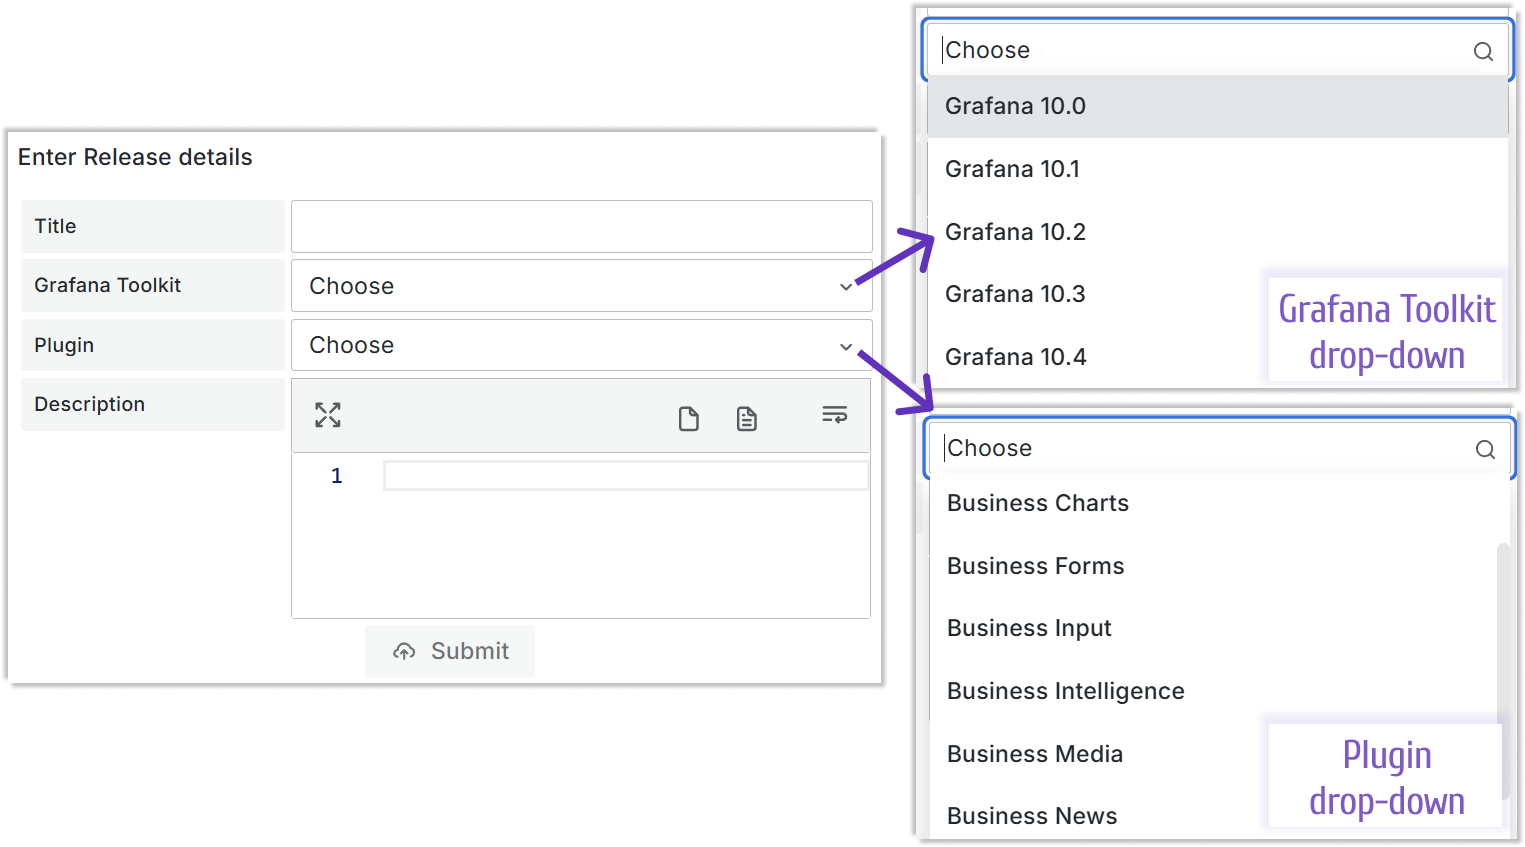
The configuration of this panel could fit into the steps described above for any other visualization panel. Still, there is much to the panel parameter configuration where you specify JavaScript to define the Business Forms component's behavior. So, here it goes:
| Step | Release Business Forms configuration |
|---|---|
| 1. Data source selection | Timescale. This data source is used to retrieve the data to populate the two drop-downs on the form (Grafana Toolkit with Grafana 10.0, Grafana 10.1, etc. and Plugin with Business Charts, Business Forms, etc. |
| 2. Specify query | The panel runs two SQL queries. One fetches the listing of all supported Grafana versions (Grafana Toolkit) and the second one fetches the plugin name listing (Plugin) |
| 3. Apply transformations | No transformation needed |
| 4. Extracted data review | |
| 5. Select a visualization panel from a list | Business Forms |
| 6. Configure panel properties | See the description of parameter configuration below |
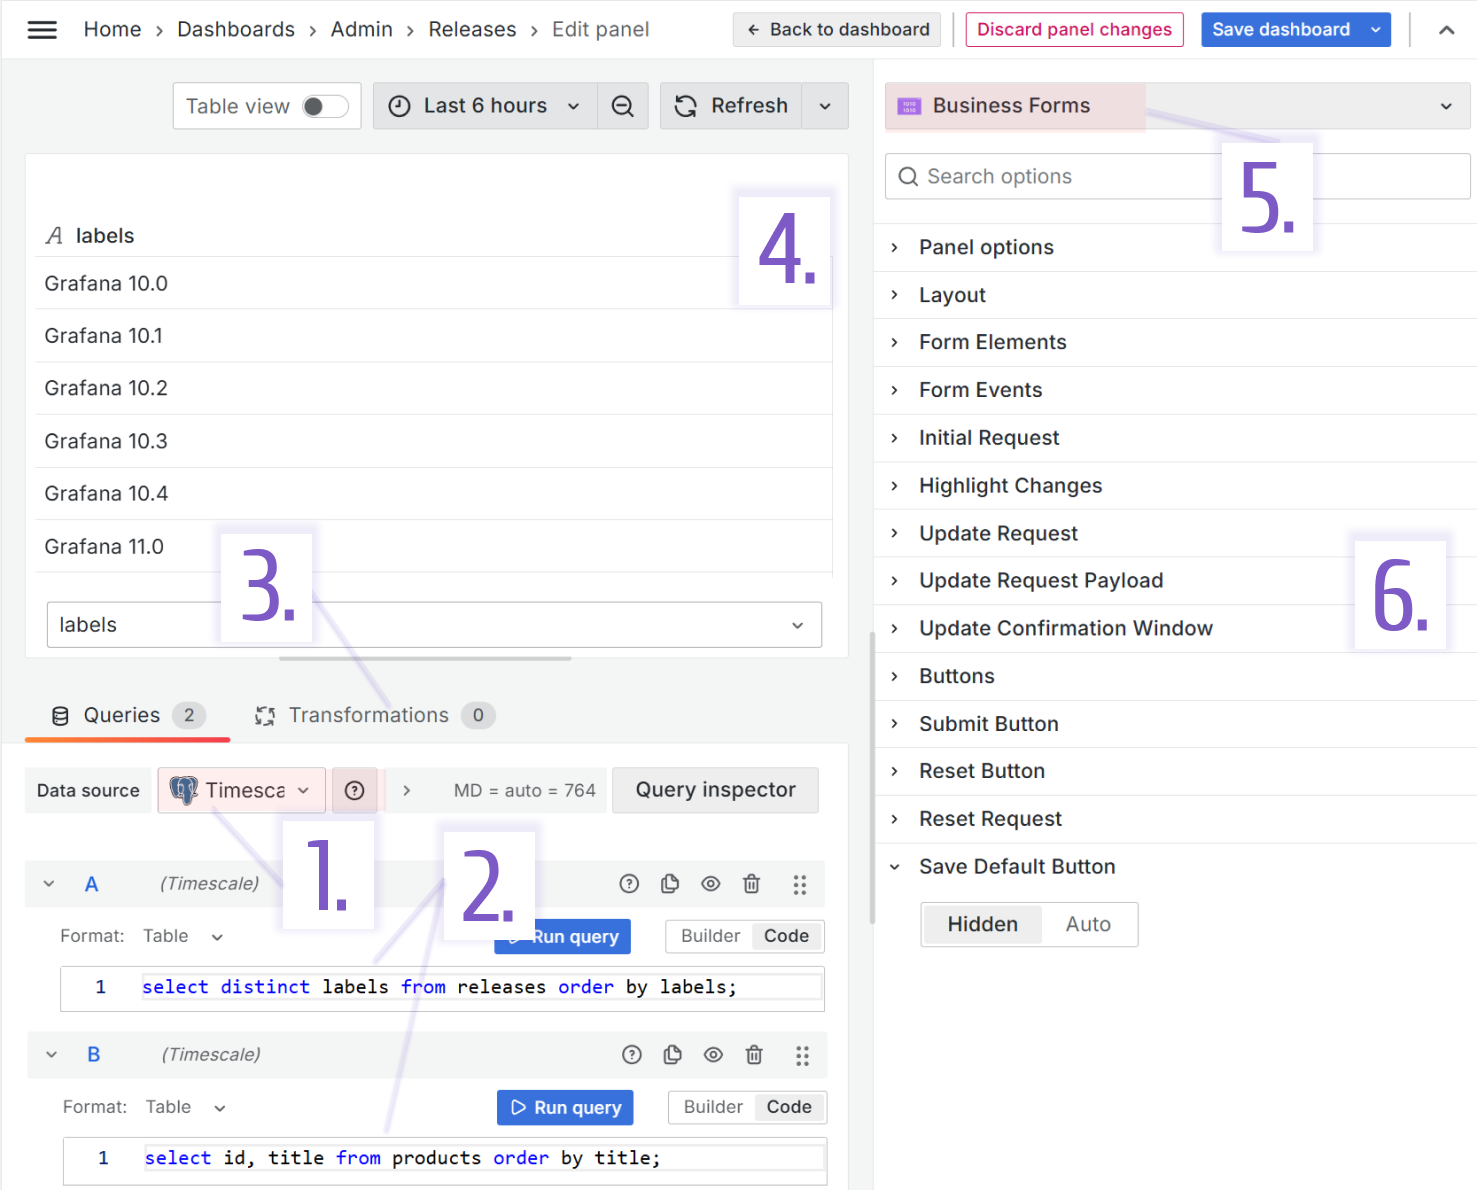
- Query A (to provide data for the Grafana Toolkit drop-down):
SELECT distinct labels
FROM releases
ORDER BY labels;
- Query B (to provide data for the Plugin drop-down):
SELECT id, title
FROM products
ORDER BY title;
The products table is the table containing information about all Volkov Labs products.
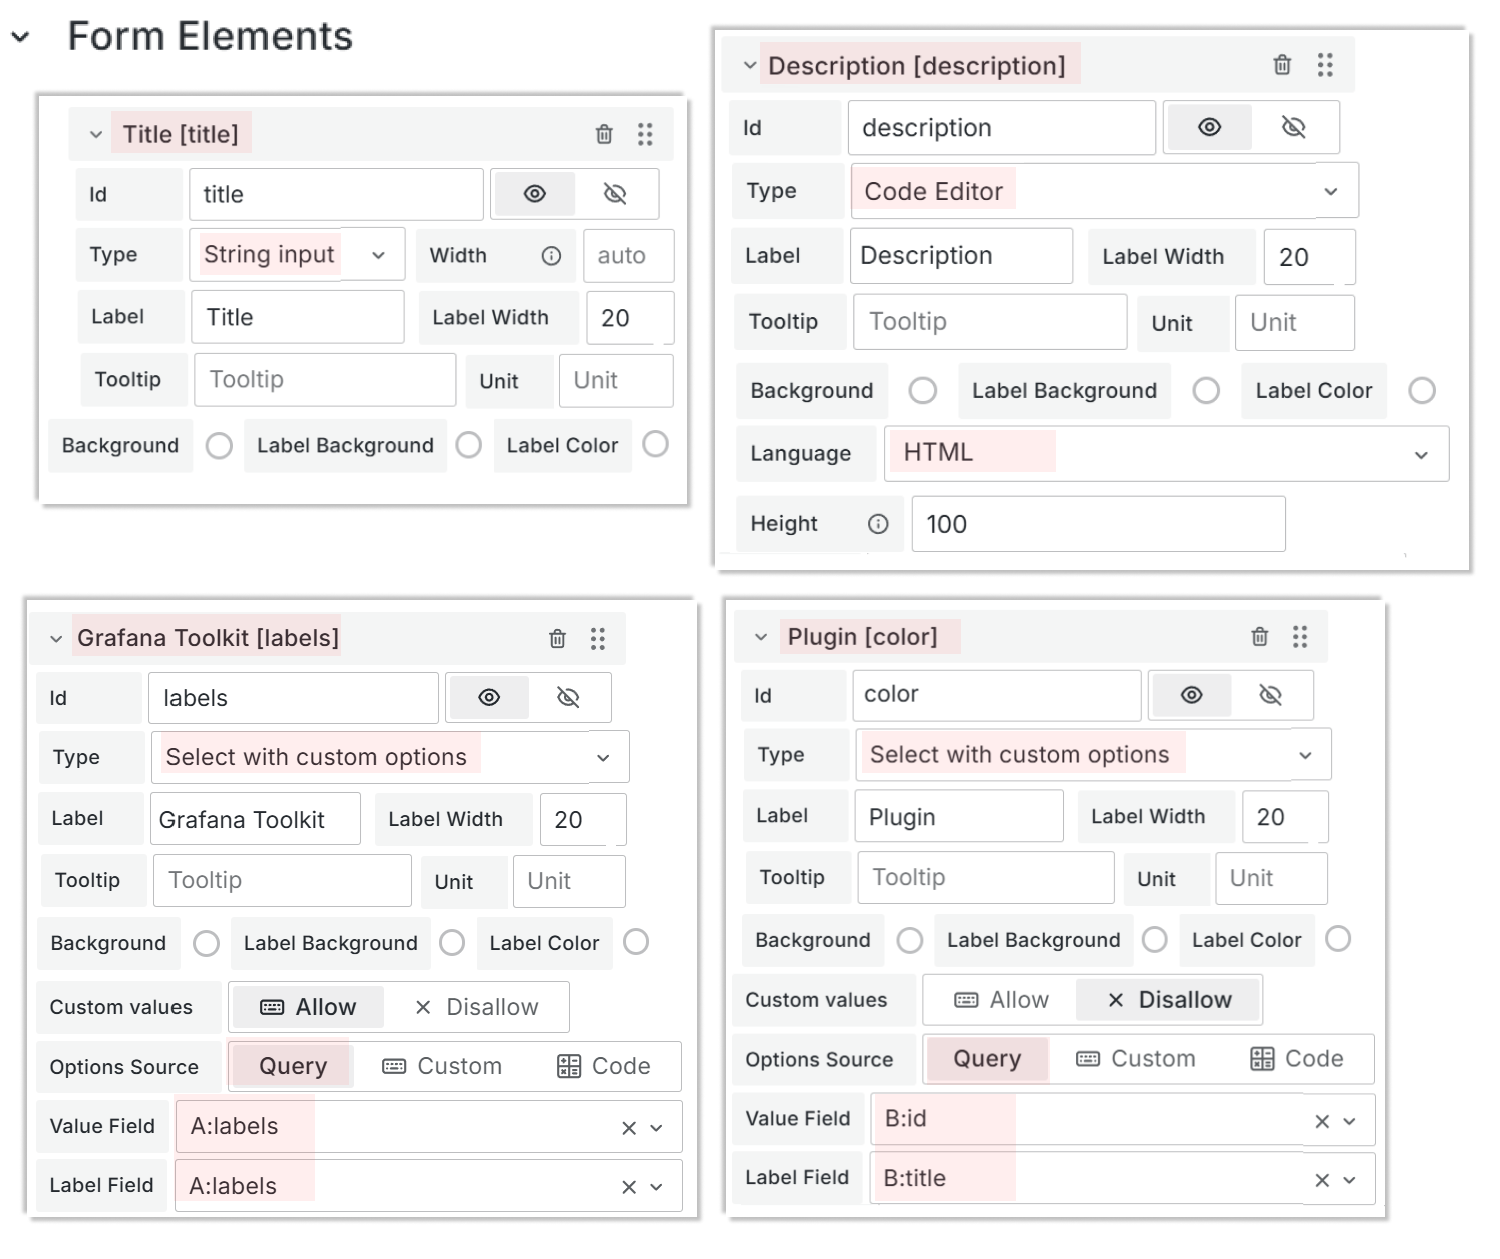
Form elements
- Title. Type->String Input. The rest is the default.
- Grafana Toolkit.
- Type->Select with Custom options.
- Then specify how these options should be populated Option source->Query, which means they are from the specified queries on the left.
- Further, clarify which data frame columns. Value Field->A:labels and Label field->A:labels
- The rest is the default.
- Description.
- Type->Code Editor.
- To clarify the formatting rules Language->HTML.
- The rest is the default.
- Plugin.
- Type->Select with Custom options.
- Then specify how these options should be populated Option source->Query, which means they are from the specified queries on the left.
- Further, clarify which data frame columns. Value Field->B:id and Label field->B:title
- The rest is the default.
Initial request
There is nothing to execute on the form initiation. We keep the default settings for the Initial Request parameter.
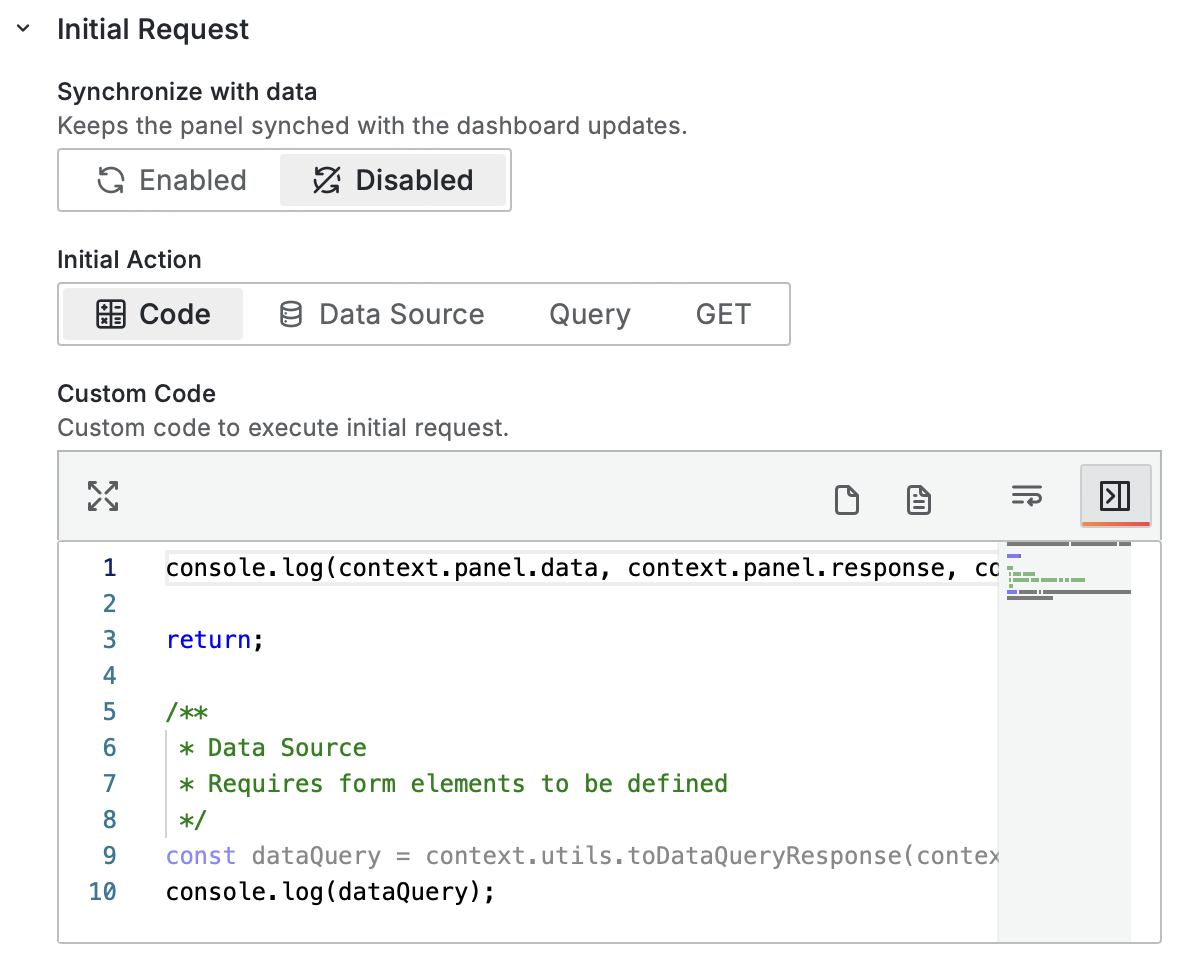
This code appears by default, there should not be a need for you to copy it.
console.log(context.panel.data, context.panel.response, context.panel.initial, context.panel.elements);

return;

/**
 * Data Source
 * Requires form elements to be defined
 */
const dataQuery = context.utils.toDataQueryResponse(context.panel.response);
console.log(dataQuery);
Update Request
When user makes changes on the form (Enable Update is set to If Changed), the data should go into the Update Action->Data Source->Timescale.
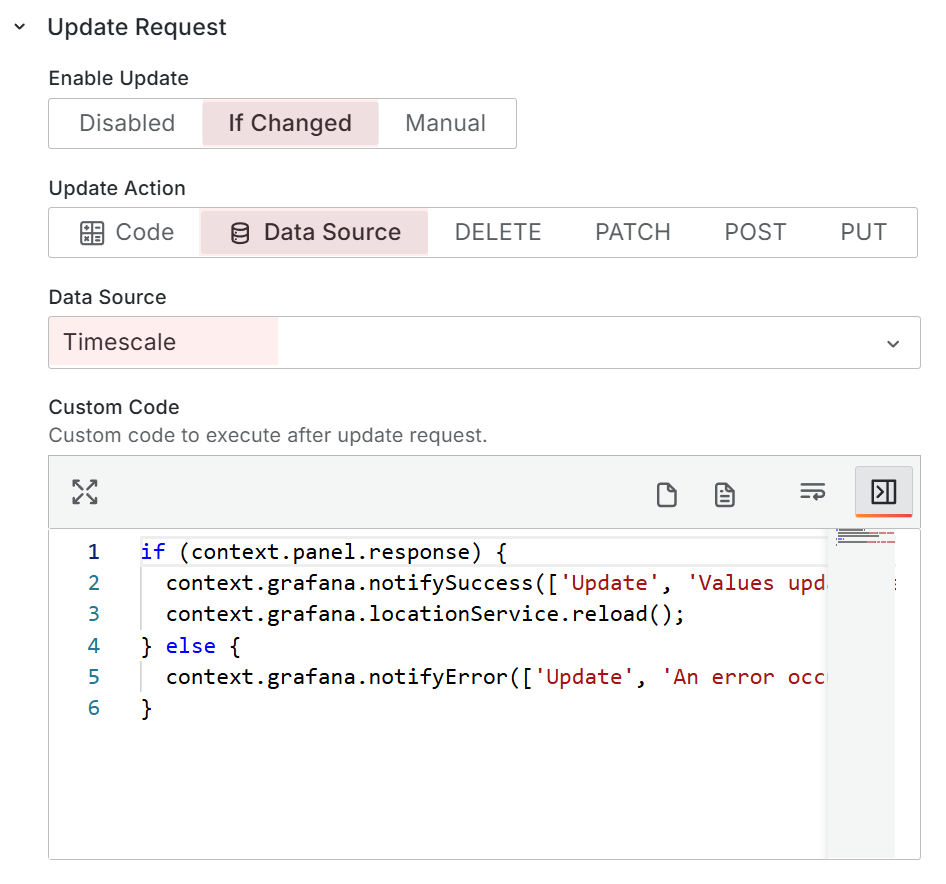
The Custom Code is left with the default configuration.
if (context.panel.response) {
  context.grafana.notifySuccess(['Update', 'Values updated successfully.']);
  context.grafana.locationService.reload();
} else {
  context.grafana.notifyError(['Update', 'An error occurred updating values.']);
}
Update Request Payload
The Update Request Payload parameter becomes available when the Update Request->Update Action->Data Source is selected.
The query is specified in the Code mode (not Builder) which allows to enter the appropriate language to interact with the selected data source (SQL in this example).
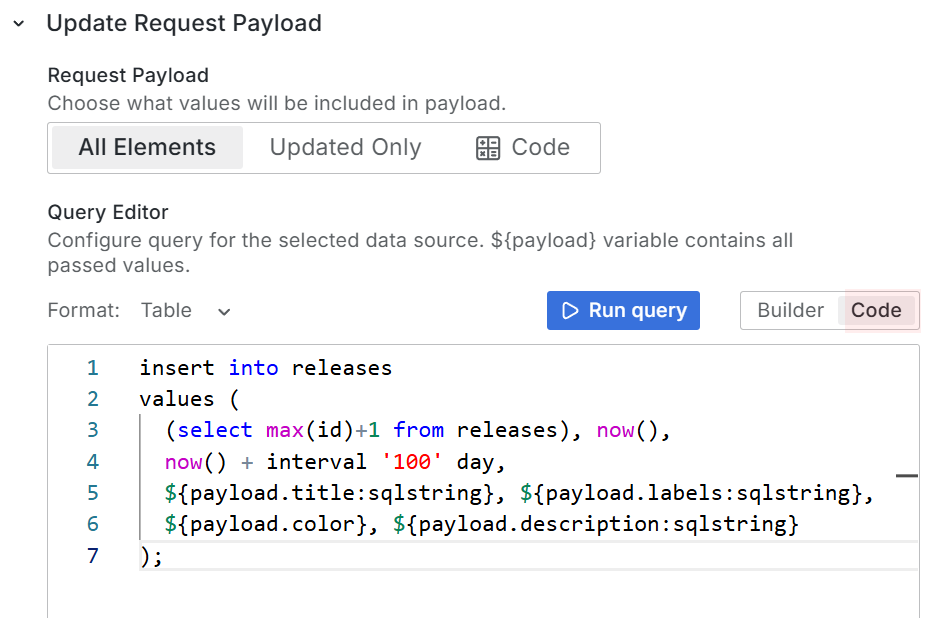
INSERT INTO releases
VALUES (
  (SELECT max(id)+1 FROM releases), NOW(), NOW() + interval '100' day,
  ${payload.title:sqlstring}, ${payload.labels:sqlstring},
  ${payload.color}, ${payload.description:sqlstring}
  );
To sum up
This article explained how we created the Release dashboard, an excellent example of using Grafana for Business purposes. The beautiful and story-telling visualizations are complemented with a data entry form (possible with the Business Form panel), the tool allowing direct user interaction with the data source.
You can learn more about the Business Forms panel in the tutorials section of our documentation.


