GeoJSON
The Business Charts panel supports the world and USA GeoJSON maps. You can load additional maps dynamically.
Demo
Try the map on the dashboard in the edit mode.
Tutorial
You can watch the following video to better understand how to use GeoJSON maps.
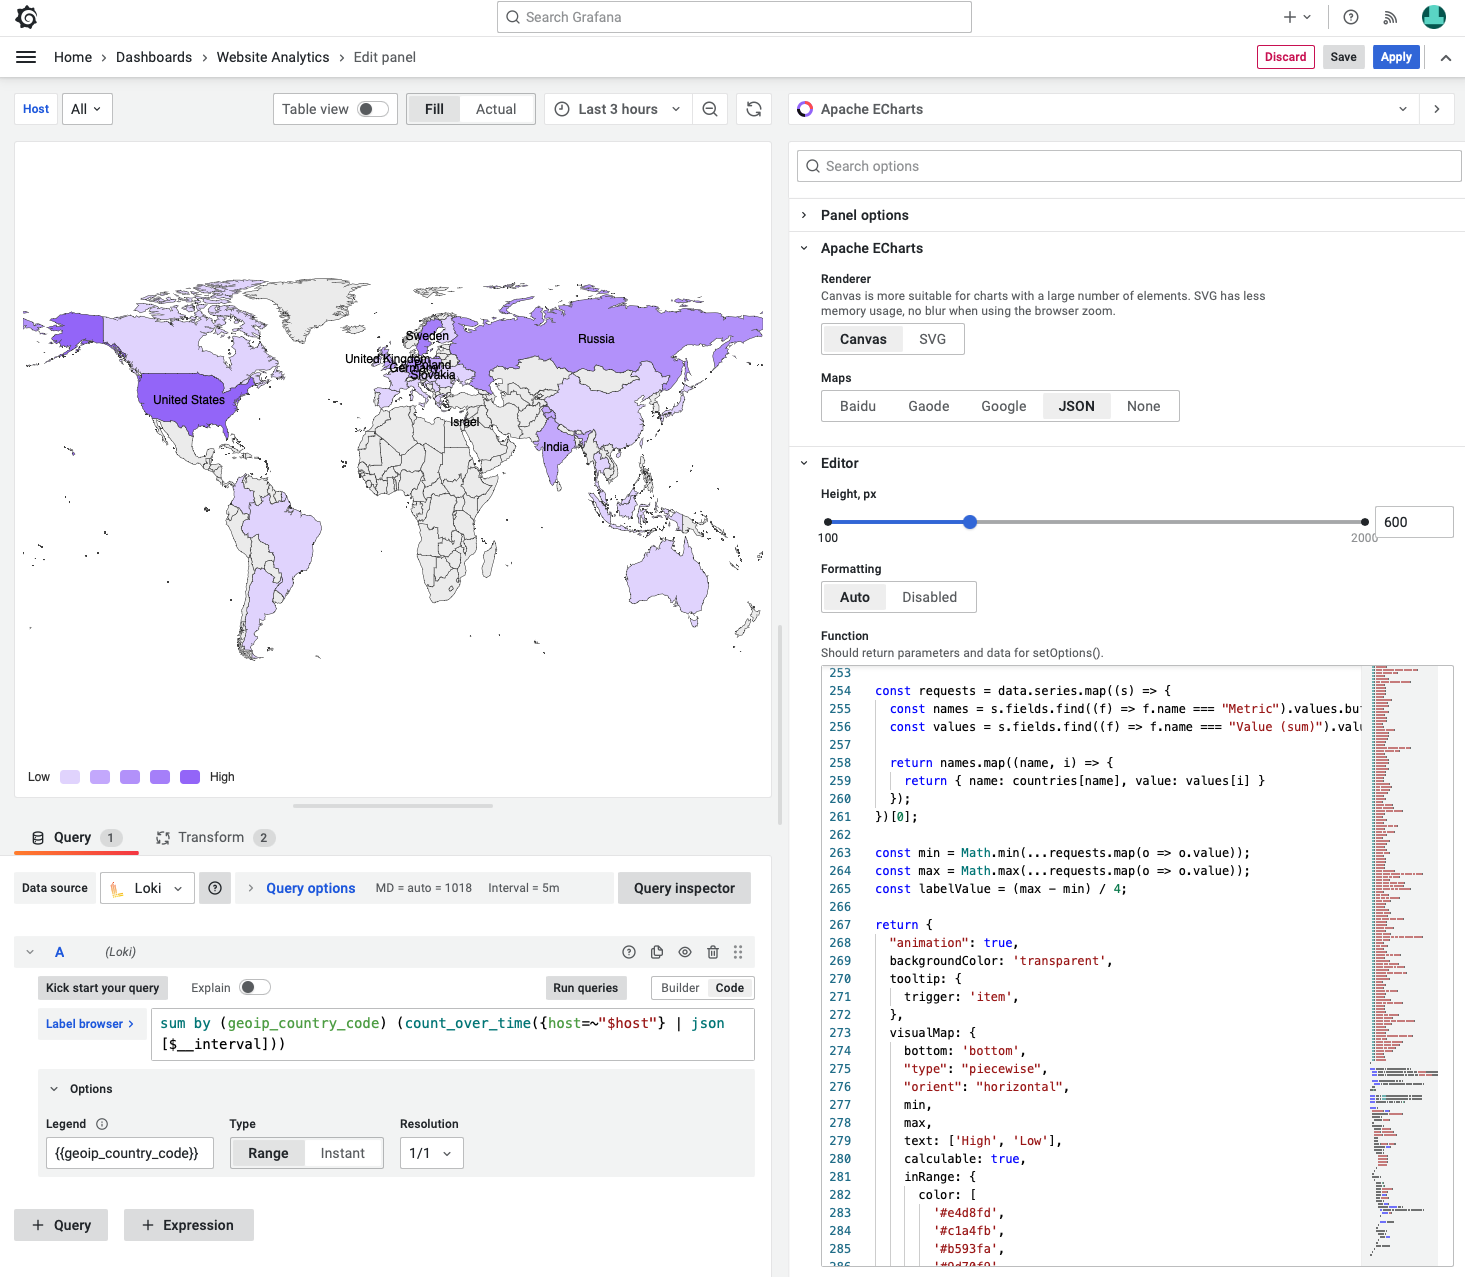
Metrics with values
const requests = context.panel.data.series.map((s) => {
  const names = s.fields.find((f) => f.name === "Metric").values;
  const values = s.fields.find((f) => f.name === "Value (sum)").values;

  return names.map((name, i) => {
    return { name: name, value: values[i] };
  });
})[0];

const min = Math.min(...requests.map((o) => o.value));
const max = Math.max(...requests.map((o) => o.value));
const labelValue = (max - min) / 4;

return {
  animation: true,
  backgroundColor: "transparent",
  tooltip: {
    trigger: "item",
  },
  visualMap: {
    bottom: "bottom",
    type: "piecewise",
    orient: "horizontal",
    min,
    max,
    text: ["High", "Low"],
    calculable: true,
    inRange: {
      color: ["#e4d8fd", "#c1a4fb", "#b593fa", "#9d70f9"],
    },
  },
  series: [
    {
      left: 0,
      right: 0,
      name: "Requests",
      type: "map",
      roam: true,
      map: "world",
      label: {
        show: true,
        formatter: function (d) {
          if (!d.data || d.data.value <= labelValue) {
            return "";
          }

          return d.name;
        },
      },
      emphasis: {
        label: {
          show: true,
        },
      },
      data: requests,
    },
  ],
};
Connected data points
The Business Charts panel can visualize connected data points retrieved from a data source on a GeoJSON map.
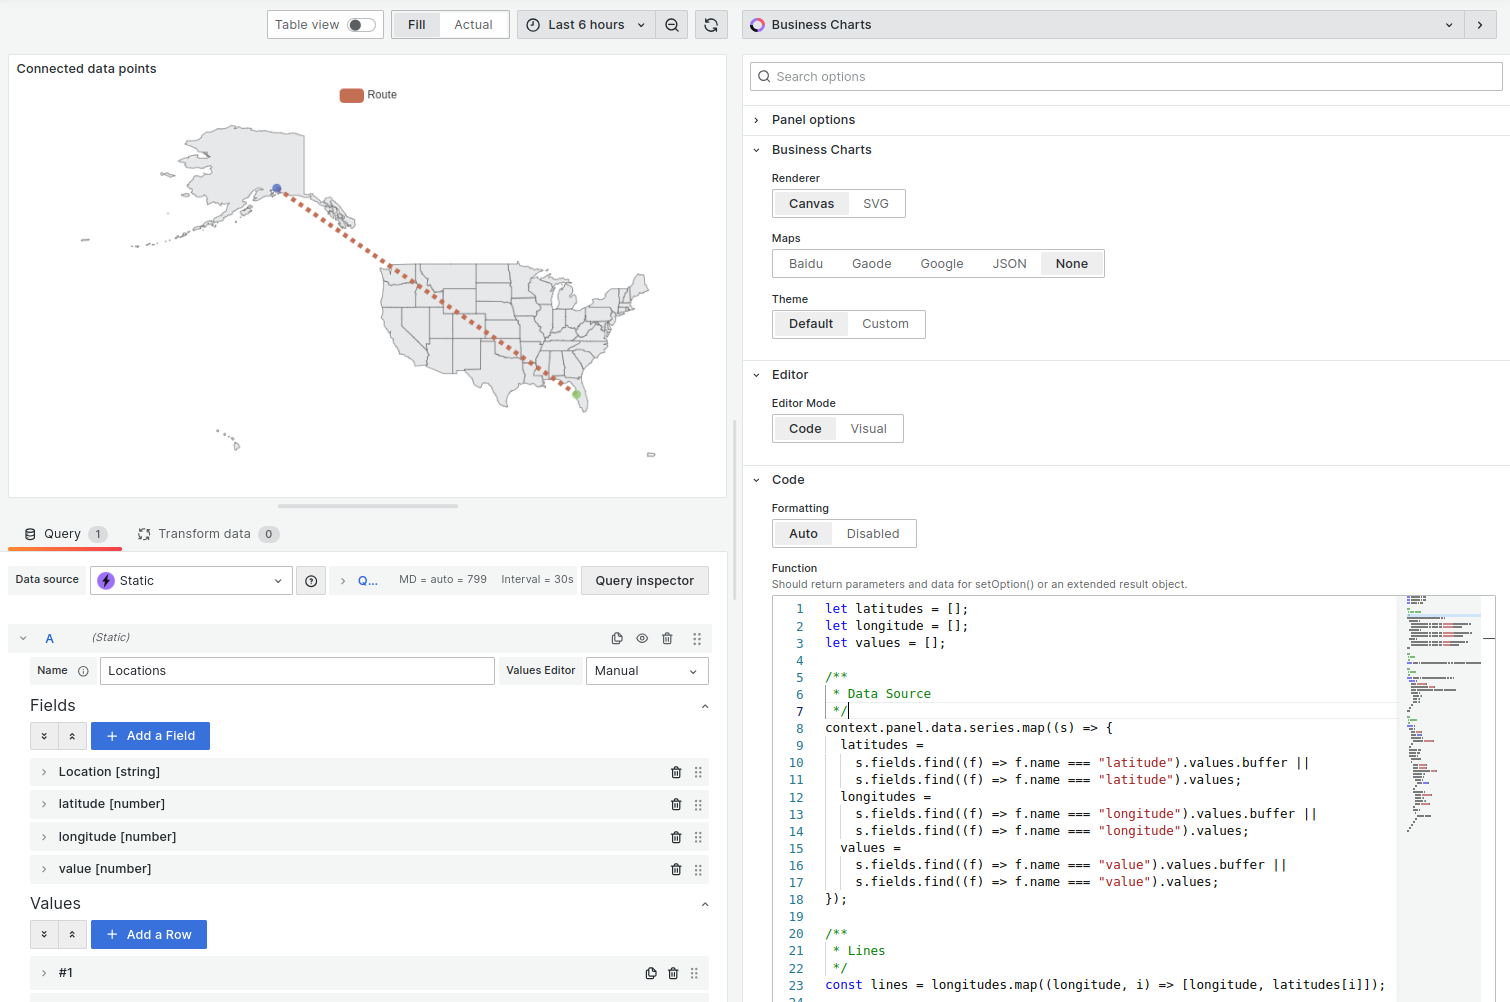
let latitudes = [];
let longitude = [];
let values = [];

/**
 * Data Source
 */
context.panel.data.series.map((s) => {
  latitudes = s.fields.find((f) => f.name === "latitude").values;
  longitudes = s.fields.find((f) => f.name === "longitude").values;
  values = s.fields.find((f) => f.name === "value").values;
});

/**
 * Lines
 */
const lines = longitudes.map((longitude, i) => [longitude, latitudes[i]]);

/**
 * Series
 */
const series = latitudes.map((latitude, i) => {
  return {
    type: "scatter",
    coordinateSystem: "geo",
    data: [[longitudes[i], latitude, values[i]]],
    encode: {
      value: 2,
      lng: 0,
      lat: 1,
    },
  };
});

/**
 * ECharts
 */
return {
  geo: {
    map: "USA",
    roam: true,
    itemStyle: {
      areaColor: "#e7e8ea",
    },
  },
  tooltip: {},
  legend: {},
  series: [
    ...series,
    {
      name: "Route",
      type: "lines",
      coordinateSystem: "geo",
      geoIndex: 0,
      emphasis: {
        label: {
          show: false,
        },
      },
      lineStyle: {
        color: "#c46e54",
        width: 5,
        opacity: 1,
        type: "dotted",
      },
      data: [
        {
          coords: lines,
        },
      ],
    },
  ],
};
Dynamic maps loading
You can load additional GeoJSON maps dynamically from data source:
- Set as a String field using Business Input data source.
- Fetched from external URL using Infinity or JSON data sources.
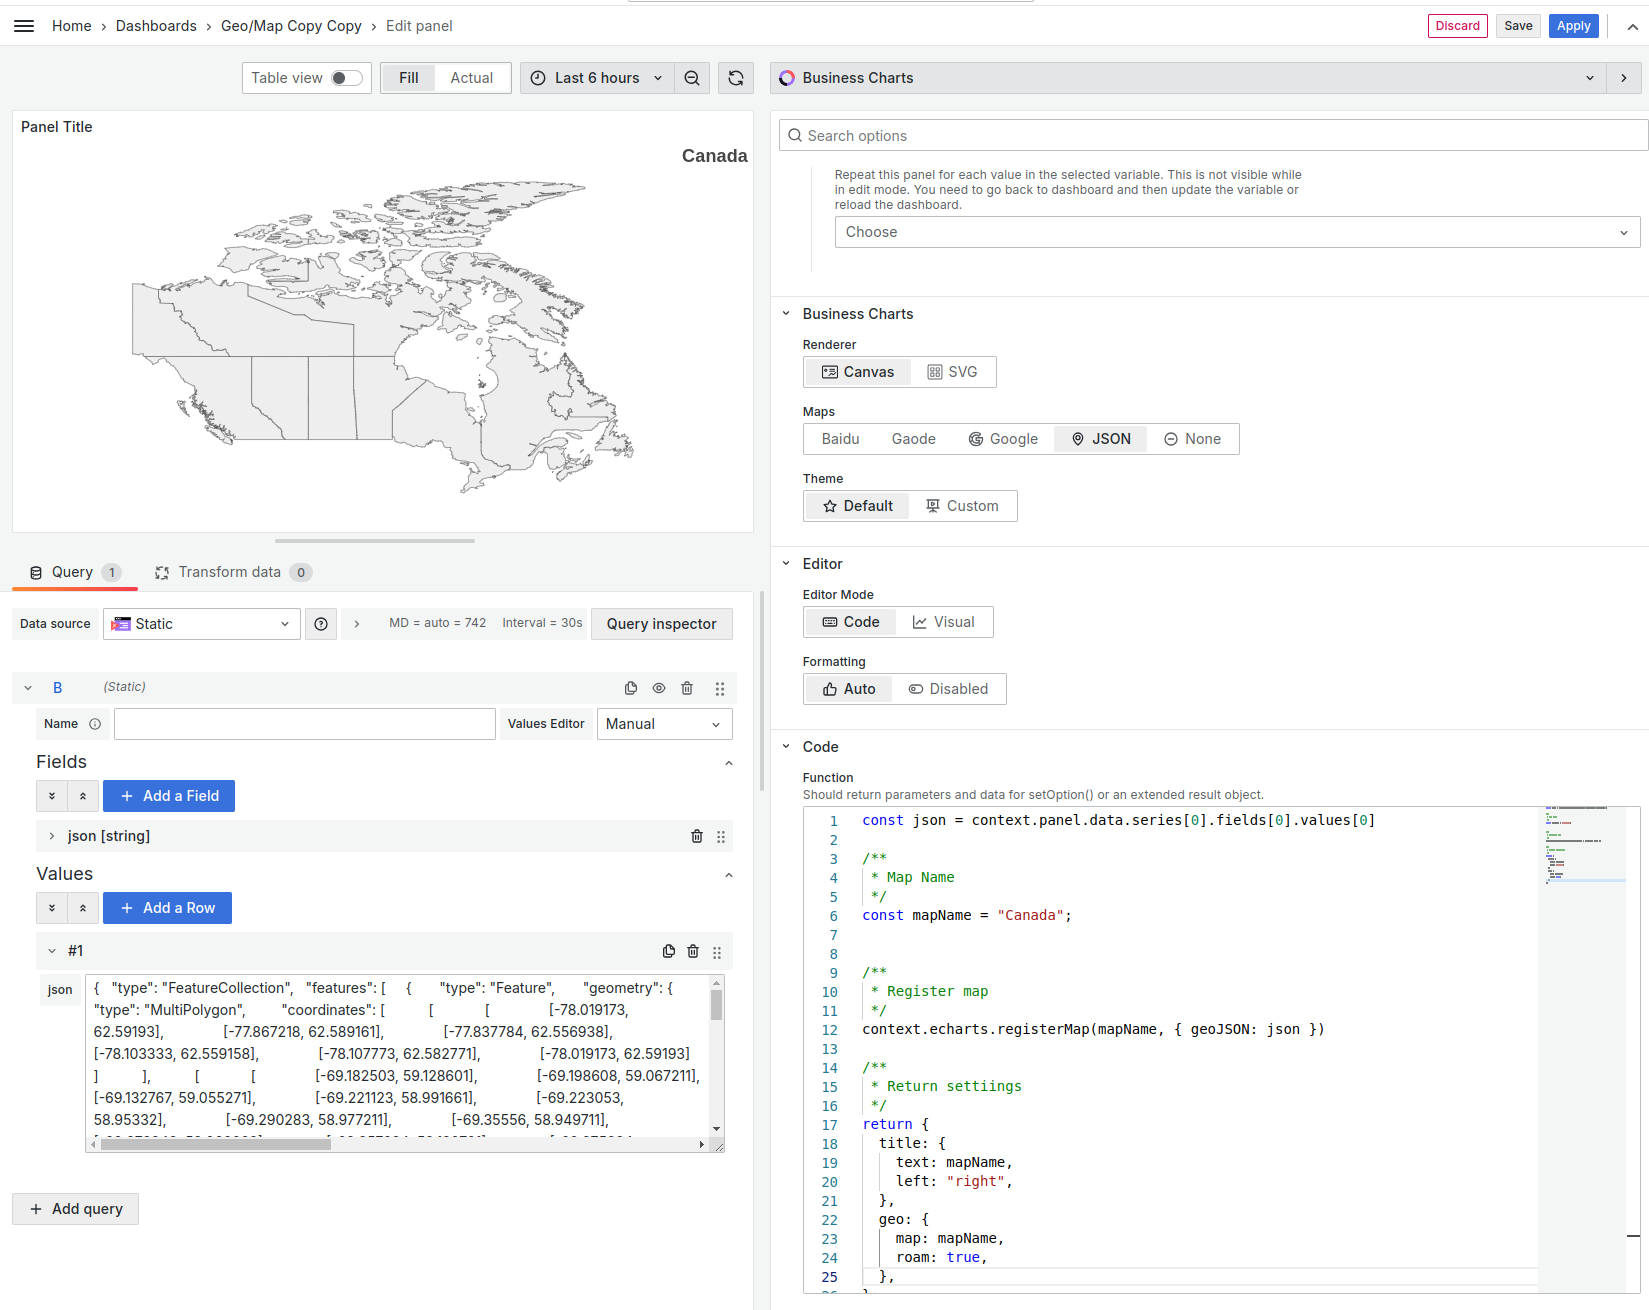
JSON for Canada used in the example can be found here.
const json = context.panel.data.series[0].fields[0].values[0];

/**
 * Map Name
 */
const mapName = "Canada";

/**
 * Register map
 */
context.echarts.registerMap(mapName, { geoJSON: json });

/**
 * Return settiings
 */
return {
  title: {
    text: mapName,
    left: "right",
  },
  geo: {
    map: mapName,
    roam: true,
  },
};
Switching between maps
The Business Charts panel allows you to switch between GeoJSON maps with on-click or double-click event handlers.
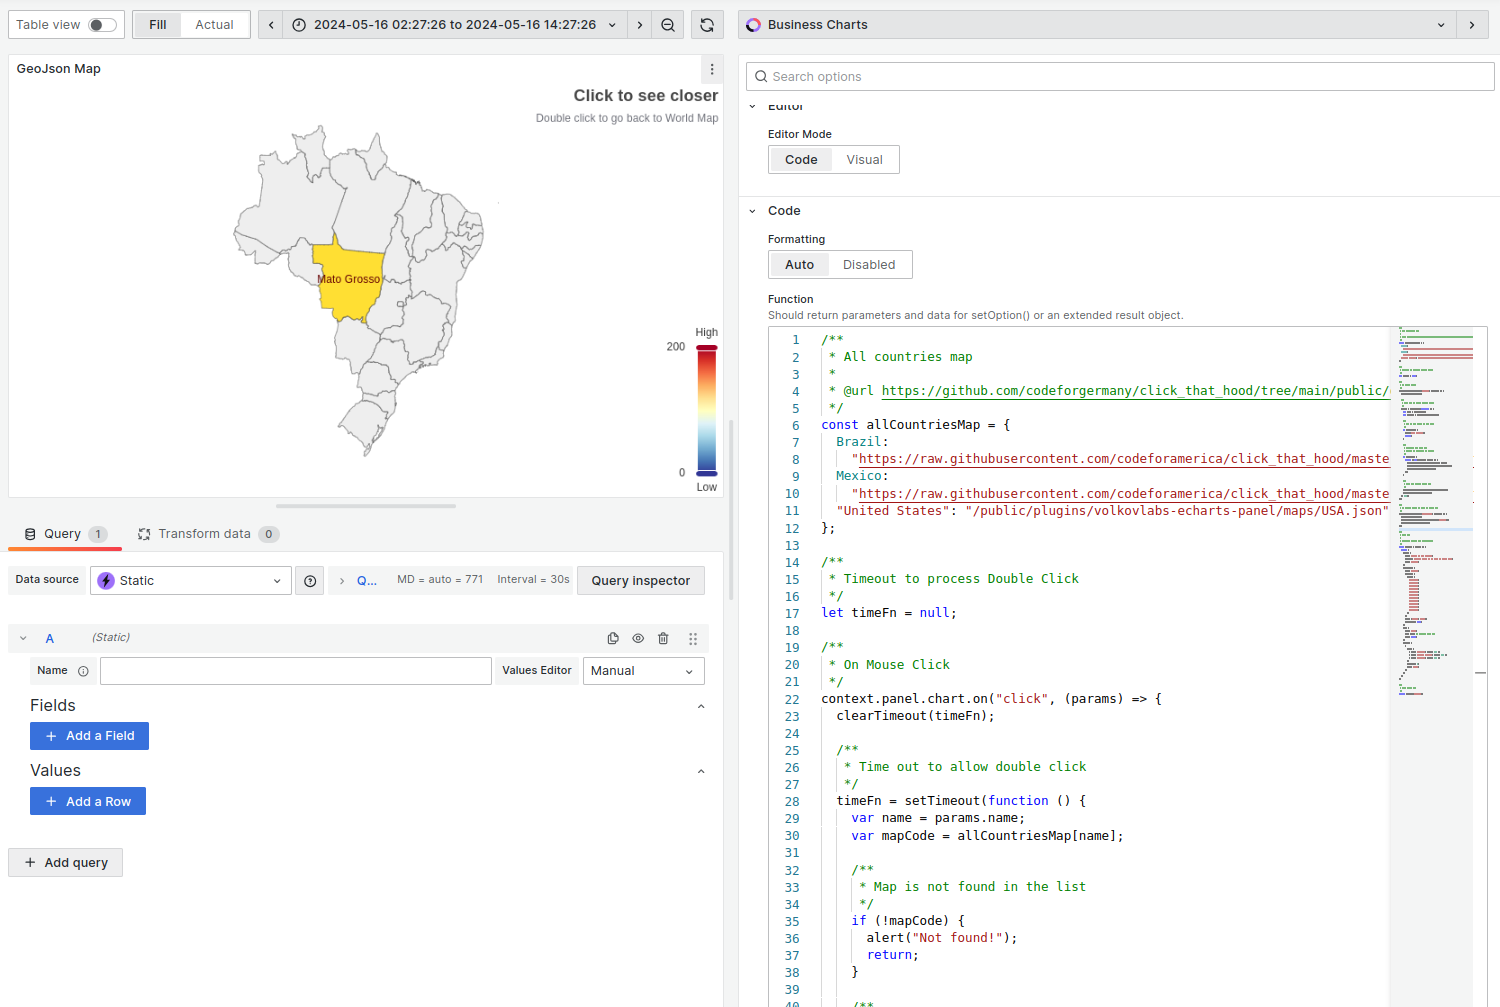
/**
 * All countries map
 *
 * @url https://github.com/codeforgermany/click_that_hood/tree/main/public/data
 */
const allCountriesMap = {
  Brazil:
    "https://raw.githubusercontent.com/codeforamerica/click_that_hood/master/public/data/brazil-states.geojson",
  Mexico:
    "https://raw.githubusercontent.com/codeforamerica/click_that_hood/master/public/data/mexico.geojson",
  "United States": "/public/plugins/volkovlabs-echarts-panel/maps/USA.json",
};

/**
 * Timeout to process Double Click
 */
let timeFn = null;

/**
 * On Mouse Click
 */
context.panel.chart.on("click", (params) => {
  clearTimeout(timeFn);

  /**
   * Time out to allow double click
   */
  timeFn = setTimeout(function () {
    var name = params.name;
    var mapCode = allCountriesMap[name];

    /**
     * Map is not found in the list
     */
    if (!mapCode) {
      alert("Not found!");
      return;
    }

    /**
     * Register and Load Map
     * Resize is required to redraw
     */
    if (mapCode) {
      return $.get(mapCode, (data) => {
        context.echarts.registerMap(name, data);
        context.panel.chart.setOption(loadMap(name));
        context.panel.chart.resize();
      });
    }

    /**
     * Load and redraw World Map
     */
    context.panel.chart.setOption(loadMap(name));
    context.panel.chart.resize();
  }, 250);
});

/**
 * On Double click go back to World Map
 */
context.panel.chart.on("dblclick", (params) => {
  clearTimeout(timeFn);
  context.panel.chart.setOption(loadMap("world"));
  context.panel.chart.resize();
});

/**
 * Load Map
 *
 * @returns object for setOption()
 */
const loadMap = (name) => {
  return {
    title: {
      text: "Click to see closer",
      subtext: "Double click to go back to World Map",
      left: "right",
    },
    visualMap: {
      left: "right",
      inRange: {
        color: [
          "#313695",
          "#4575b4",
          "#74add1",
          "#abd9e9",
          "#e0f3f8",
          "#ffffbf",
          "#fee090",
          "#fdae61",
          "#f46d43",
          "#d73027",
          "#a50026",
        ],
      },
      text: ["High", "Low"],
      calculable: true,
    },
    geo: {
      type: "map",
      map: name, // dynamic load map
      roam: false,
    },
    series: [
      {
        data: [
          { name: "Brazil", value: 100 },
          { name: "United States", value: 100 },
          { name: "Mexico", value: 100 },
        ],
        geoIndex: 0,
        type: "map",
      },
    ],
  };
};

/**
 * Load World Map
 */
return loadMap("world");