PostgreSQL
The following example demonstrates configuring a Grafana, Business Studio, and PostgreSQL cluster to work with alerts.
Grafana
Follow provided instruction to configure Time Series panel with dashboard variable.
Time Series panel
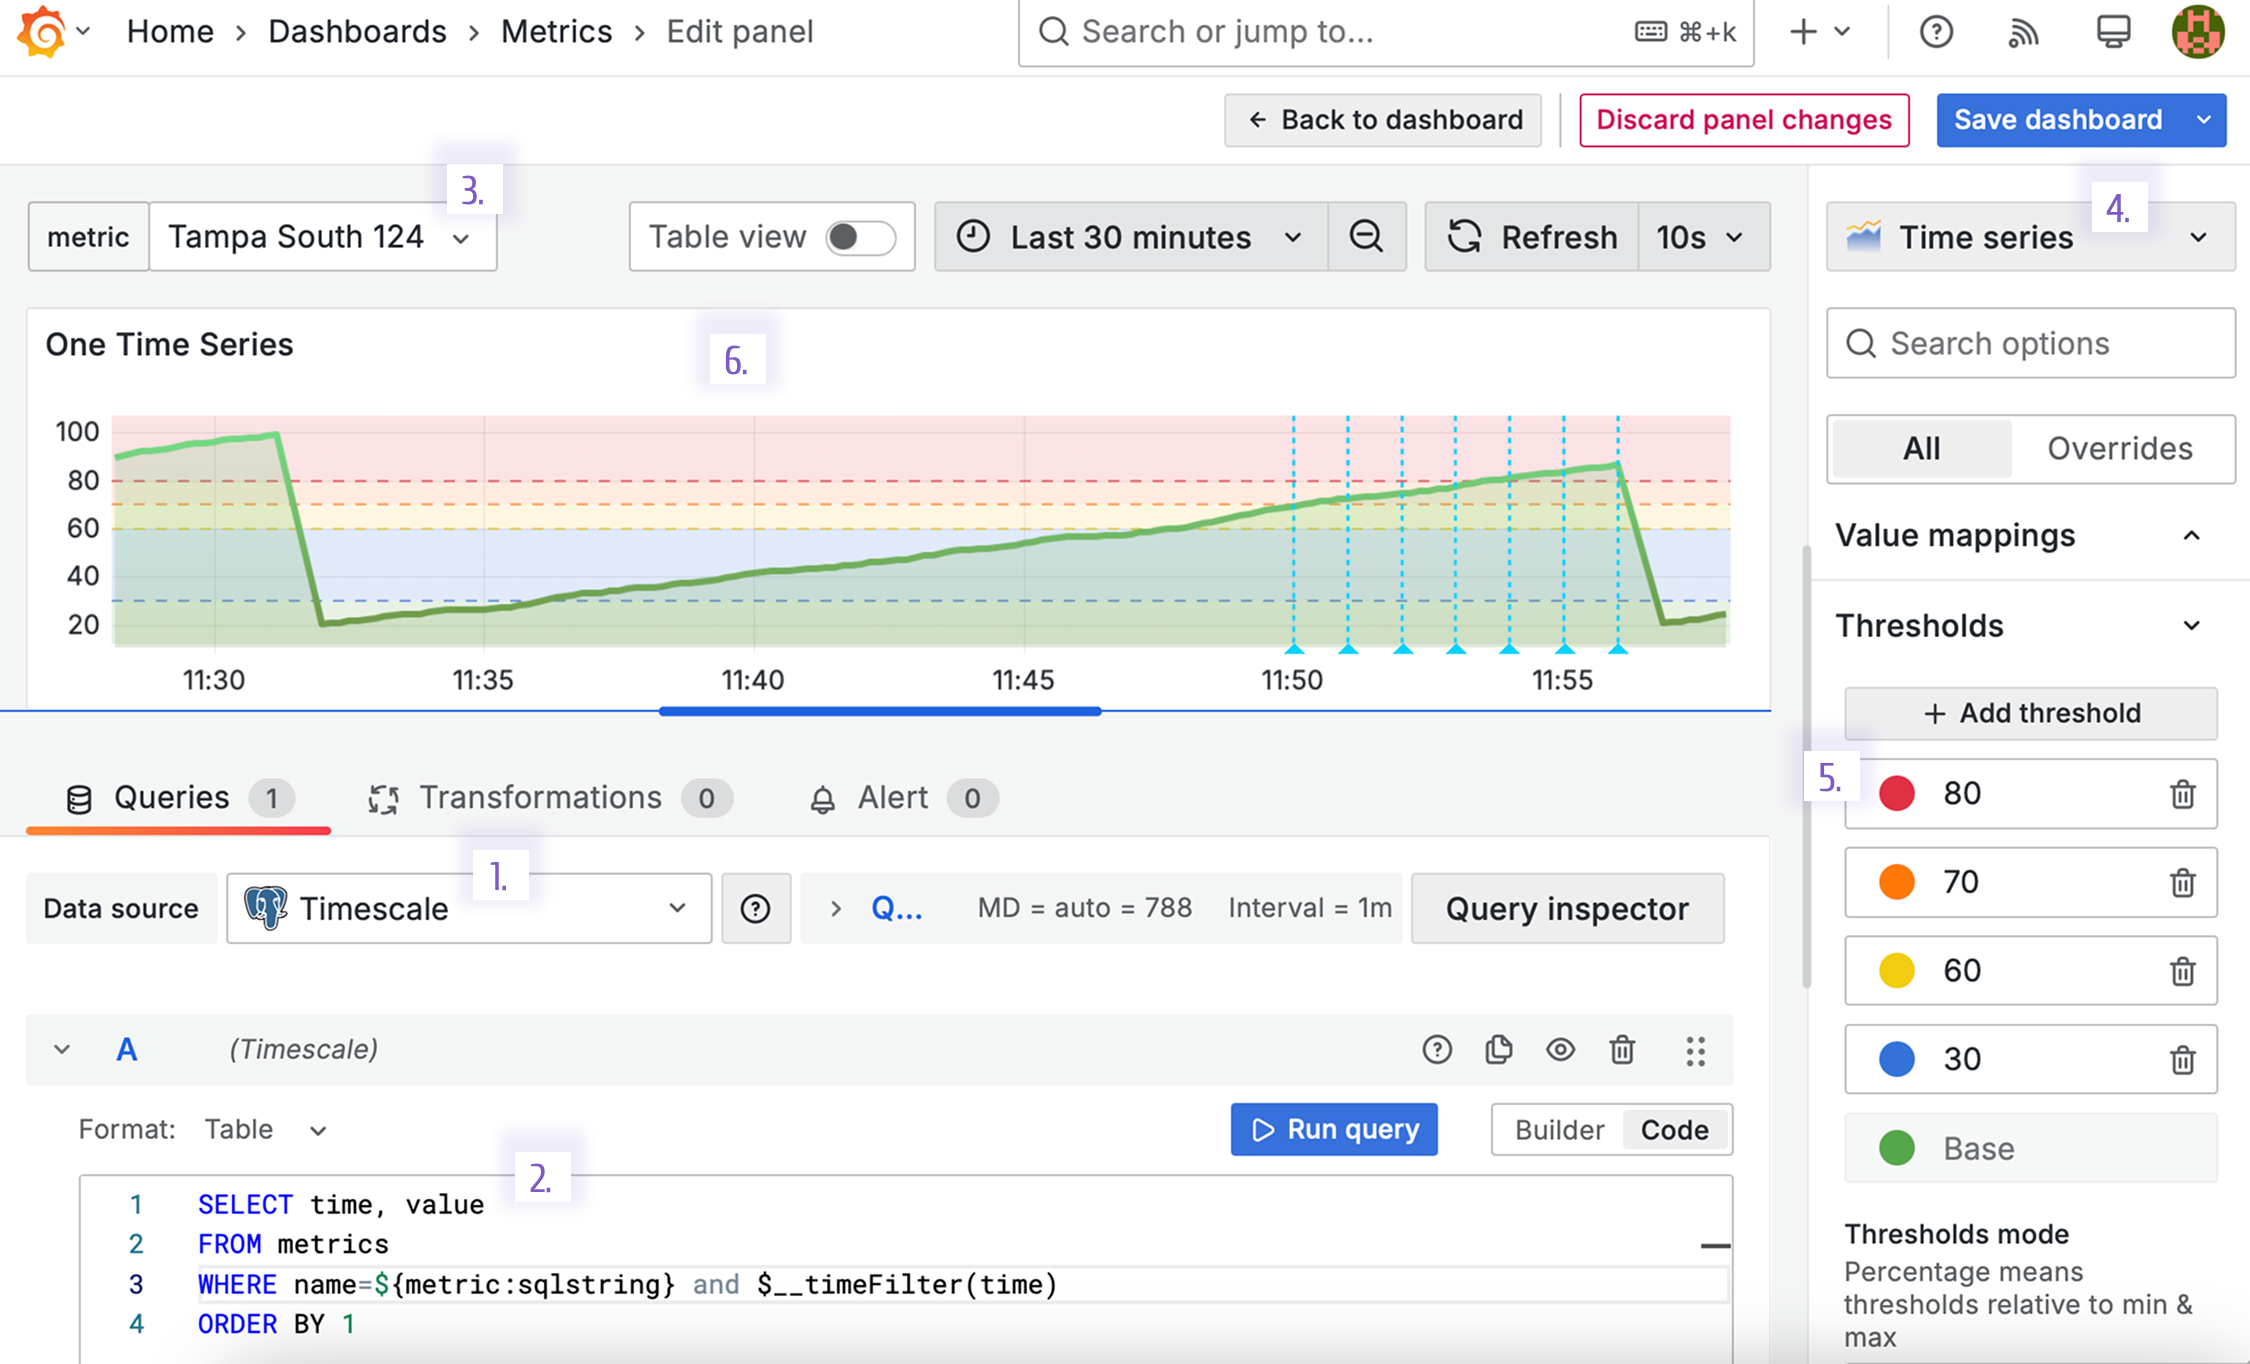
- Create a panel in a Grafana instance and select the pre-configured PostgreSQL datasource. In this example, it is called Timescale.
- Specify an SQL query. In this example, we fetch two column data frame with time and value fields. The alerts configured via Business Studio supports Grafana dashboard variables. So, in addition to the time range parameter(__timeFilter), we added another one. It is a dashboard variable named metric (see the image below for more details about the metric configuration).
SELECT time, value
FROM metrics
WHERE name=${metric:sqlstring} and $__timeFilter(time)
ORDER BY 1
The Grafana data frame looks as follows (those are not exact values that represented on the picture above).
| time | value |
|---|---|
| 2025-02-10 11:30:19 | 97.3 |
| 2025-02-10 11:30:29 | 97.3 |
| 2025-02-10 11:30:39 | 97.6 |
| 2025-02-10 11:30:49 | 98.0 |
| 2025-02-10 11:30:59 | 98.5 |
| 2025-02-10 11:31:09 | 99.1 |
| 2025-02-10 11:31:59 | 20.5 |
| 2025-02-10 11:32:09 | 20.7 |
| 2025-02-10 11:32:19 | 20.8 |
- Specify one possible value. In this example, it is a device name - Tampa South 124.
- Select the Time series visualization panel.
- The Thresholds section has many tiers: - below 30 (green area on the panel), - from 30 to 60 (blue area on the panel), - from 60 to 70 (yellow area on the panel), - from 70 to 80 (orange area on the panel), - above 80 (red area on the panel).
- The look of the created time series visualization.
- Horizontal color areas are the threshold sections.
- Vertical blue lines are the annotations created by Grafana as was instructed by the Business Studio.
Dashboard variable
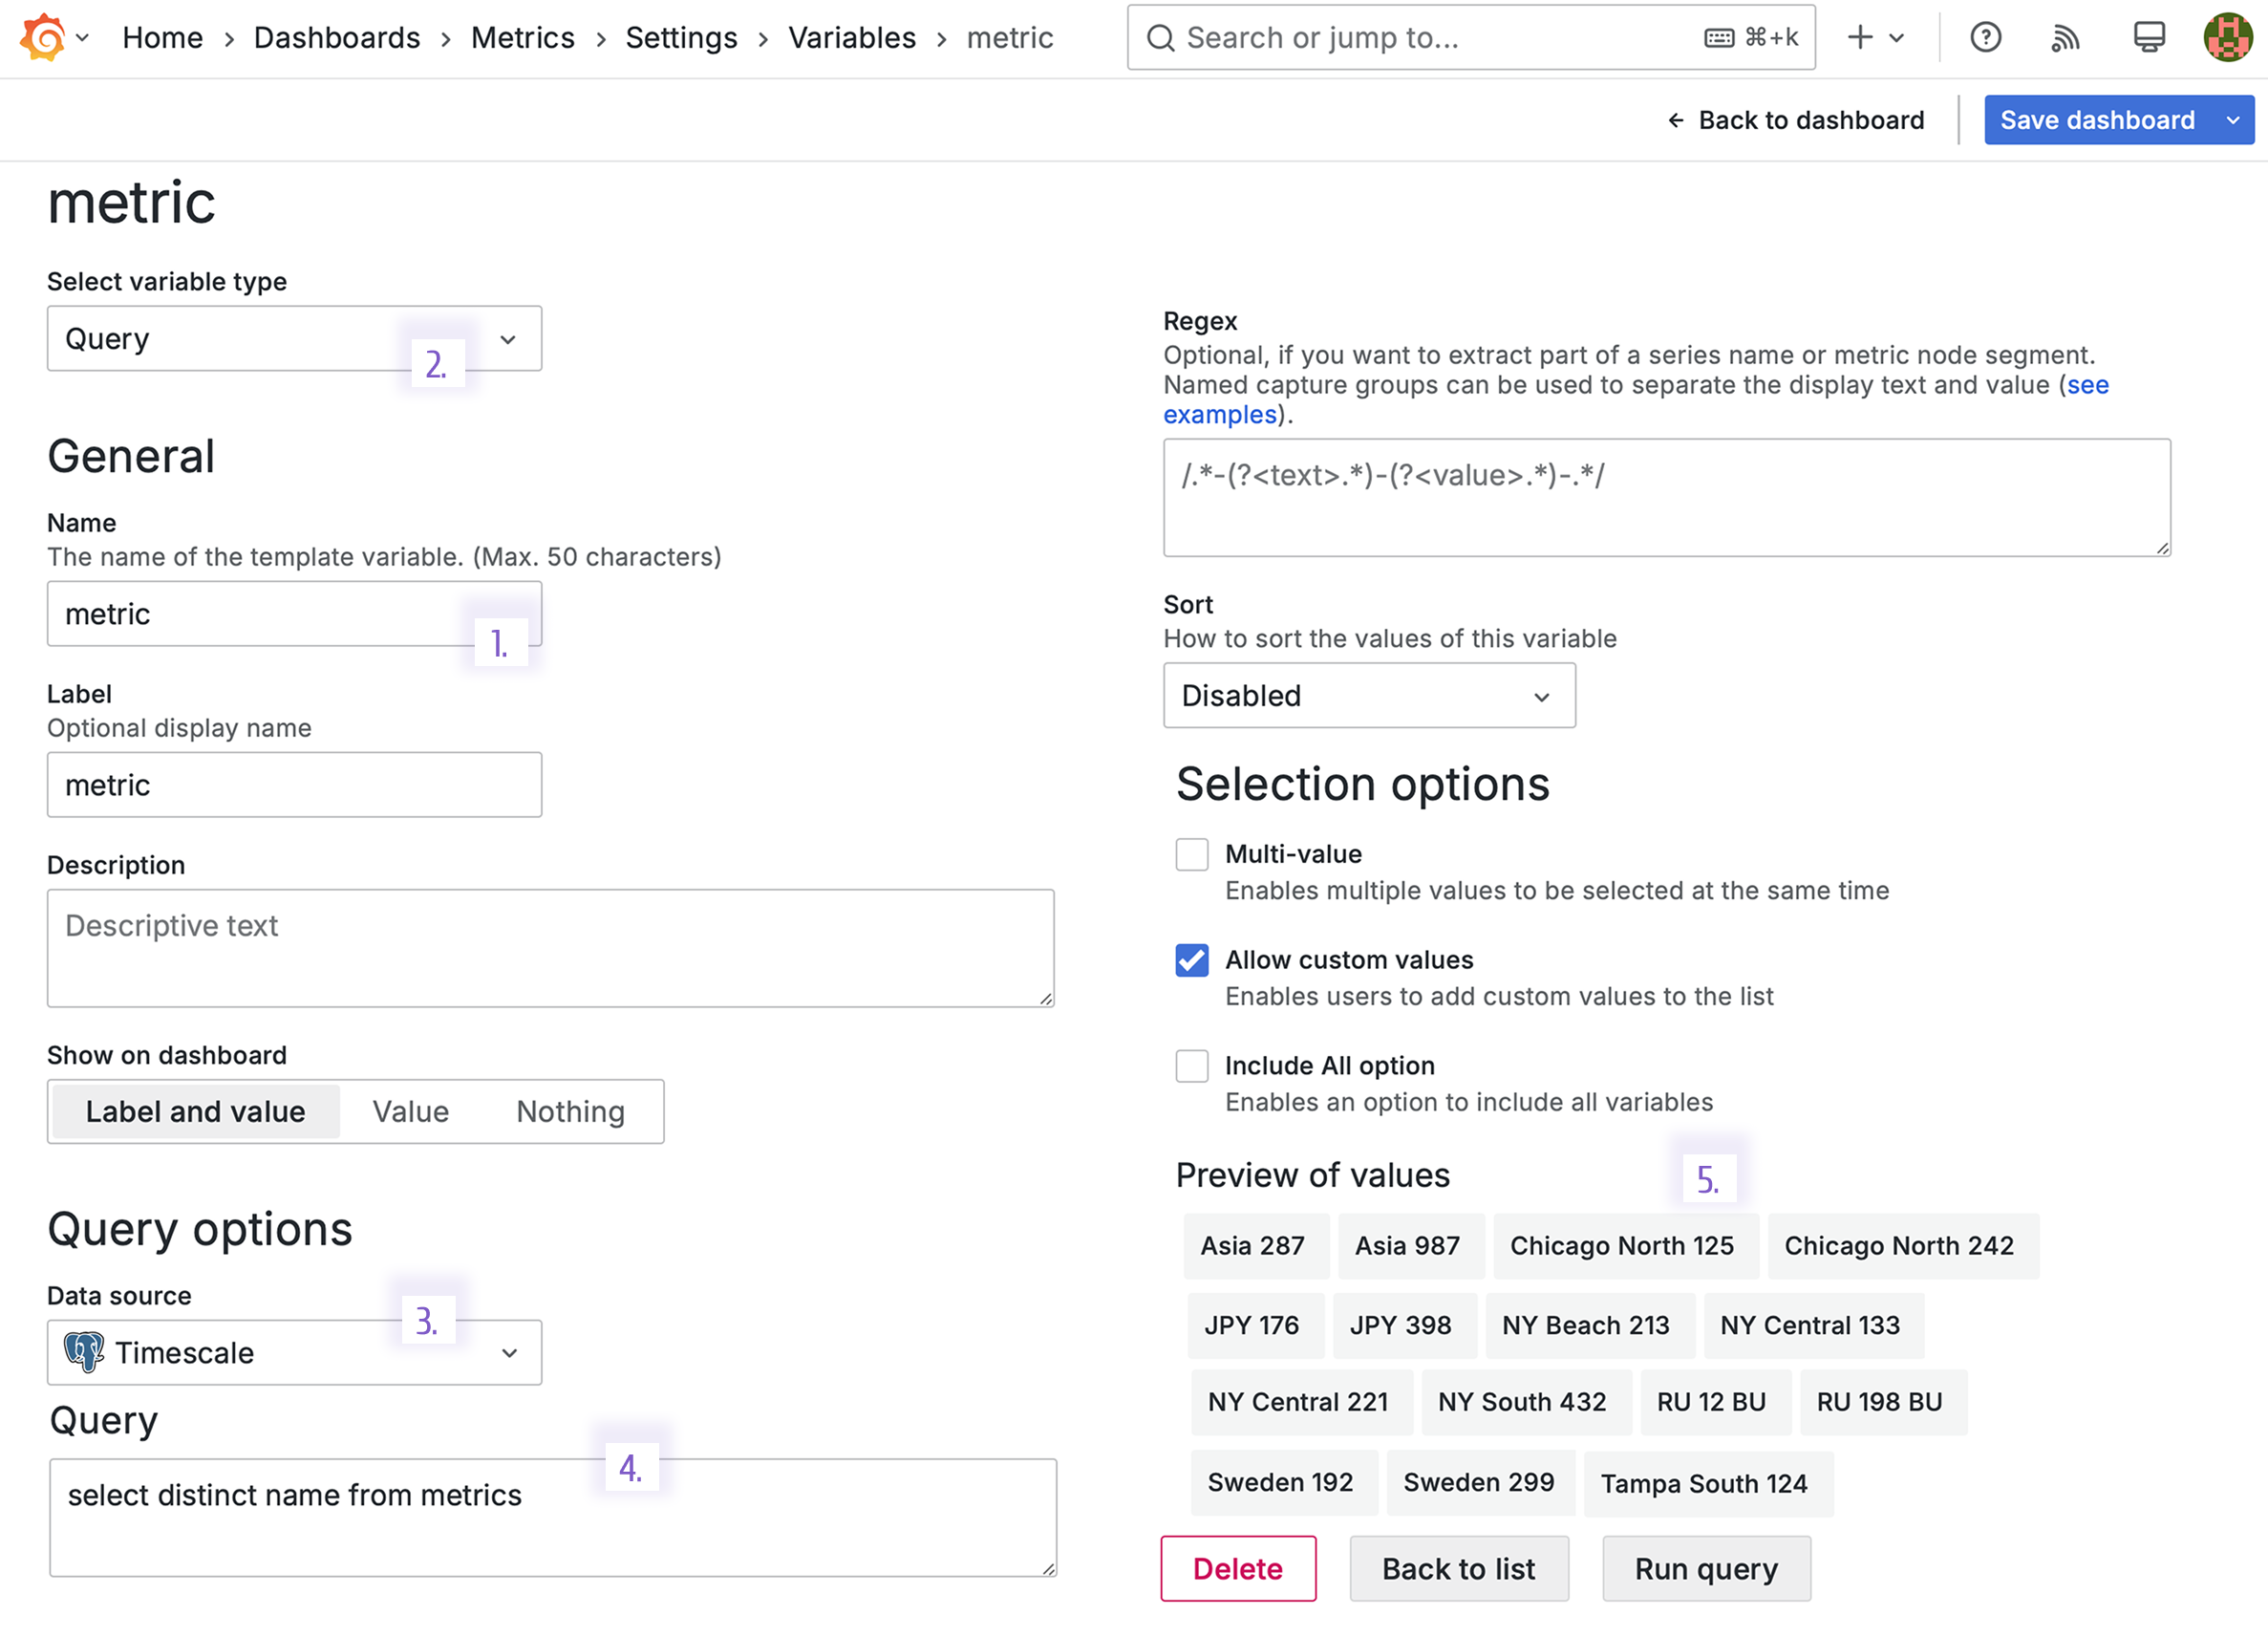
- Metric is a dashboard variable name.
- Query is the dashboard variable type.
- The dashboard variable takes data from the connected PostgreSQL data source.
- The query that populated the dashboard variable requests the listing of all unique device names.
select distinct name from metrics
- In the Preview of values, all fetched values are shown. Further in the example, we use one value Tampa South 124.
Business Studio
Open Business Studio and add an alert rule. To follow up on the triggered event check alert history and data preview.
Alert rule configuration
To add an alert rule, you can follow the general instructions or review the suggested example below.
After an alert rule is added, you can open the Alert settings page to review its configuration.
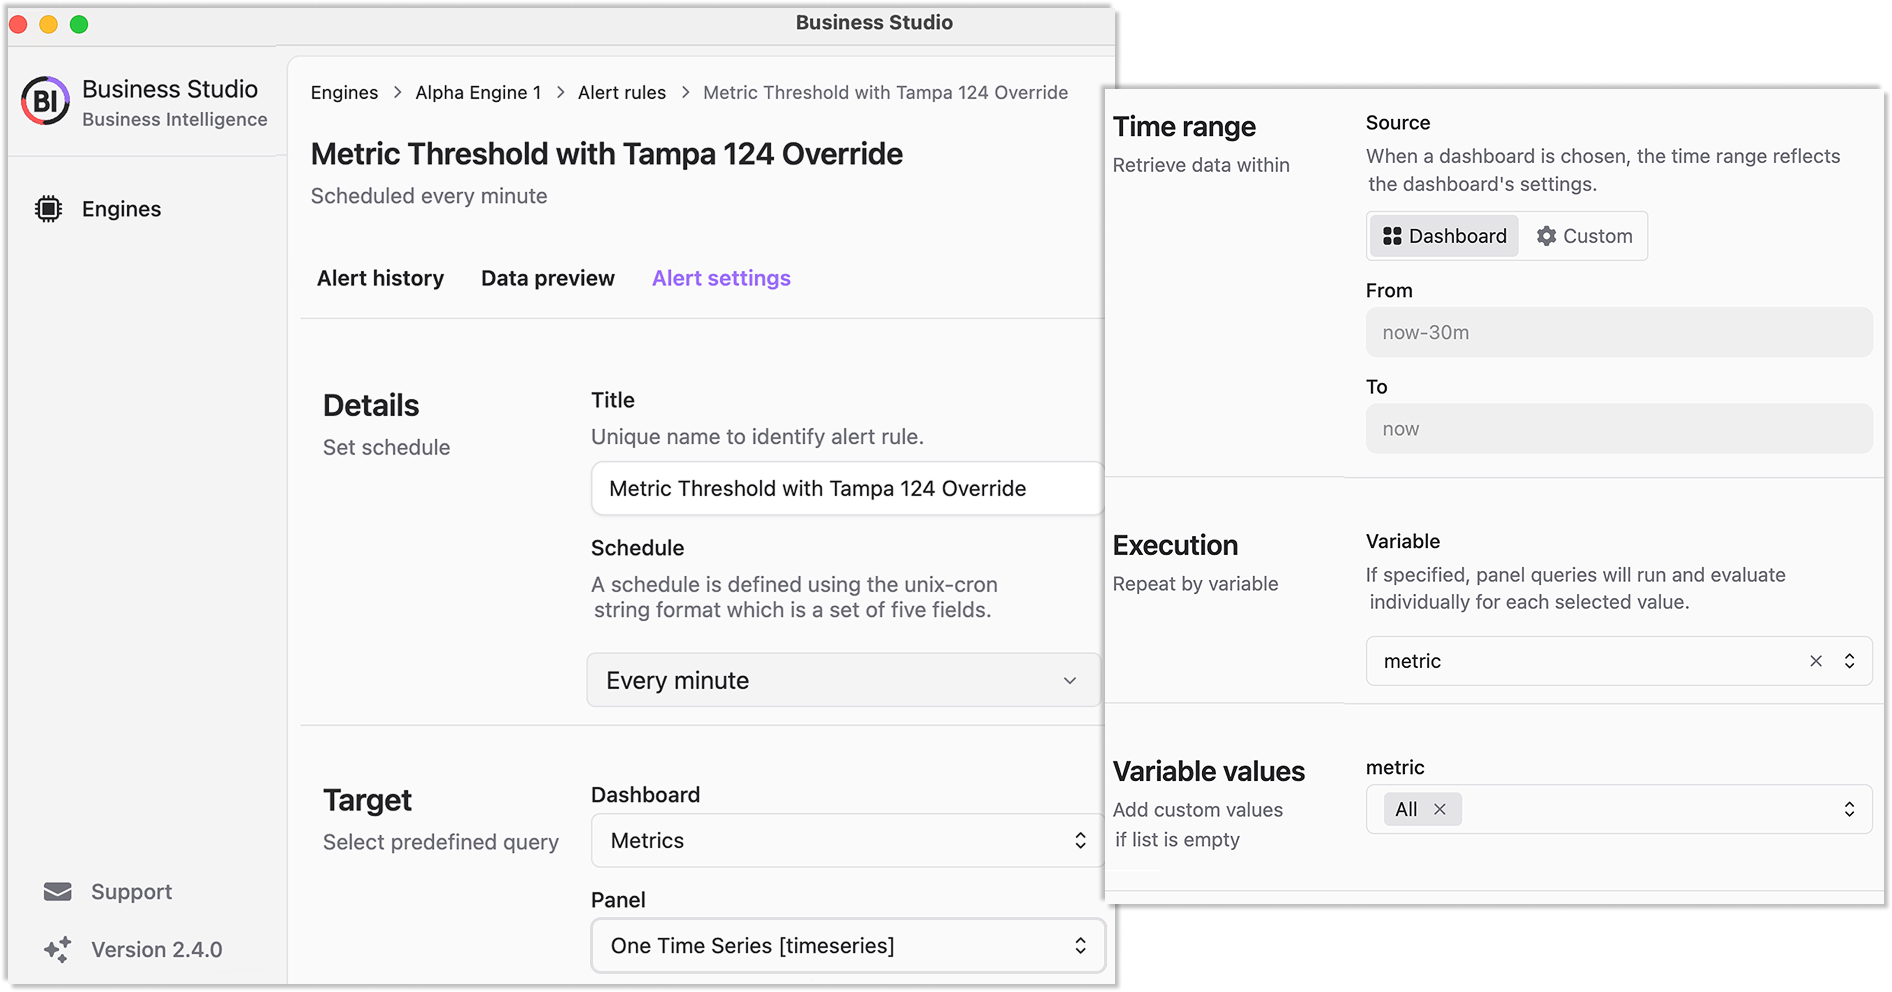
- Details
- Title is set to Metric Threshold with Tampa 124 Override.
- Schedule is kept by default which is every minute.
- Target
- Dashboard is set to Metrics Grafana dashboard.
- Panel is set to One Time Series.
- Time Range
- Source is set to take the Grafana Dashboard time range.
- Execution->Variable is set to use the dashboard variable metric. This means that query will be run for every variable value separately.
- Variable values is set to All. Here, you can specify a subset of a dashboard variable values if you do not need all of them.
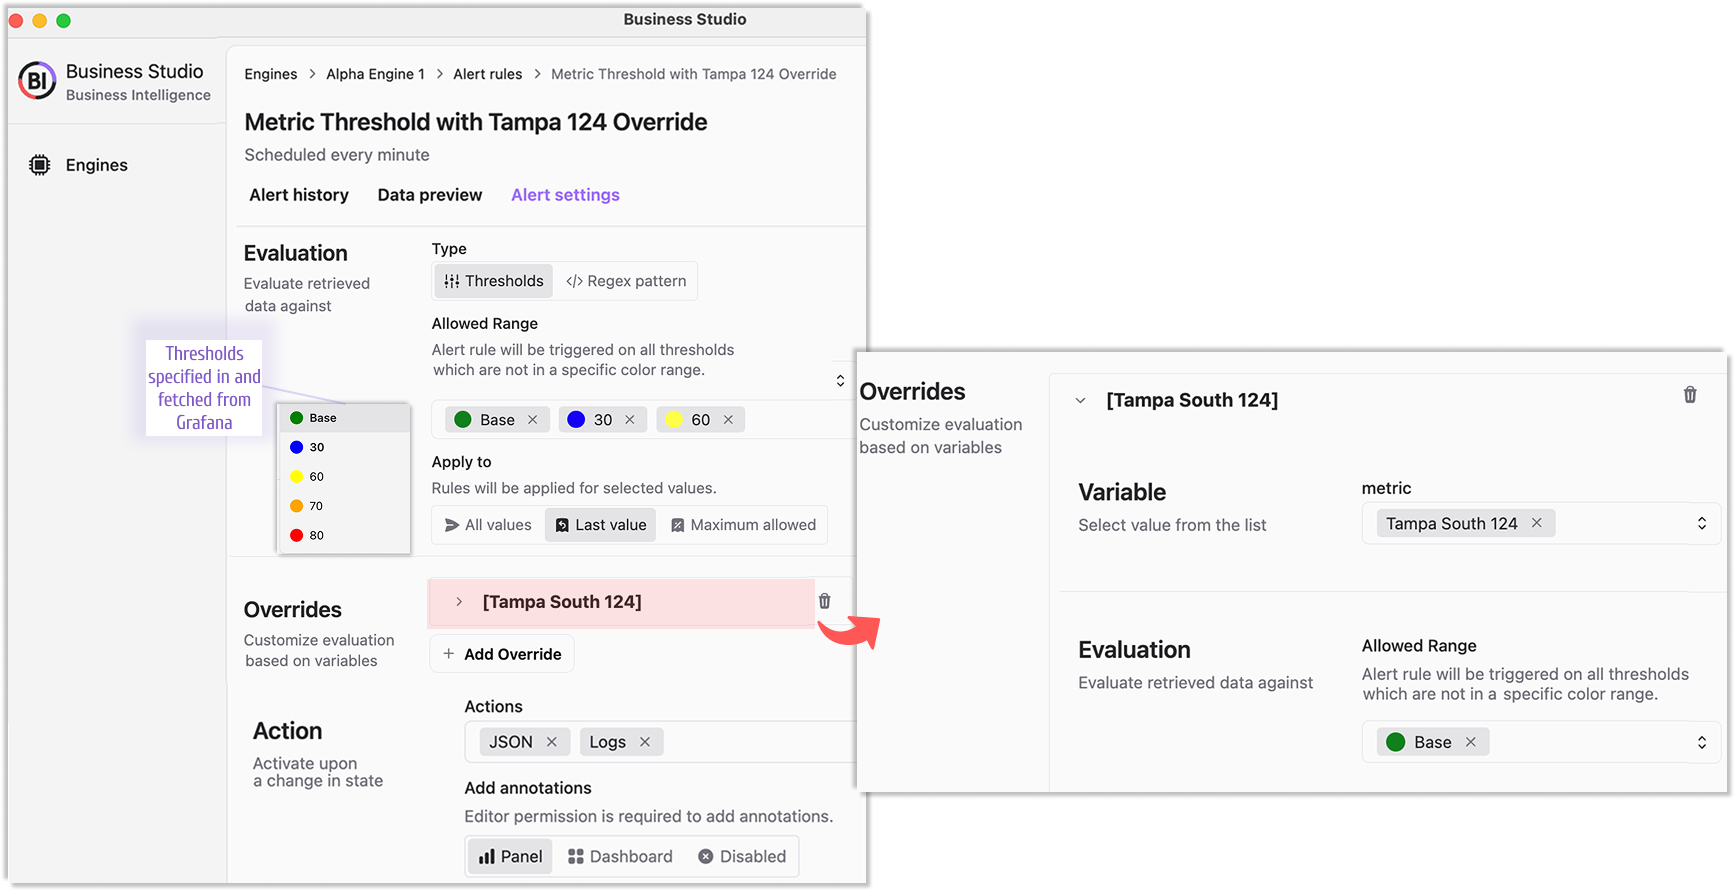
- Evaluation
- Type is set to Thresholds to instruct the Business Studio to get configured thresholds from the specified Grafana dashboard.
- Allowed range is set to from below 30 up to 70. The top boundary is not specified; it comes from the lower boundary of the next range.
- Apply to. Applying to one (the last value) is enough for this example.
- Overrides. When the Execution -> Variable is populated with a dashboard variable name, the Overrides section appears. In this example, the Tampa Sount 124 device has a specific allowed range below 30. Anything above 30 triggers the alert rule.
- Action
- Actions. In the case of a triggered alert rule, two actions are triggered - writing into the Business Engine container logs and creating a file on a designated server/location with the details of the triggered event.
- Add Annotation. With every triggered alert event, an annotation is created and displayed on the Grafana dashboard (a light blue vertical line on the time series visualization).
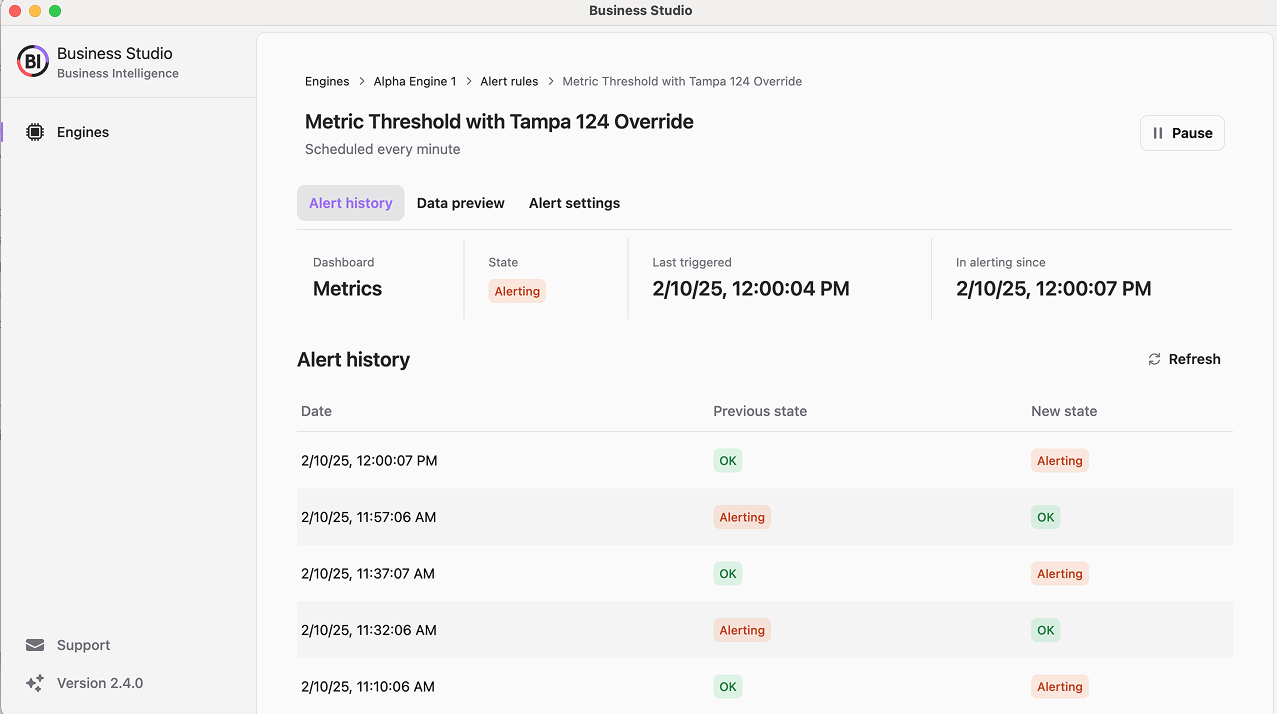
Alert history
On the Alert history page, the Business Studio displays the alert rule status changes.
Data preview
On the data preview page you have a Grafana data frame. Specify a dashboard variable in the provided drop-down if needed.
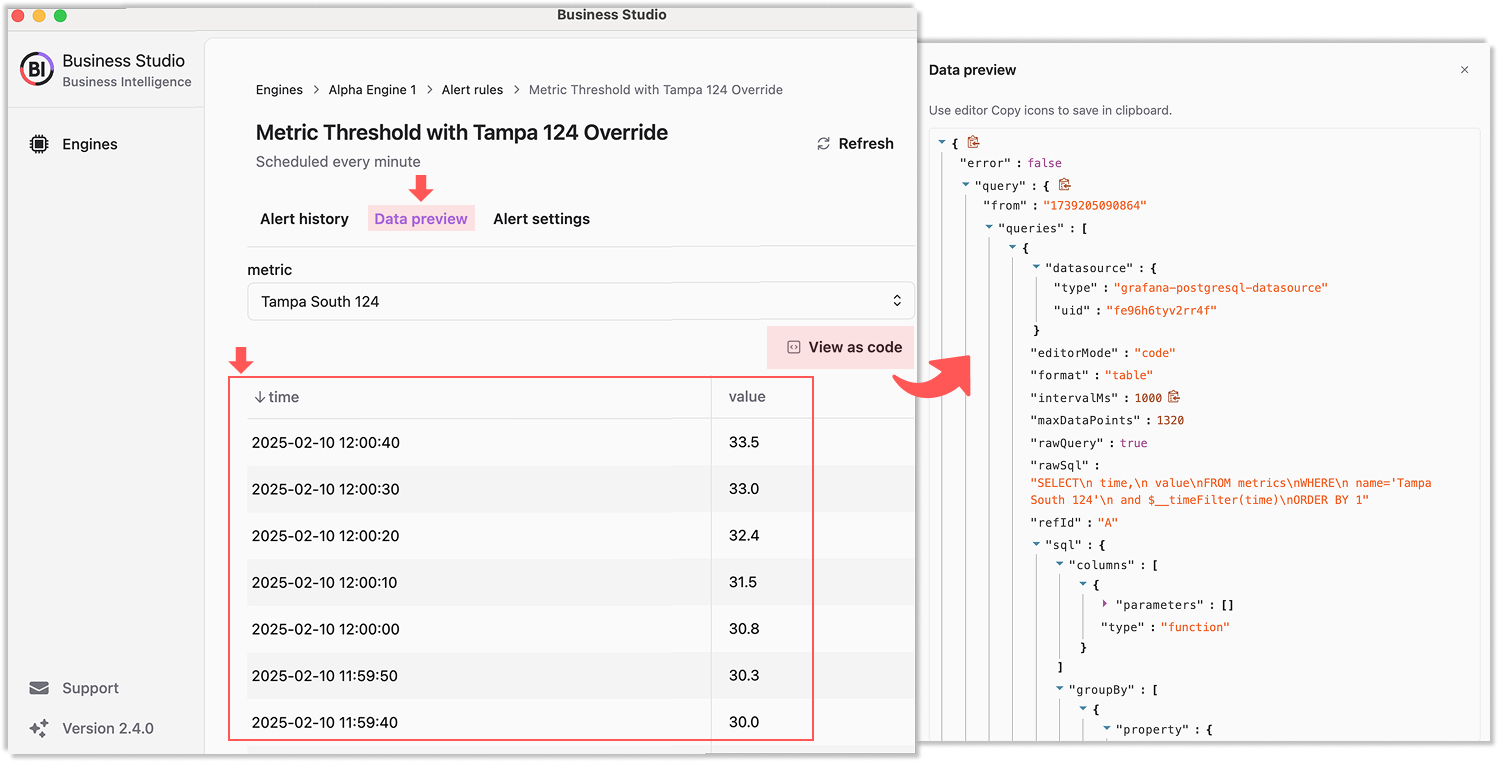
You can also review the payload submitted into the alert action "as-is".