Prometheus with High Availability
The following example demonstrates configuring a Grafana, Business Studio, and Prometheus trio to work with alerts.
As you know, Prometheus is a free and open-source core technology for monitoring and observability of systems. That means we need a high-availability use case (HA) to show it in bright and shiny armor.
System setup
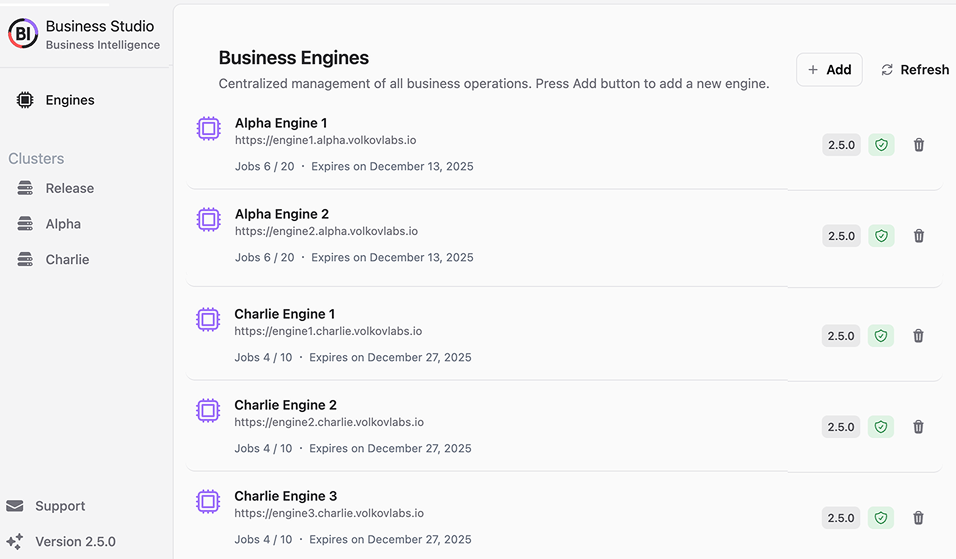
Before diving into the step-by-step configuration, let's review the system setup we will monitor and create alerts for. The system consists of two environments - Alpha and Charlie.
Alpha cluster
In the Alpha environment, there are two mirrored business engines: engine1.alpha and engine2.alpha. They are connected with the Grafana cluster, which has two mirrored Grafana instances Grafana1 and Grafana2.
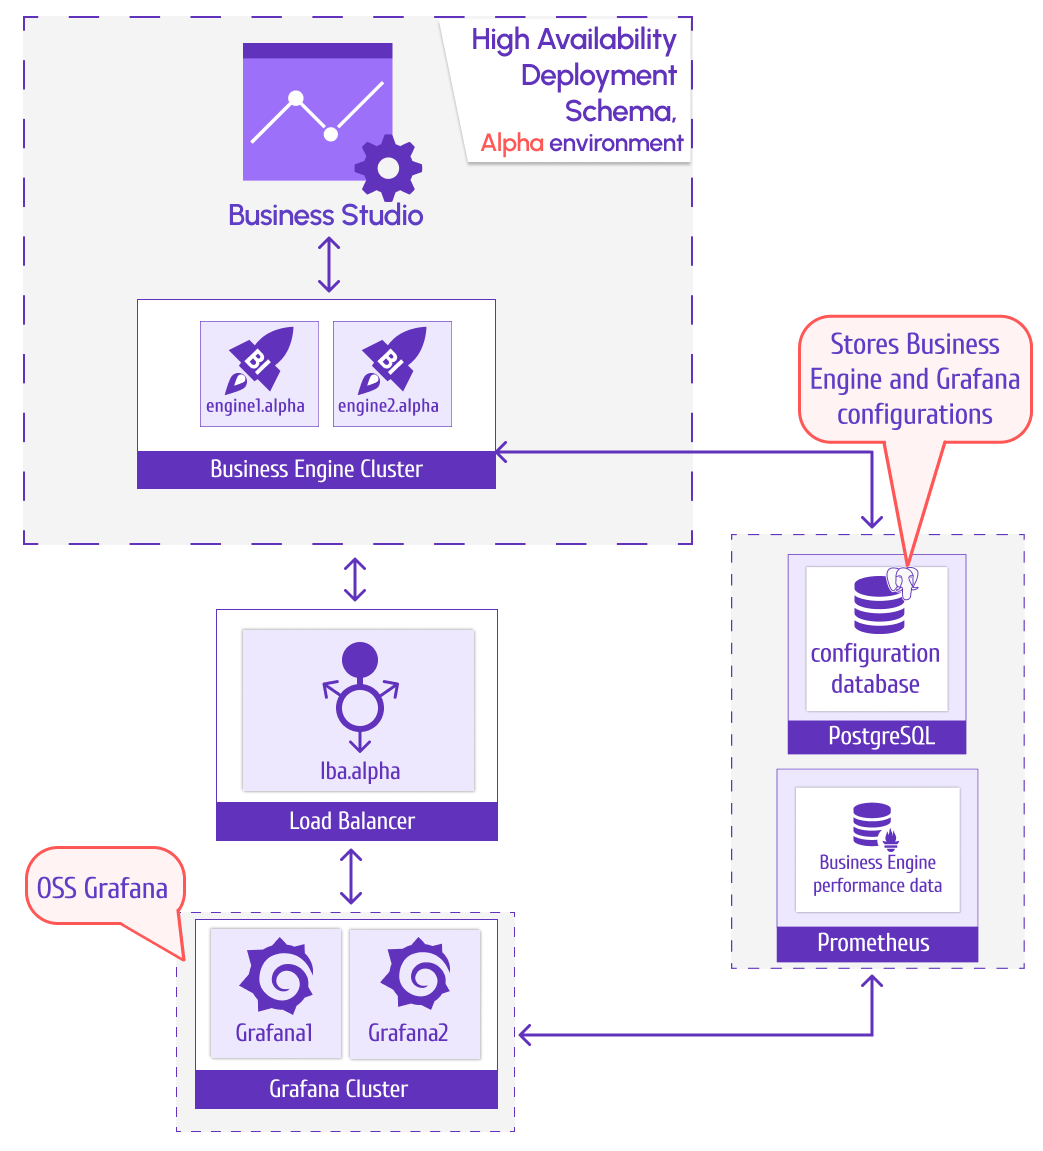
To store the business engine and Grafana configuration, we employ PostgreSQL (can be configured as master-slave or HA). Prometheus is here to collect metrics from the business engine and Grafana.
Charlie cluster
In the Charlie environment, there are three business engines:engine1.charlie, engine2.charlie, and engine3.charlie. They serve one Grafana cloud instance.
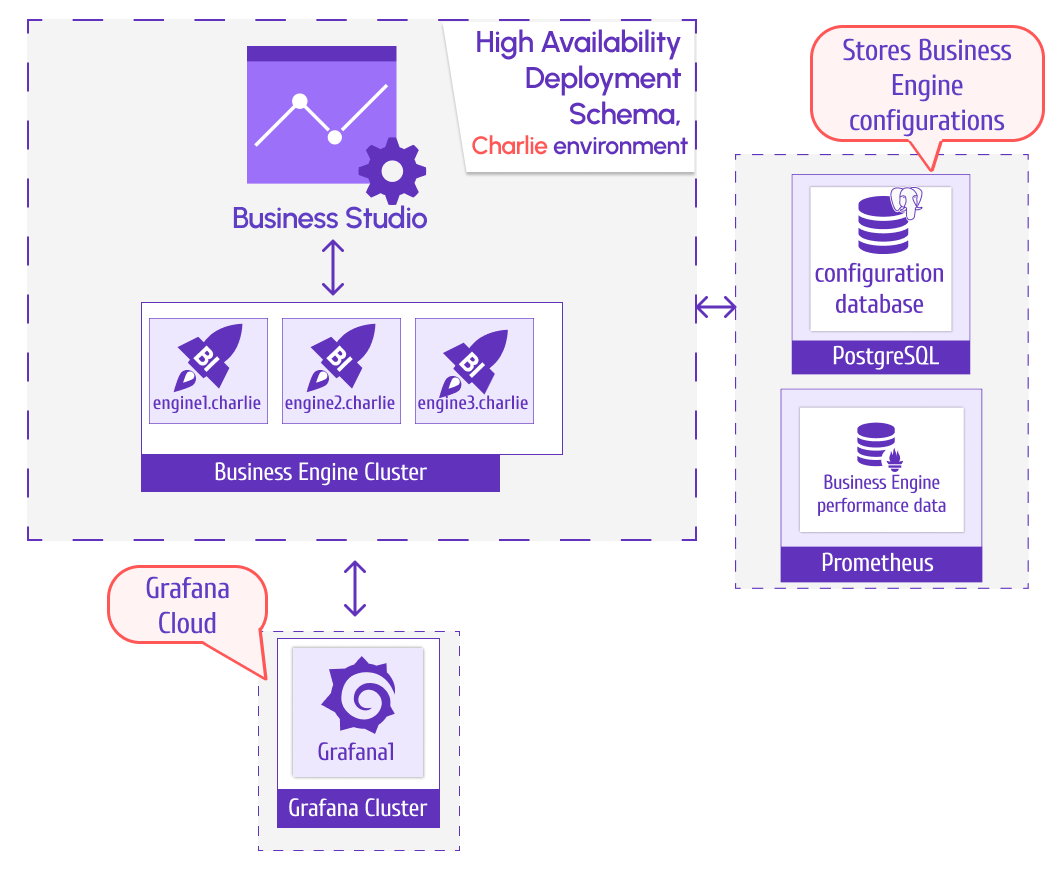
PostgreSQL stores the business engine configuration. Prometheus collects performance metrics from all three business engines.
Business Engine metrics endpoints
Every business engine provides two metrics endpoints to collect performance data:
- Port 3001 for API server
- Port 3002 for Scheduler
Use case
We want to monitor the CPU usage by all five business engines distinctively for each provided service (meaning 10 instances to monitor). In the event of either of them exceeding 2%:
- Create a Grafana anotation.
- Write logs with alert payload.
- Create a file on the designated JSON server with all the details of the CPU exceeding event.
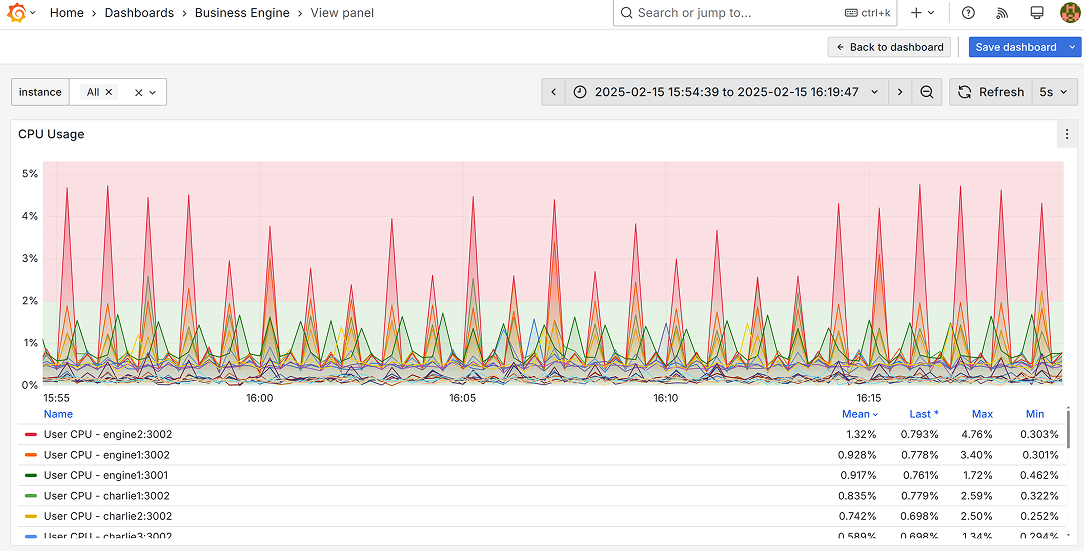
Grafana
In Grafana, we want to have a time series visualization where exceeding 2% CPU usage would be visually noticeable immediately.
Dashboard variables
It is important to note that our use case requires firing an alert only for a particular business engine/service. In all alert messages (in the log records and JSON file notes), we want to know which specific business engine/service causes the problem.
To make it possible, all the observable metrics need to contain this details - business engine/service. To make the distinctive firing possible, we use Grafana dashboard variables.
Dashboard variable configuration
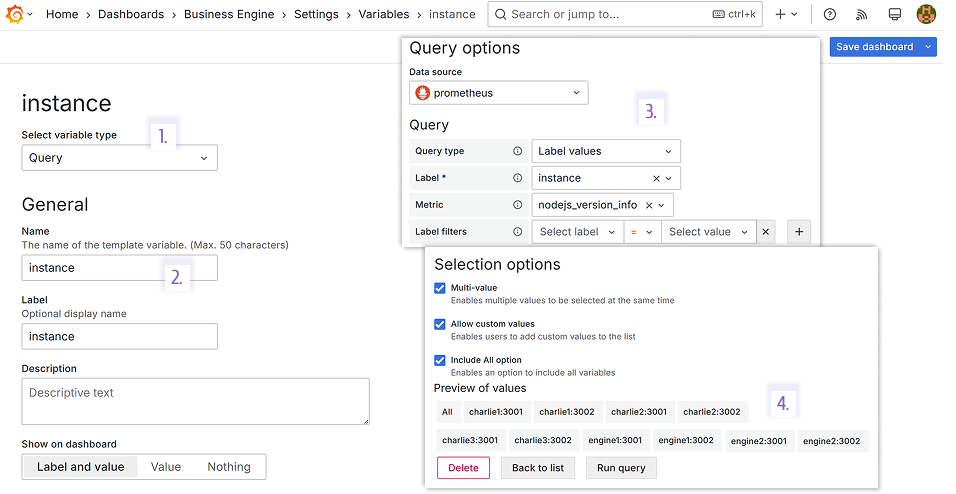
Create a dashboard variable:
-
Type Query.
-
Name instance.
-
Data source prometheus:
- Query Label values,
- Label instance,
- Metric nodejs_version_info.
-
In the Preview of values, all 10 services that are needed to be monitored are displayed.
Time Series panel configuration
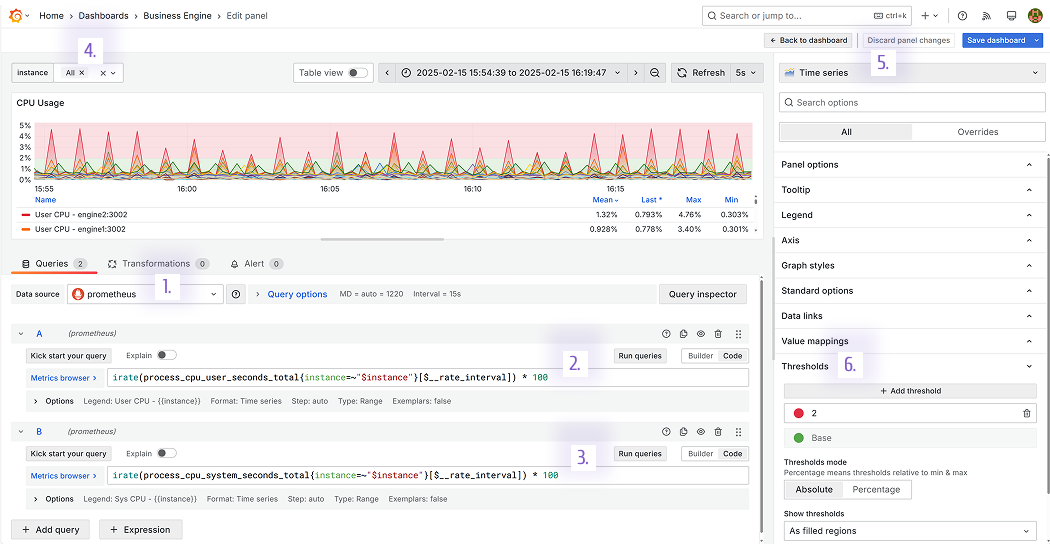
- Select the configured Prometheus data source.
- Specify a query to extract the user's CPU usage.
- Specify a query to extract the system CPU usage.
- Dashboard variable with all 10 services to monitor.
- Select the time series panel.
- Set up the threshold where values above 2 are out of the allowable range.
Business Studio
Business Studio can be connected to one or all business engines within a cluster.
Alert history
The section is coming soon...
Alert rule configuration
The section is coming soon...
Data preview
The section is coming soon...