Annotations, Alerts and Annotation Queries in Grafana

Grafana's time series visualization is designed to display one-dimensional data arrays. In most cases that we have come across, a time series panel shows data points collected from a device.
Out of the box, Grafana allows adding native annotations, alert rules for your time series, and visualizing annotation queries.
Native Annotations
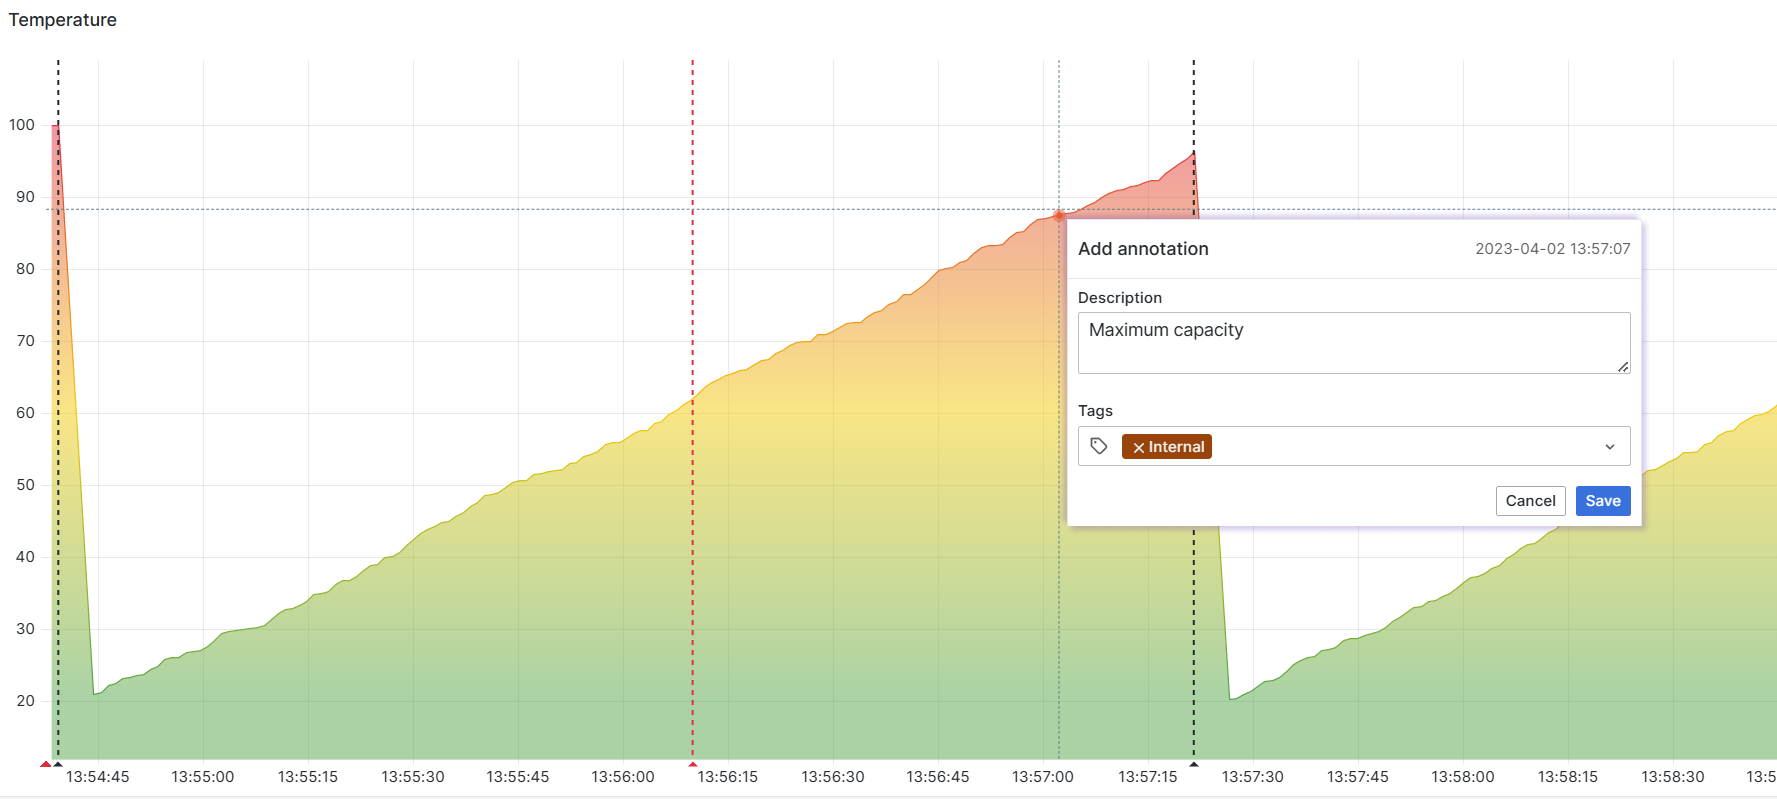
Native annotation is a simple commentary on a data point. Users with at least Editor privileges can add a native annotation manually by clicking on the data point of interest, typing a description, and specifying tags.
Alternatively, you can create HTTP API calls to automate the entry process.
Alerts
Alerts might seem like a different kind of animal, but under the hood, alerts are very similar to native annotations.
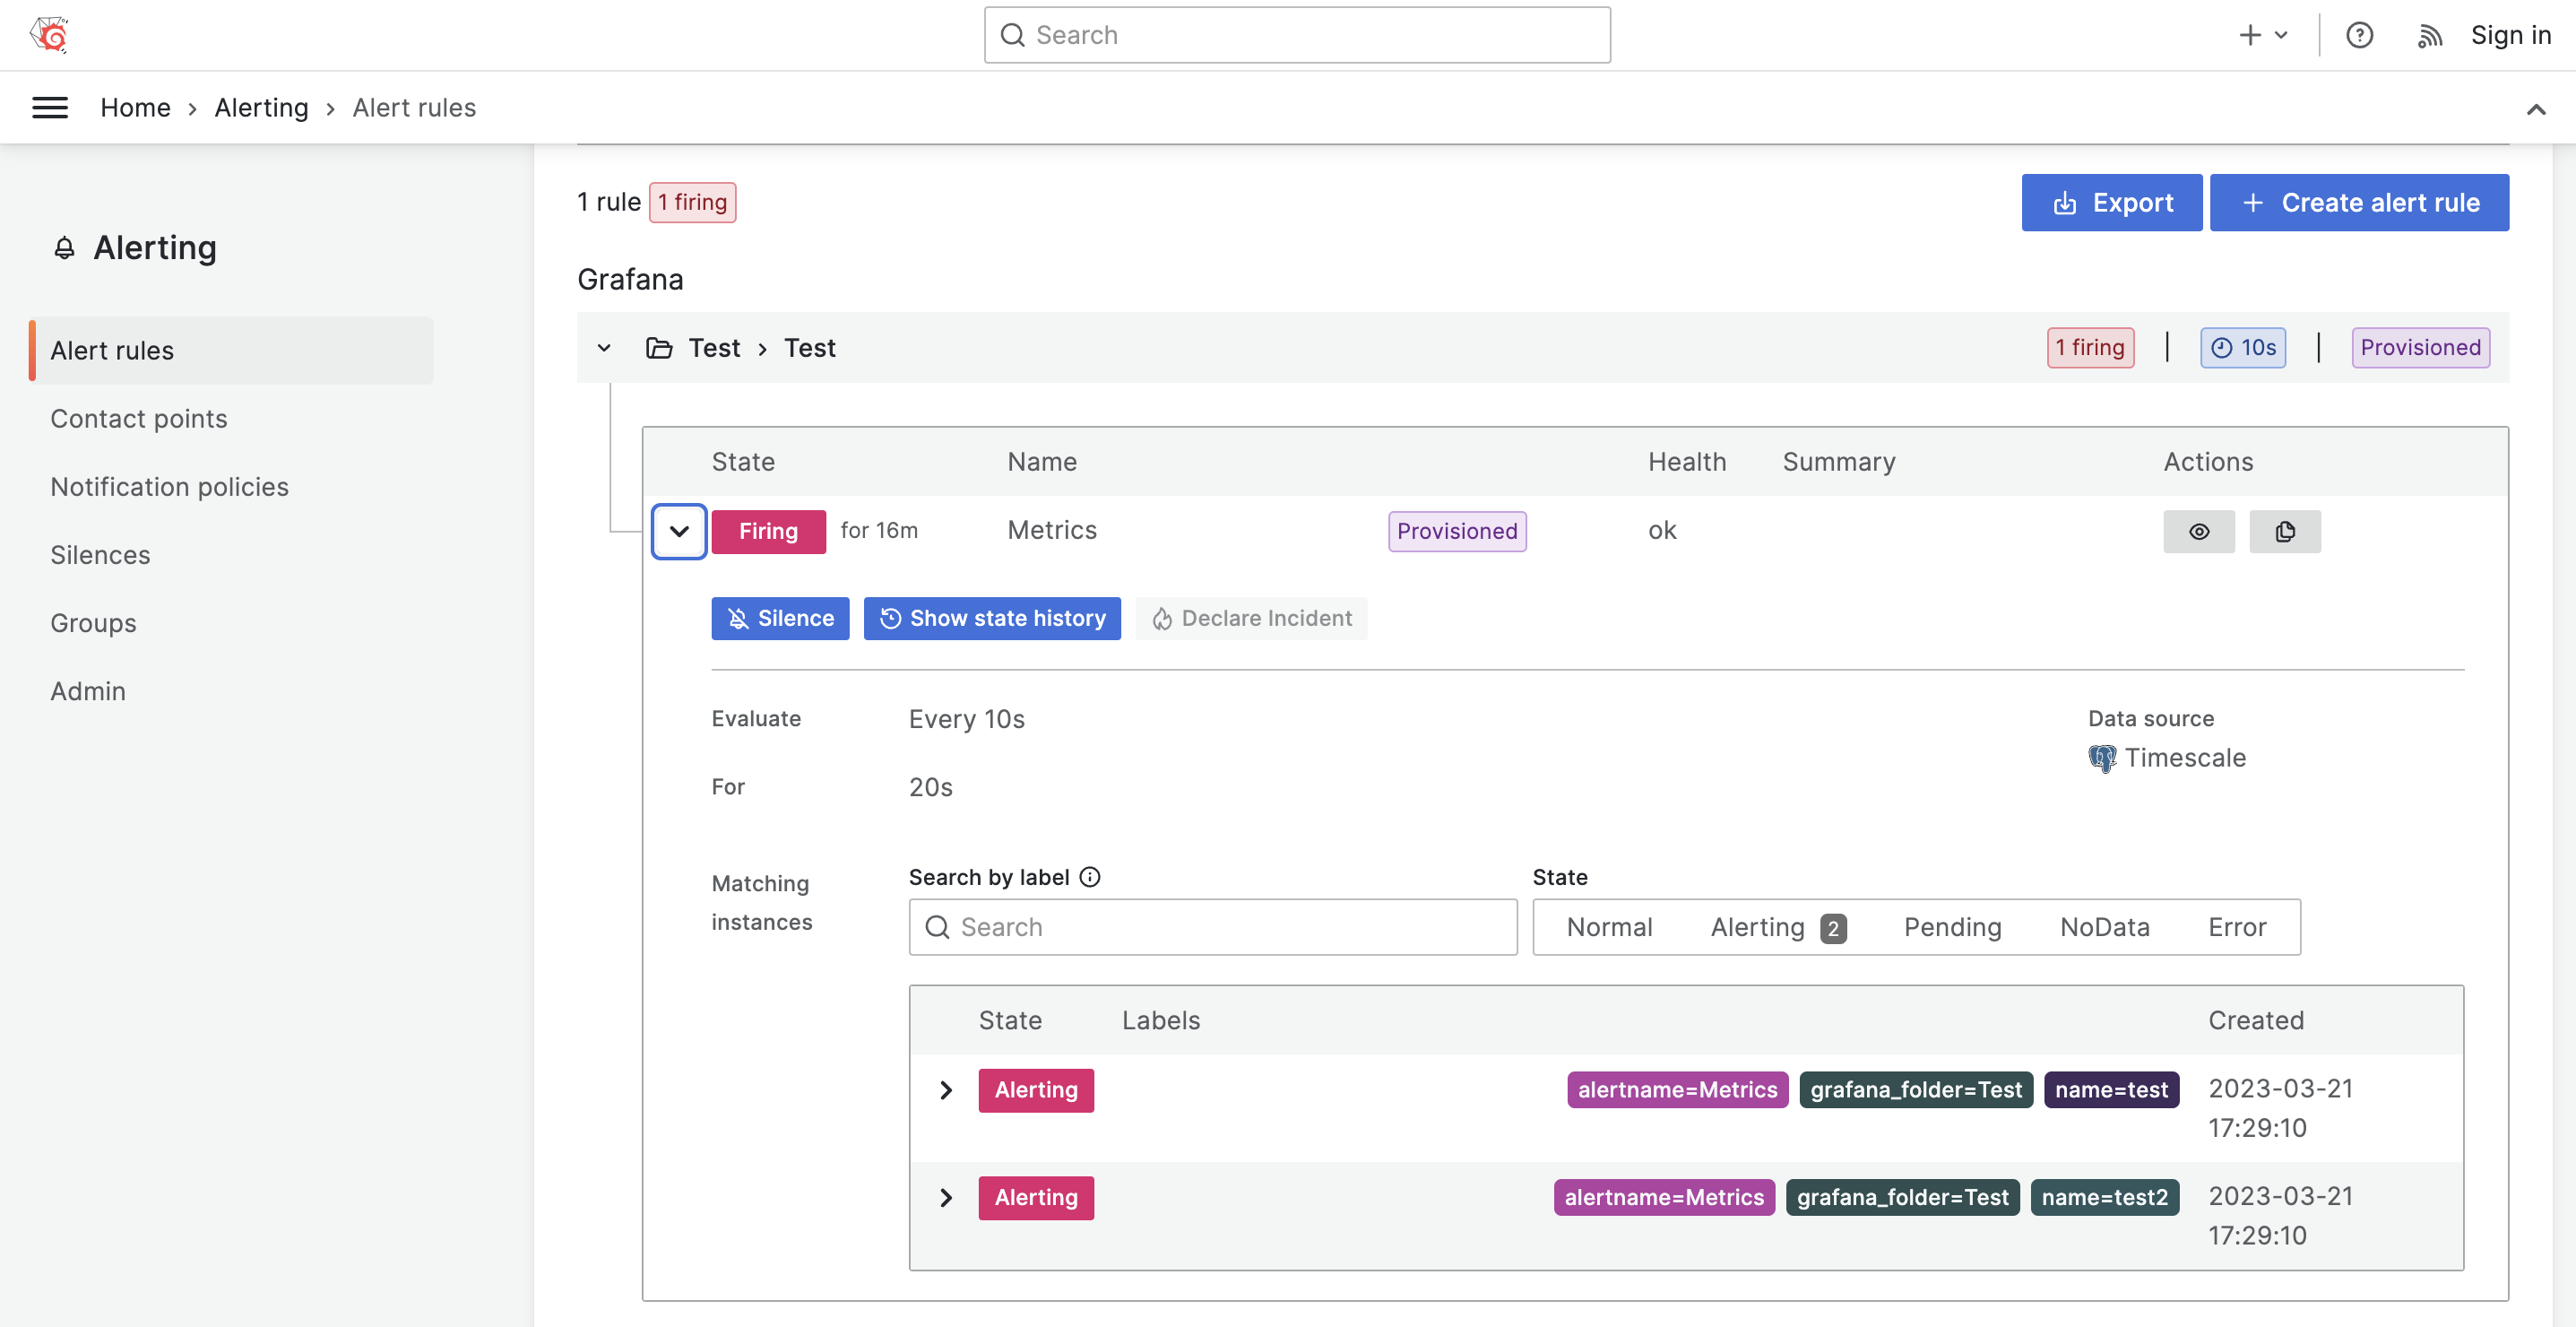
Alerts are created by the Grafana alert manager according to the alert rules you put in place. Here is an example of an alert rule:
Watch the Value column from the Metric table, PostgreSQL data source. Evaluate every 10 seconds for 30 seconds for the condition greater than 100.
The rule means to capture three values (30 seconds/10 seconds).
- If all three are above 100, then fire an alert.
- In addition to generating an annotation, fire (or create) an alert means to send a notification via the configured channels. Your options are Email, Slack messenger, and OnCall.
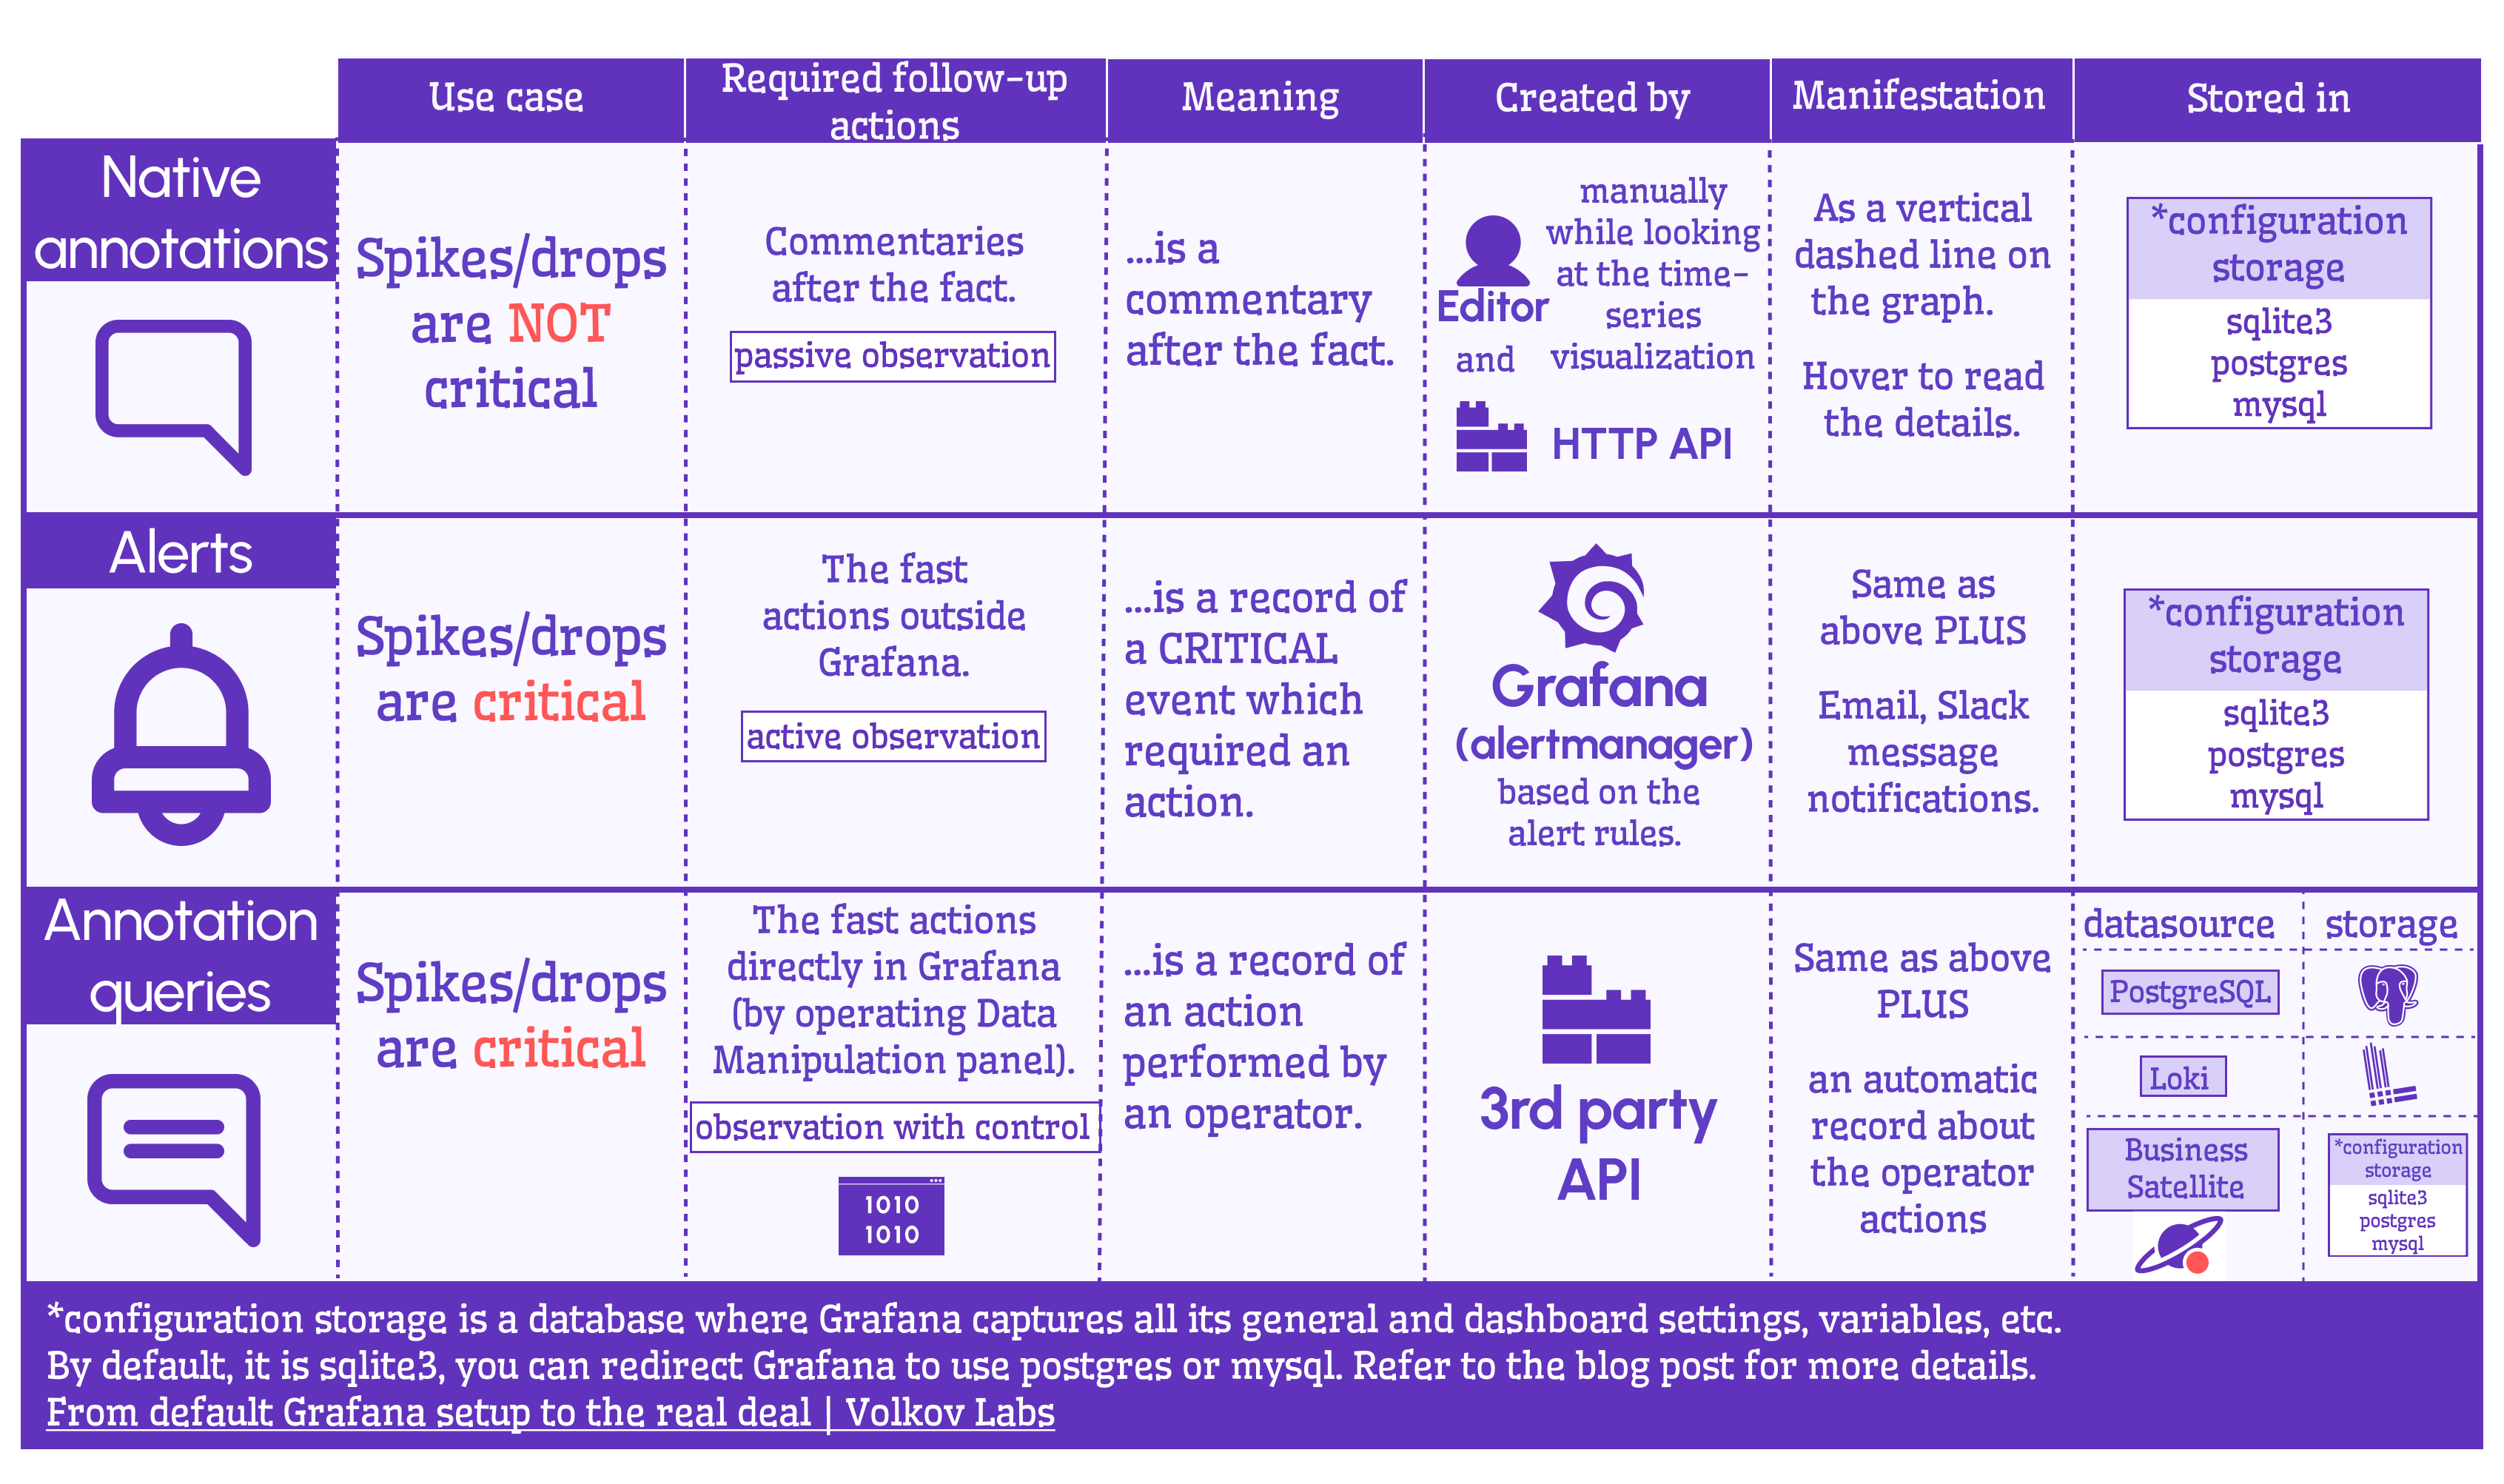
Alerts vs Native annotations
Native annotations serve well for non-time-critical comments, while alerts work best for vigilant data monitoring. The alert manager creates alerts according to the rules you put in place. Alerts immediately signal if something is off (the value is outside of the expected range).
People tend to reference both alerts and native annotations simply as annotations. This, unfortunately, confuses things a little further.
This introductory video highlights the differences and similarities between Grafana alerts, annotations, and annotation queries.
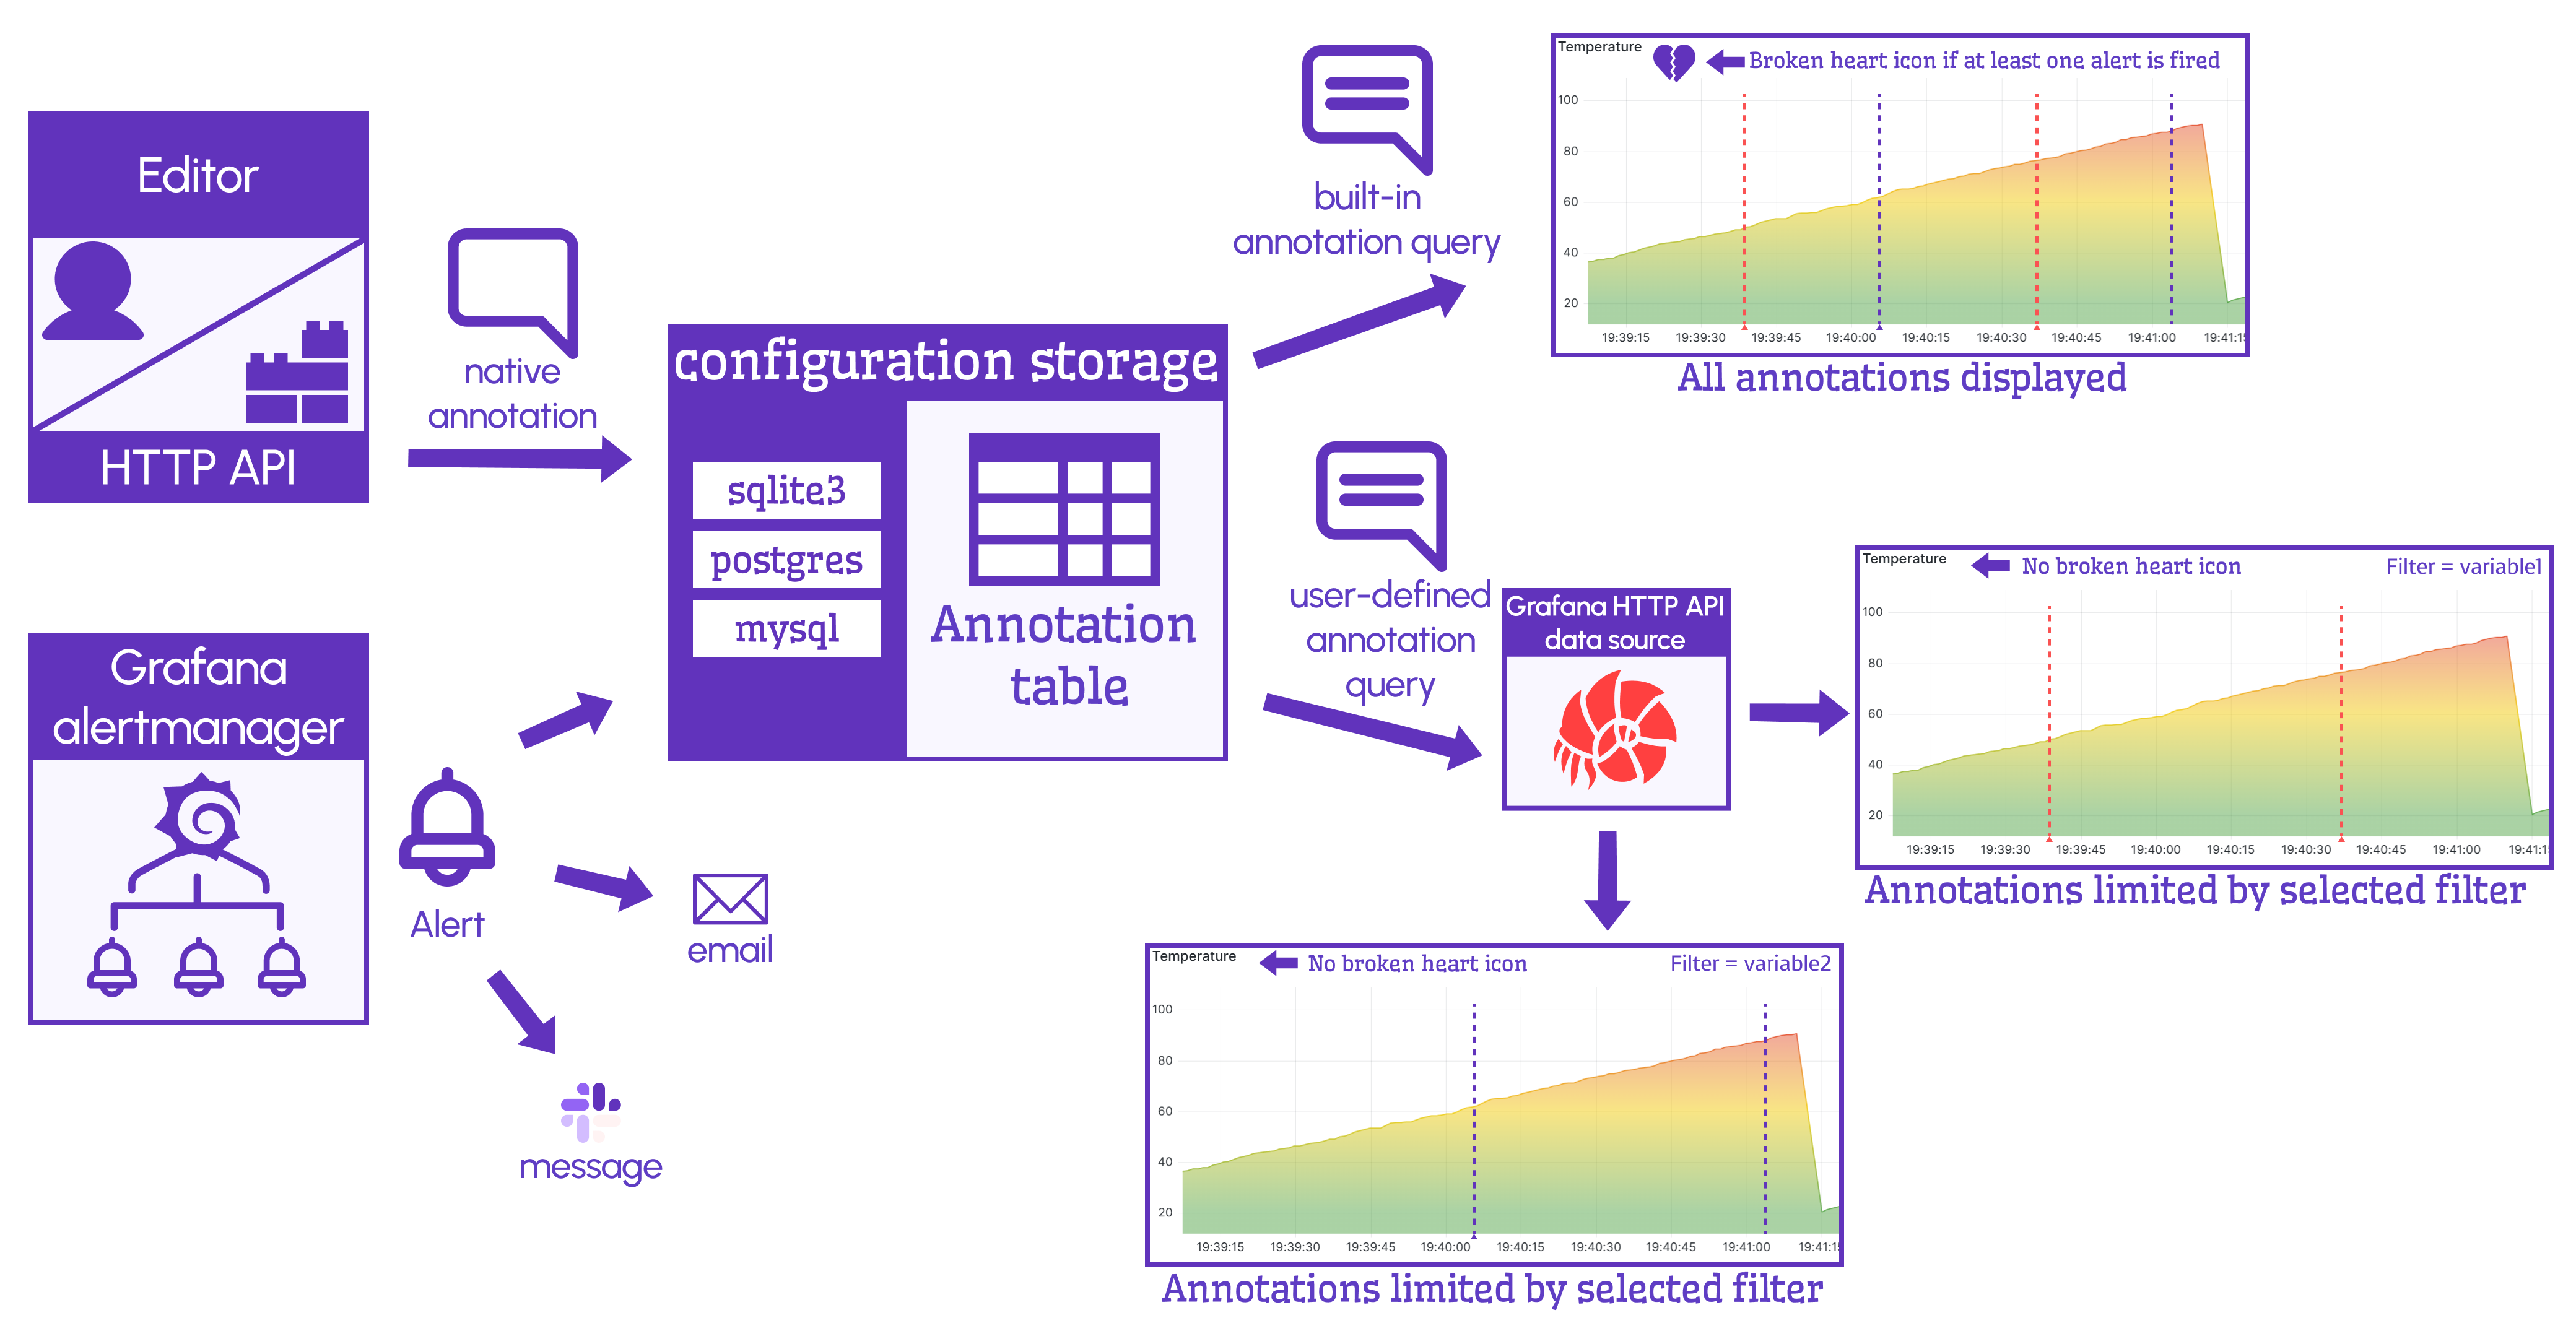
Grafana configuration database
Both alerts and native annotations are stored in the Grafana configuration database. Please, refer to another blog post where I explained in detail what that is.
In short, every Grafana needs a configuration database to capture its settings, including native annotations and alerts. If you do not configure otherwise, you will end up with sqlite3 as your configuration database. The other choices are PostgreSQL and MySQL.

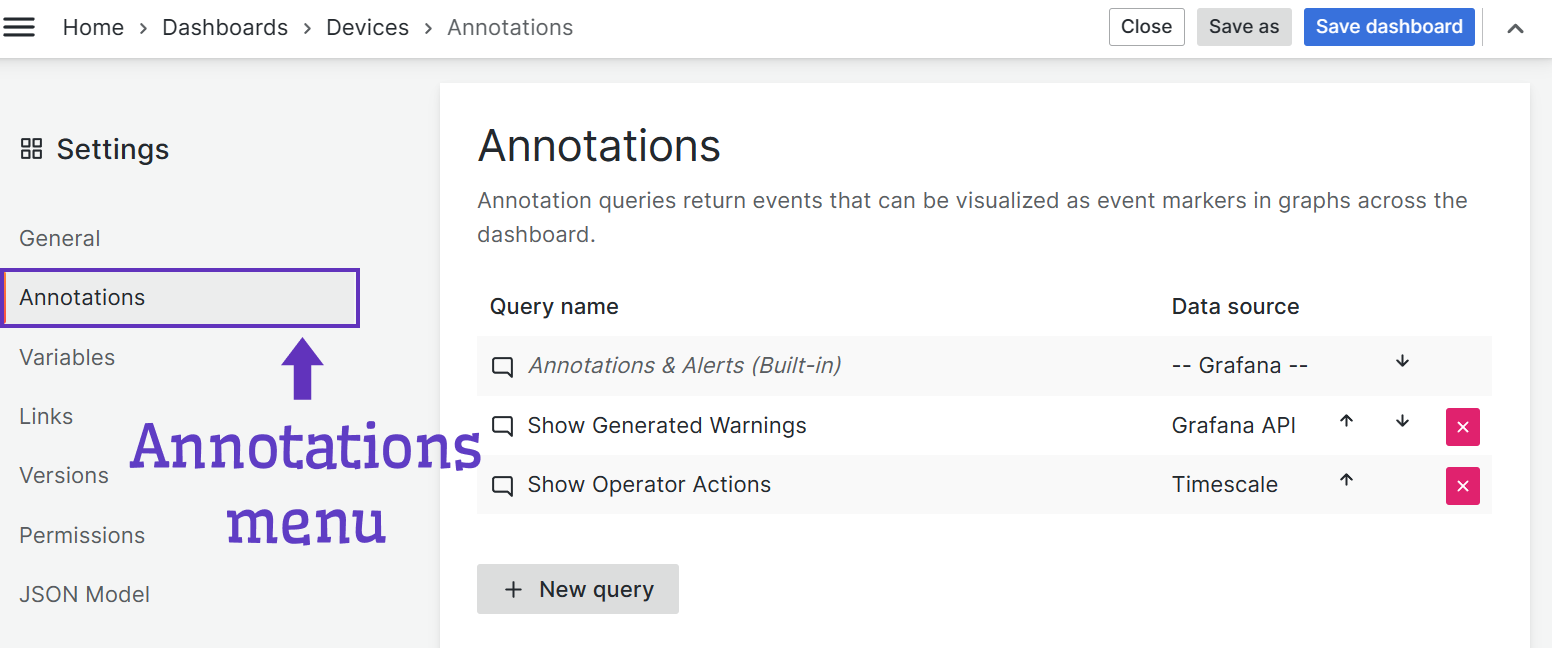
Configuration Menu
To access the configuration menu for alerts and native annotation use the 'Annotations' category of the dashboard setting menu.
To work with alert rules, go under the Alerting menu.
Annotations queries
Annotation queries are an advanced way to work with annotation records. You can store annotation records in a database like PostgreSQL or any other storage of your choice and access them using a corresponding data source.
Annotation queries could be divided into two types, built-in and user-defined.
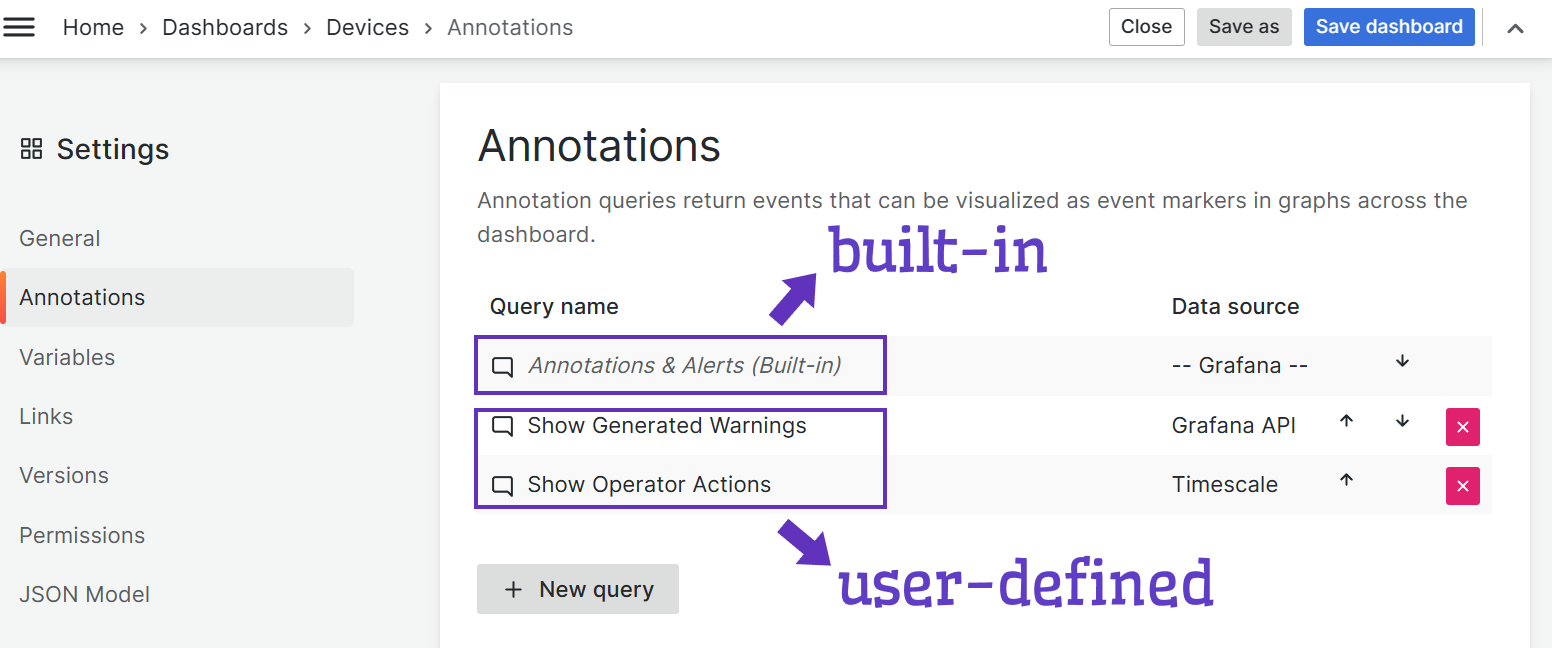
Annotations & Alerts (Built-in)
The built-in Annotation Query, is used to display native annotations, and does not provide features like filters and support for dashboard variables.
Time Series do not rely on built-in Annotations and use internal API calls to get Alert Annotations with the same limitations as built-in annotations query.
User-defined
To overcome the mentioned limitations for the built-in annotation query, we created the Business Satellite Data Source.
Business Satellite Data Source
The Business Satellite Data Source allows:
- Work with local and remote Grafana instances.
- Use API Keys or Tokens to request information from the configuration database and visualize in panels or use in annotations.
- Work with user-defined annotation types.
- Work with dashboard variables and utilize them as panel filters.
- Avoid the broken heart emoji, which is usually shown if at least one alert rule has been triggered.
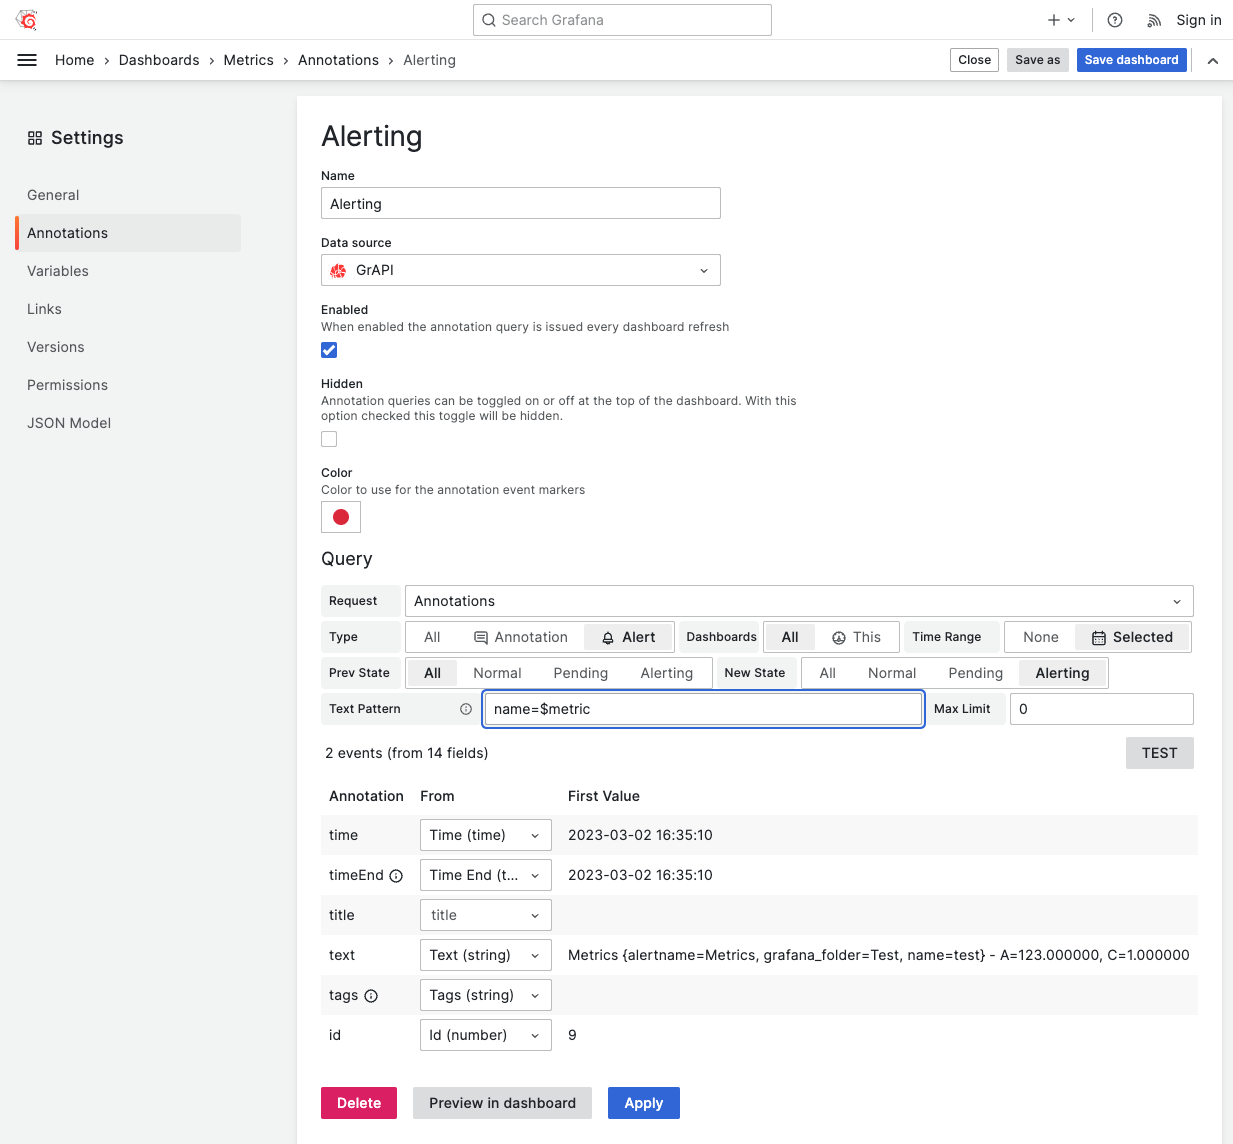
The query options where you specify which annotations to display using Business Satellite Data source look like this.
We healed a broken heart
As you know, if an alerting rule has a dashboard and panel Ids set, the Time Series panel will display the broken heart emoji. It is expected behavior for particular graphs which do not depend on the Dashboard variables.
However, when you display data points from multiple devices the broken heart emoji might be a misleading overkill. The broken heart emoji will not be displayed, but your alerts and annotations will if you use Business Satellite Data Source and configure dashboard filters.
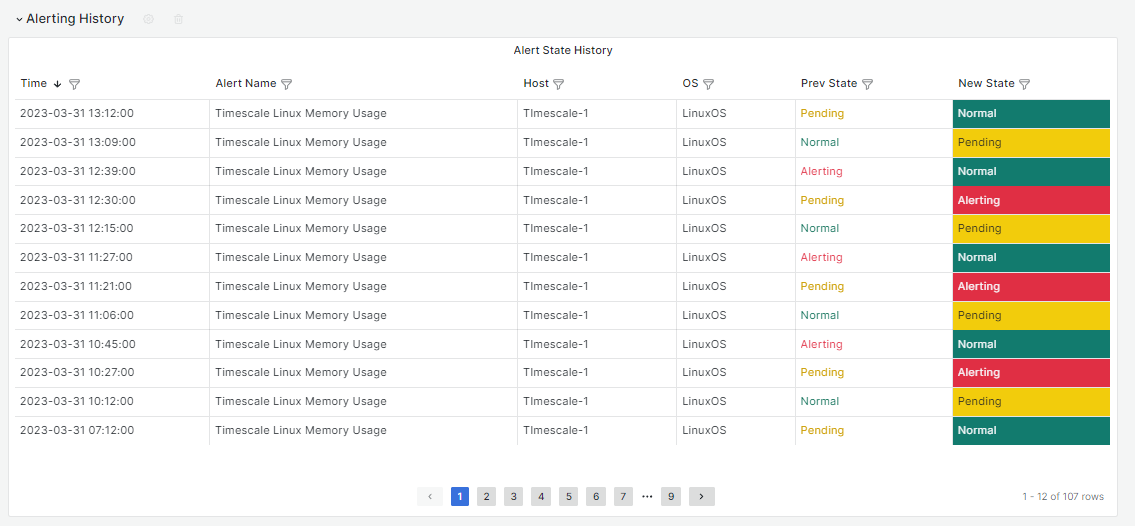
Alerting History
The Business Satellite Data Source can be used with any native or community plugin. Our community member sent us a screenshot of his alerting history for Timescale Linux memory usage over time.
Let’s Stay Connected!
Join the Conversation: Stay updated and share your thoughts! Subscribe to our YouTube Channel and leave your comments—we can’t wait to hear what you think.
Your input helps us improve, so don’t hesitate to get in touch!