Business Satellite Data Source 1.2.0

We are happy to announce the release of the Business Satellite Data Source 1.2.0. This release includes the following updates:
- Added formatted Annotation labels for Alerts.
- Added Alert Rules and Alert UID field to Alert Annotations.
- Added Variables support.
- Updated Scoped Variables for Annotations.
The plugin was updated in Grafana Catalog on March 31, 2023.
Alert labels
We added formatted Alert labels in the labels field, which can be parsed using Extract field transformation to sort, filter, and display by values.
Alert Rules and UID
Based on the alert rules Annotations will return the Alert name and UID fields. Alert UID can be used for data links to quickly direct to the rules configuration.
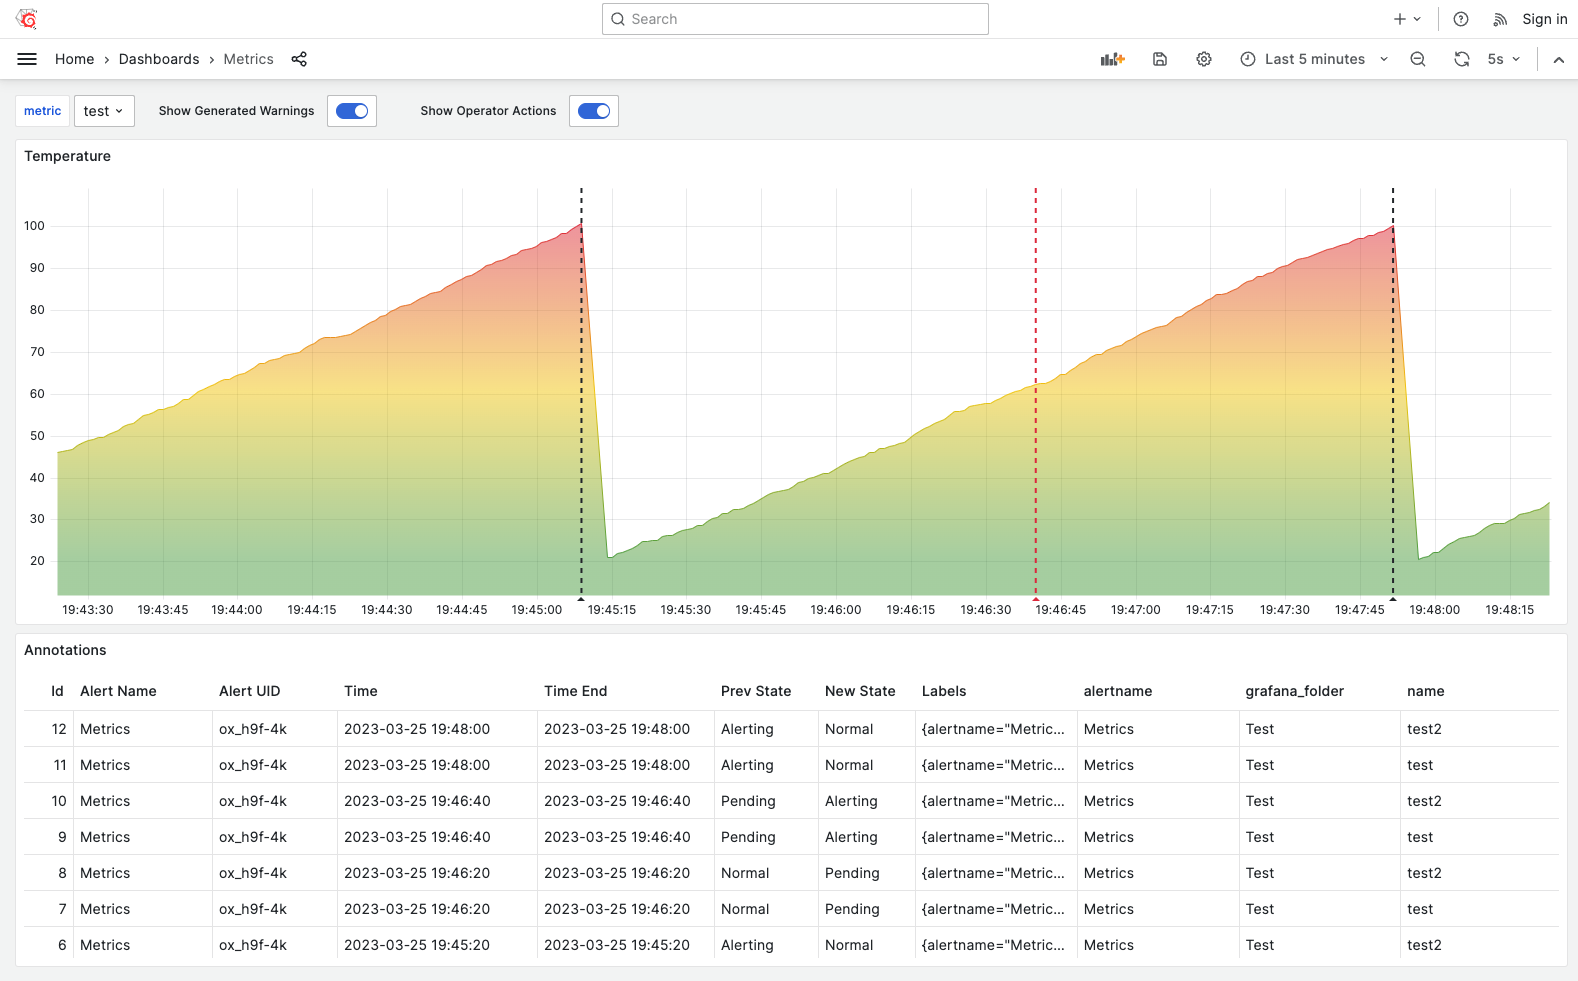
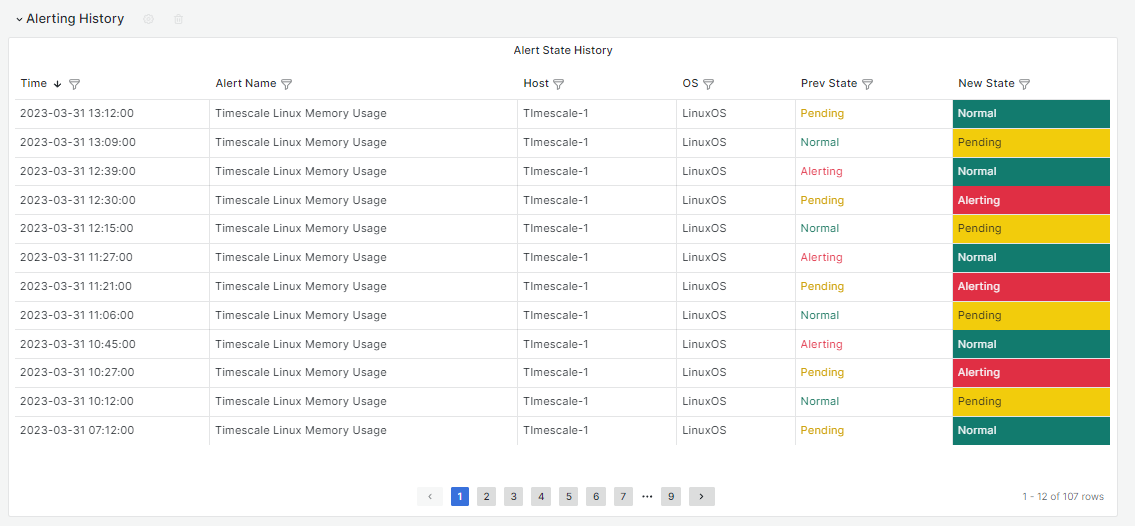
Annotations
Annotations might seem different from the Alerts, but under the hood, they are very similar. With a little help from the Business Satellite data source, you can easily work with both.
This is an introductory video for anyone interested in Grafana Alerts and Annotations.
How to and Demo
In this tutorial, we look at the concept from a data flow point of view and provide step-by-step instructions which you can follow and learn as you go.
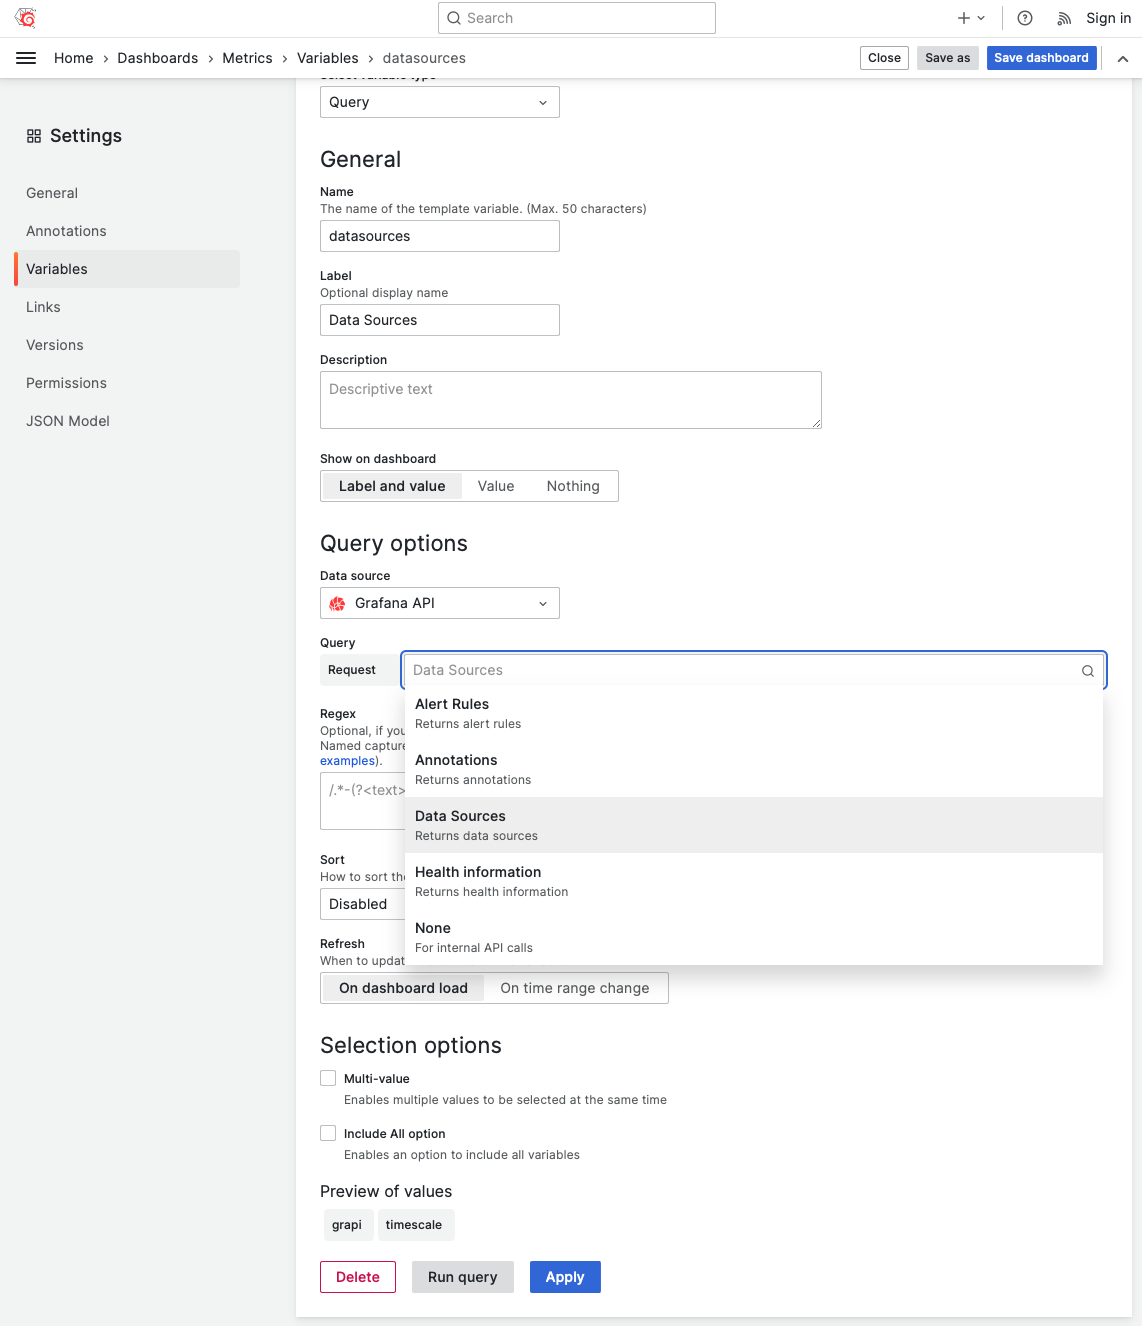
Variables support
We added initial Variables support to the data source. You can select Alert Rules, Data Sources, and Annotations by UID or text fields.
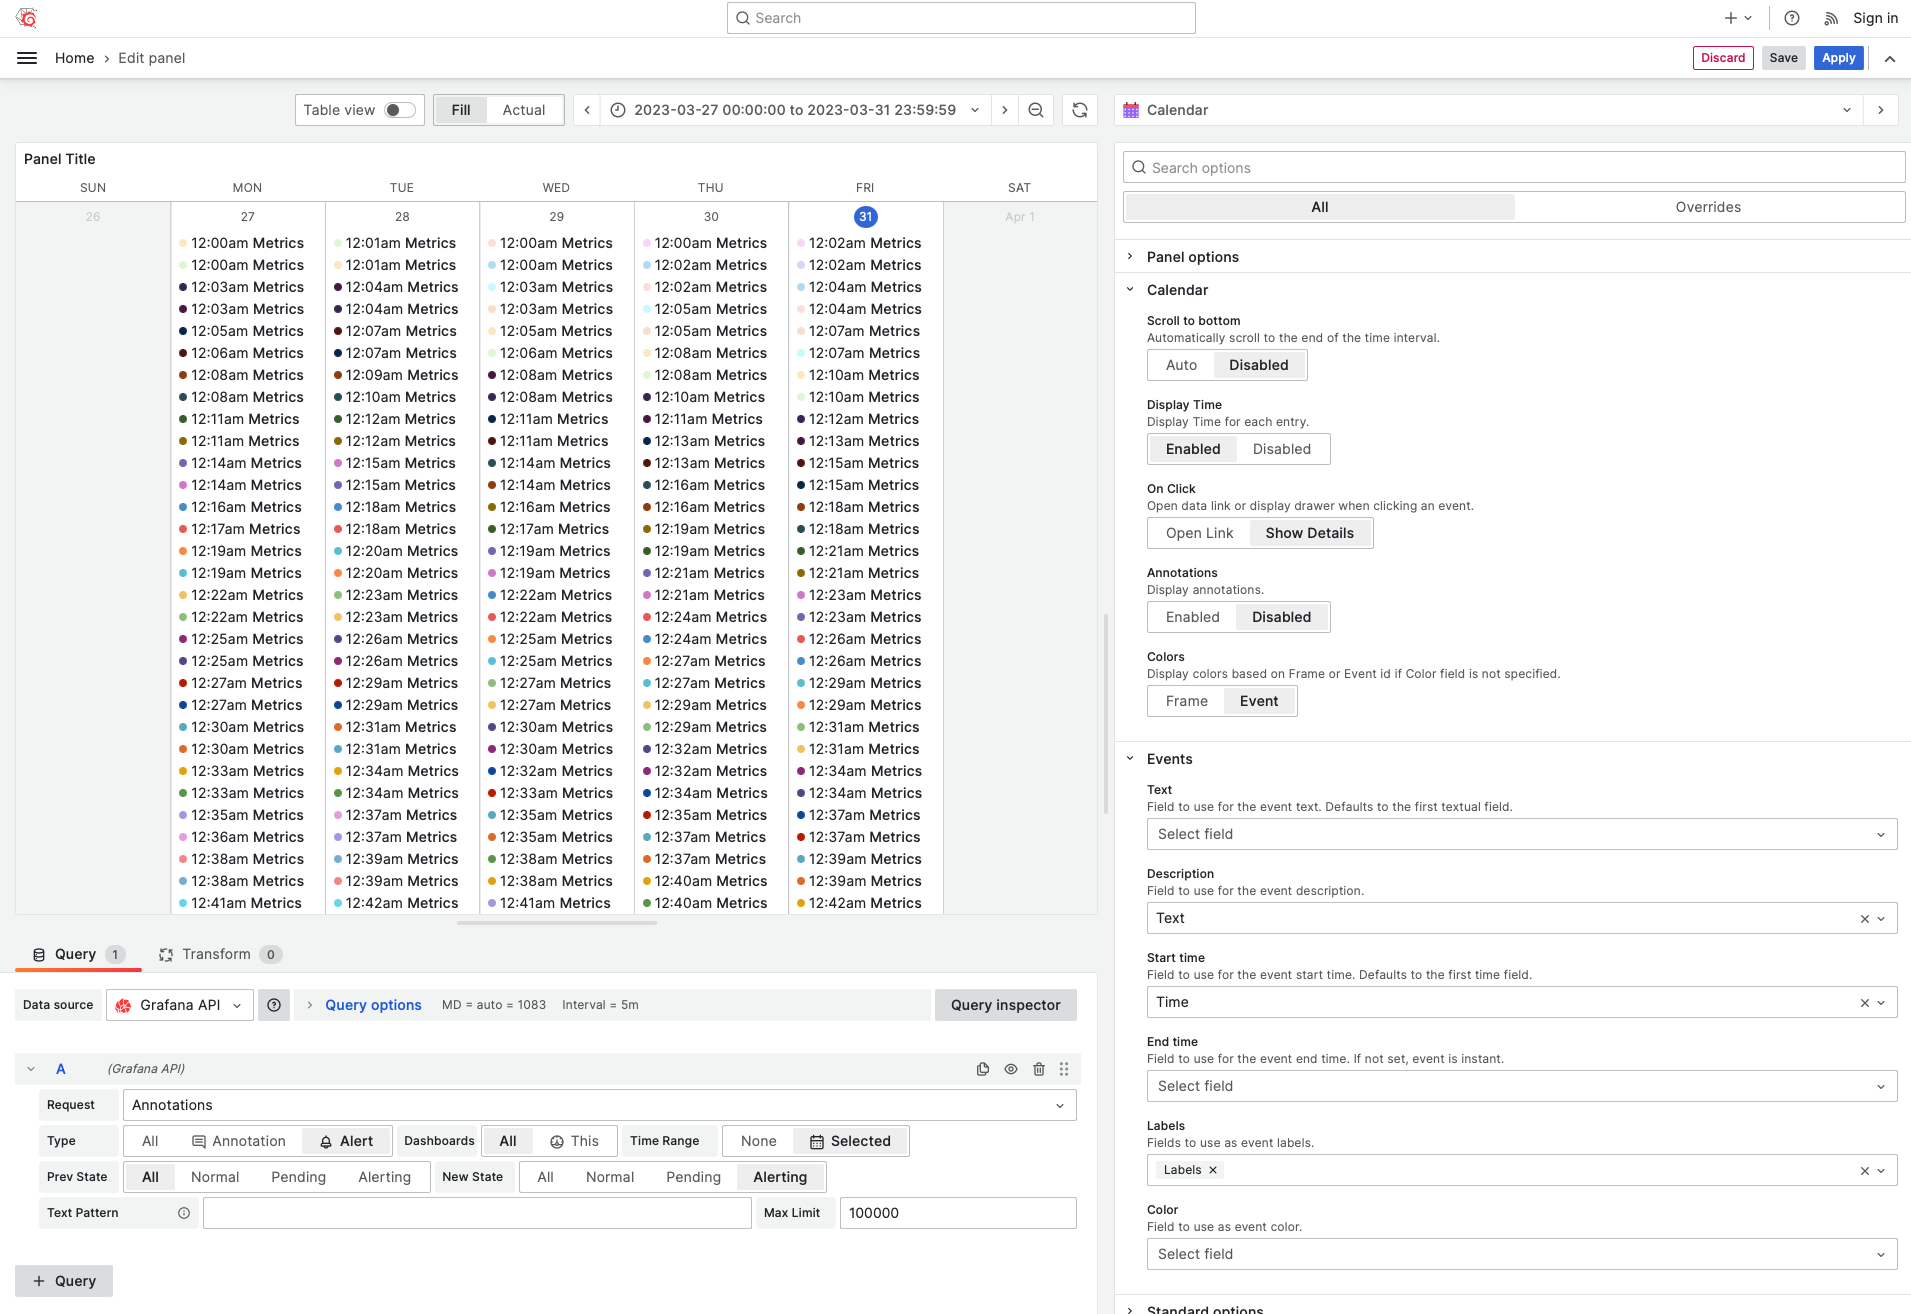
Calendar
The Business Satellite Data Source can be used together with Business Calendar panel to visualize alerts that happened in a week or month.
Getting Started
The Business Satellite Data Source can be installed from the Grafana Catalog or utilizing the Grafana command line tool.
For the latter, please use the following command.
grafana-cli plugins install volkovlabs-grapi-datasource
YouTube Tutorial
Release Notes
Features / Enhancements
- Add formatted Annotation labels for Alerts (#19)
- Update Annotation Limit to 100 by default (#19)
- Add Alert Rules and UID for Alerts Annotations (#20)
- Update Scoped Variables for Annotations (#21)
- Add Variable Support (#25)
- Update provisioning for testing Alerts (#26, #28)
- Add Annotations Tutorial (#29)
Feedback
We're looking forward to hearing from you. You can use different ways to get in touch with us.
- Ask a question, request a new feature, and file a bug with GitHub issues.
- Subscribe to our YouTube Channel and leave your comments.
- Sponsor our open source plugins for Grafana through GitHub.