Romance of documentation and blog produced a story-telling analytics


When Volkov Labs initiated multiple online channels to share our Grafana experience, we could not even think our documentation and blog would be in such grand demand.
I personally never liked what documentation is in its classic flavor. And I am not alone. No one from the problem-solving gang wants to "Learn Grafana". People who get things done need specific answers to particular questions.
That's why in December, we realized it was time to shake up the standard approach to documentation. Little did we know two months later, when we got visitors from 100+ countries.
All that time for face-lifting and organizing various READMEs, existing doc files, issues, examples and blog posts paid off with worthwhile dividends. Now we have structured educational materials with meticulously tuned web analytics on top.
We can move toward new projects while still having a firm grasp on the current web resources state, simultaneously getting little hints on what to work on next.
Blog
A year ago, we started with the idea that having a technical blog describing personal experience and development thought processes could be a viable way of telling the world who we are.
At the time, Volkov Labs did not have its platform and, indeed, outsourcing was invented by good Gods.
We chose Medium, an excellent platform for mostly technological blogging. It served us well until we studied Google Analytics and Search tools to realize that Medium competes with our flimsy (back then) documentation instead of helping.
Moreover, the obligation to follow the stylistic requirements prevents us from having one recognizable visual appearance.
Medium is a great platform. We have been and will be using it as readers to educate ourselves and stay tuned to the ever-changing technological world. However, business wit whispers to post all our materials in one place, where we have complete control over all aspects from style to analytics.
Documentation
Documentation and blog are two sides of one platform, ideally complementing each other.
Documentation is a quick WHAT and HOWTO, while blog posts range from entry-level step-by-step tutorials to groundbreaking use cases, from release notes to big announcements and other projects we are working on.
Both our blog and documentation are living things. We improve them daily following requests and questions from the community.
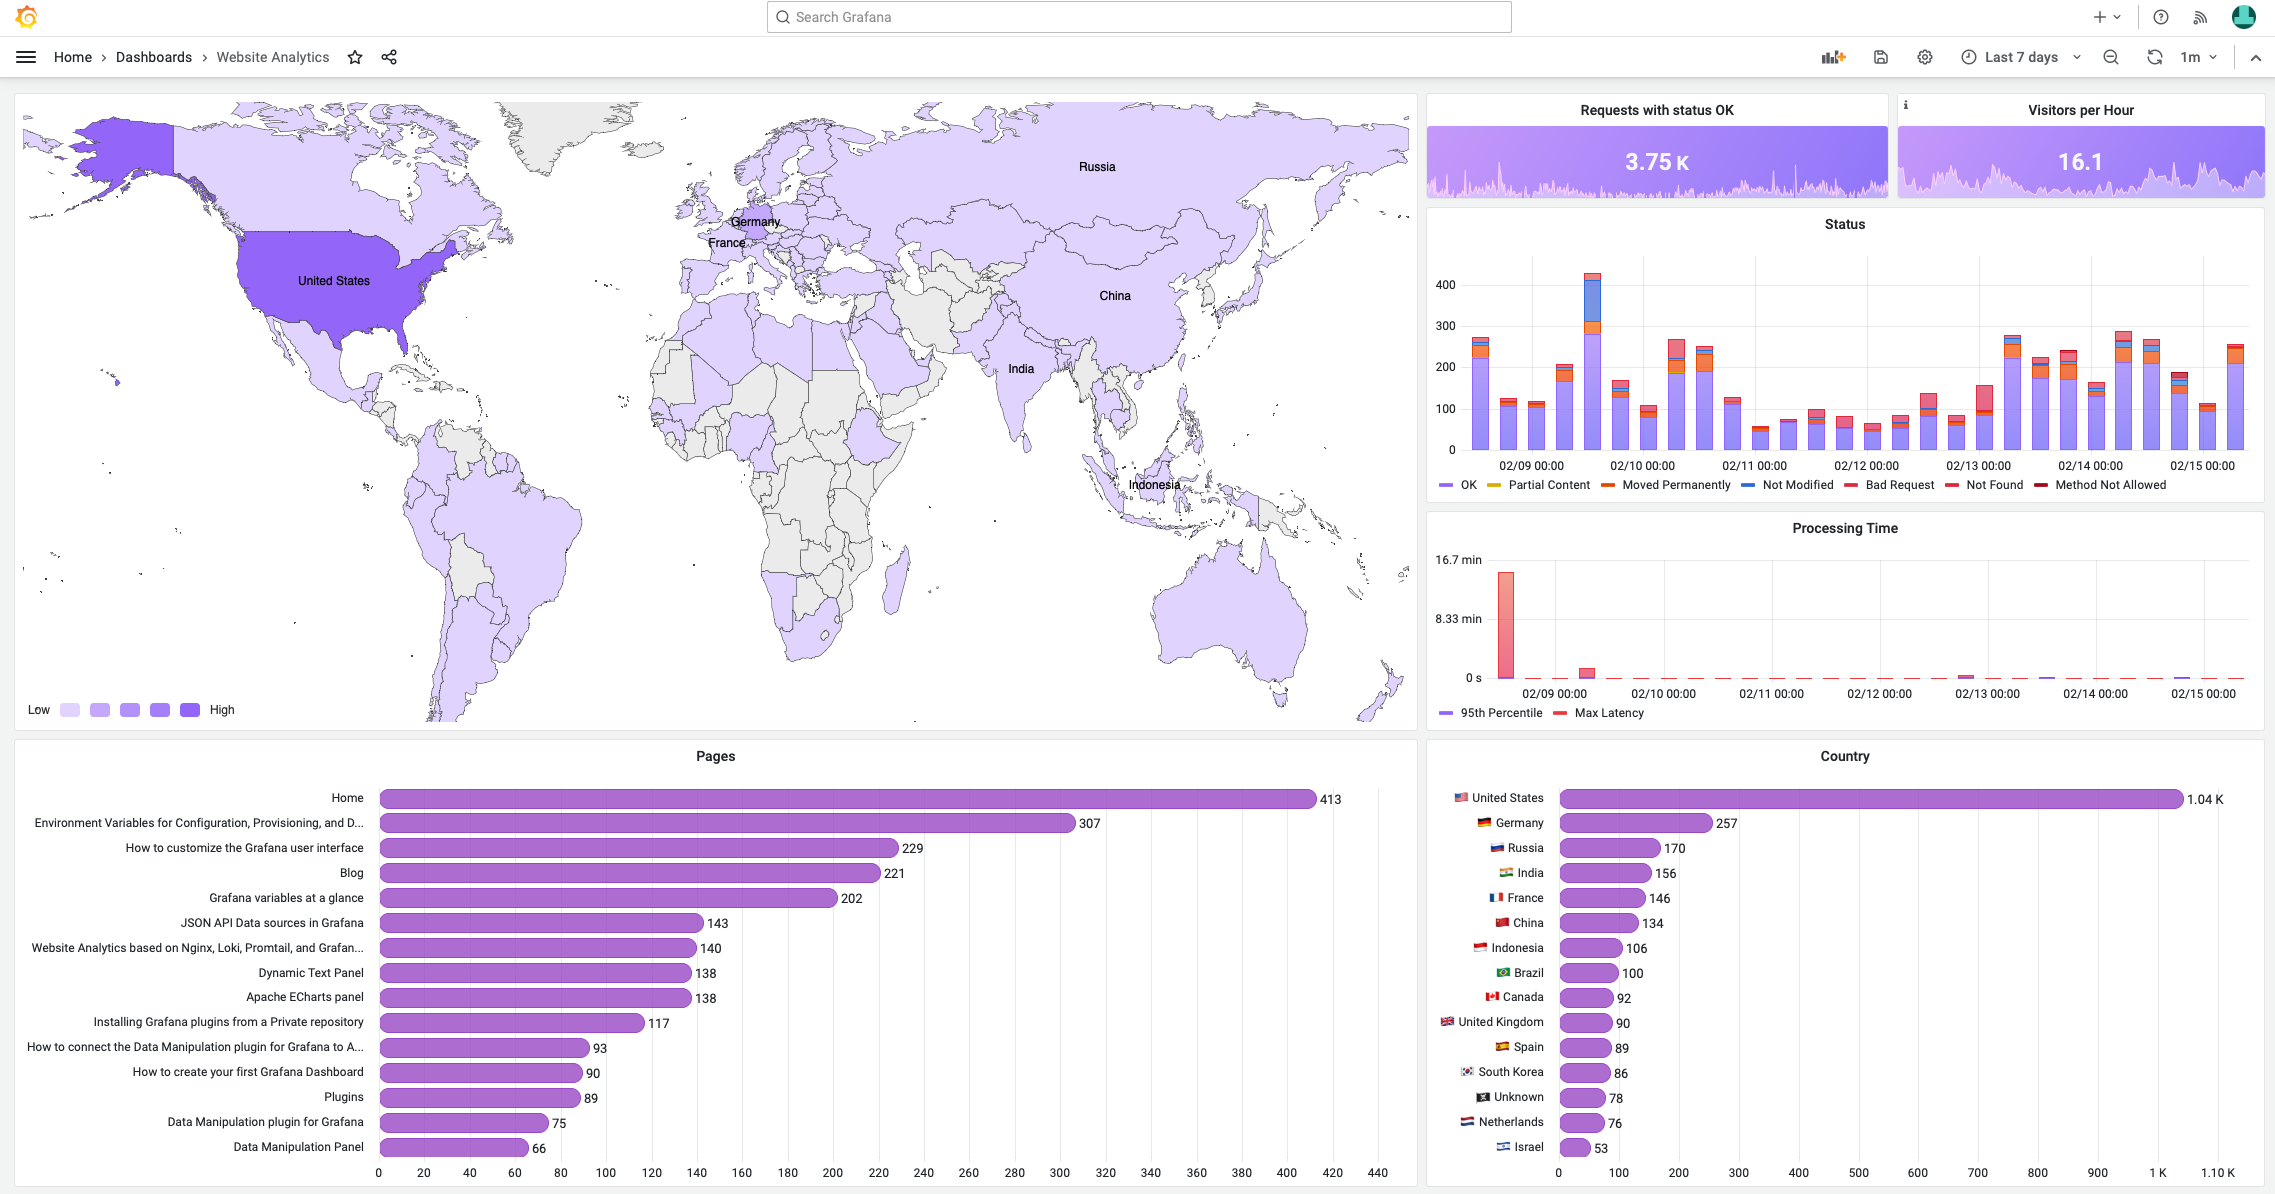
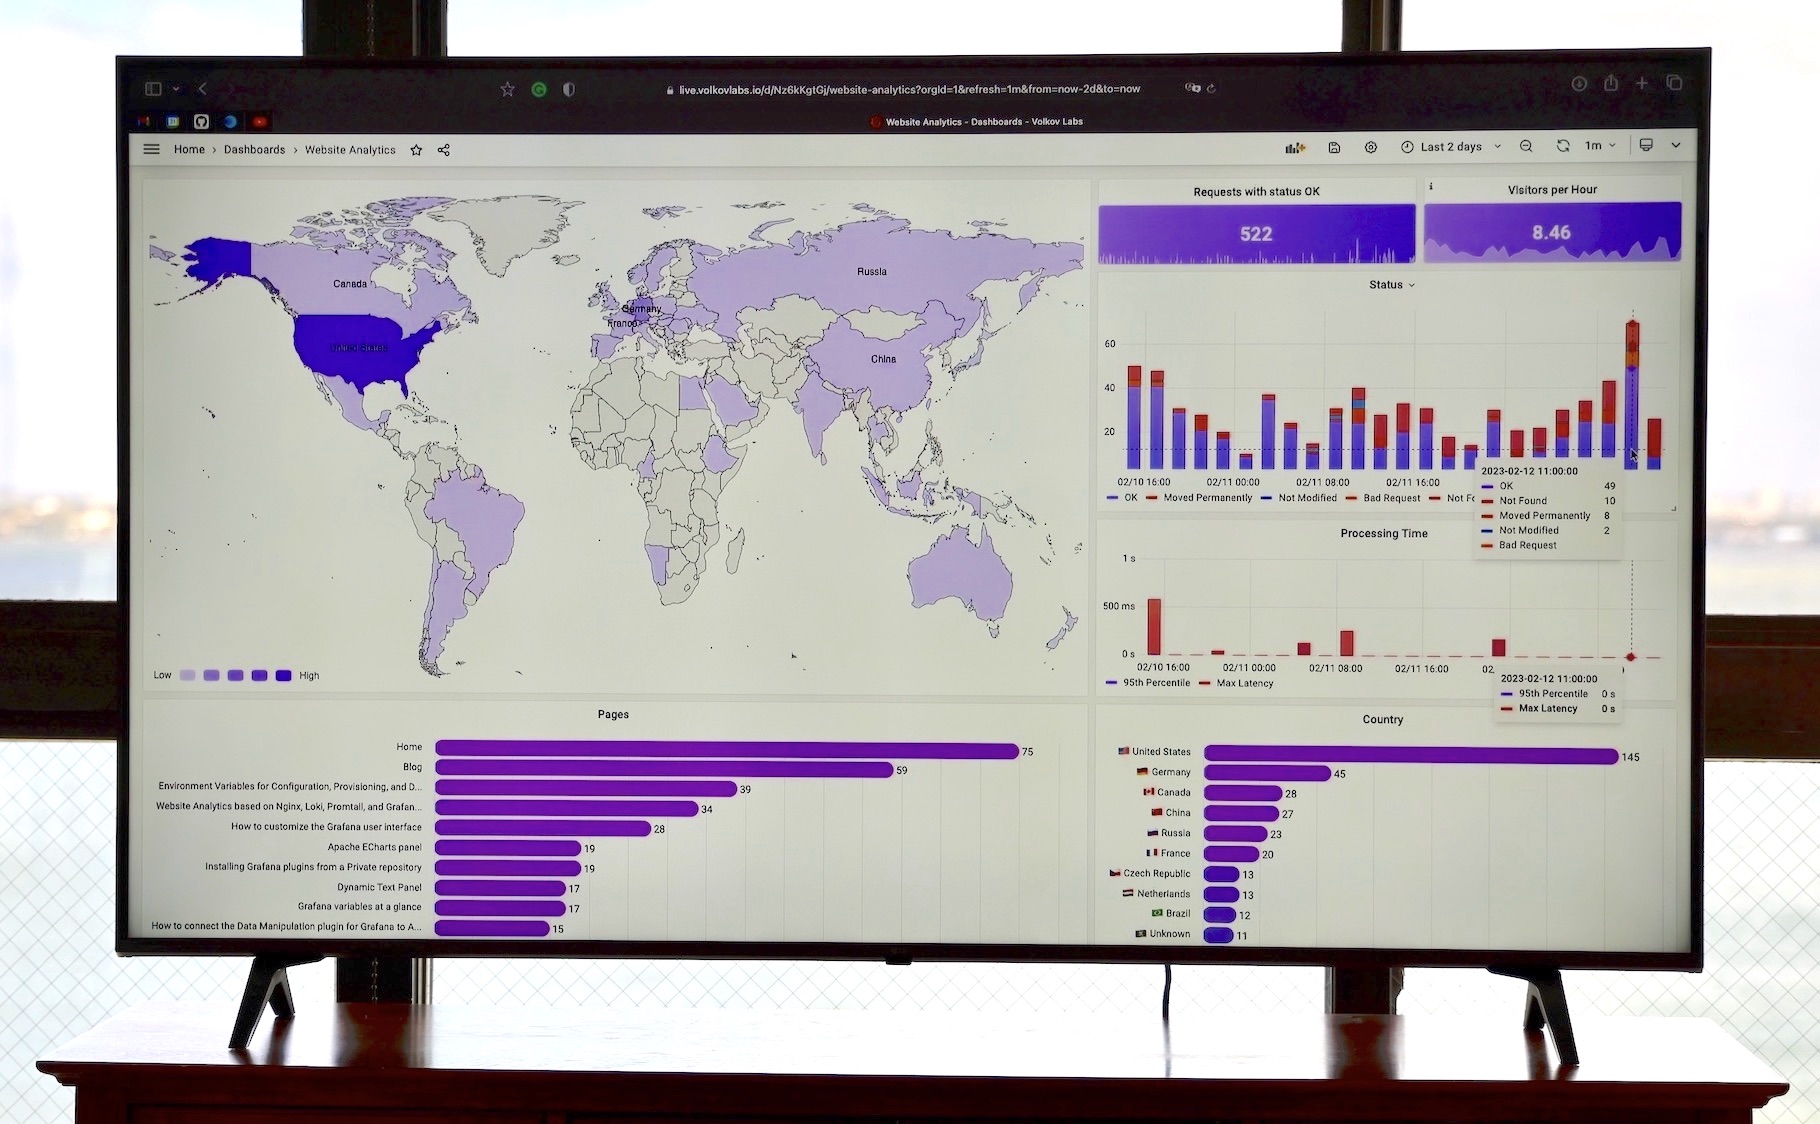
Analytics Dashboard
The analytics dashboard is on our main office display. A quick glance tells us many things.
- How many users are reading us right now.
- What countries they are from.
- If there are any delays in our responses (are we still online and responsive).
- If anyone is trying to break in.
- What is the topic that people are interested in the most?
Grafana dashboard source code
{
"annotations": {
"list": [
{
"builtIn": 1,
"datasource": {
"type": "datasource",
"uid": "grafana"
},
"enable": true,
"hide": true,
"iconColor": "rgba(0, 211, 255, 1)",
"name": "Annotations & Alerts",
"target": {
"limit": 100,
"matchAny": false,
"tags": [],
"type": "dashboard"
},
"type": "dashboard"
}
]
},
"description": "NGINX Analytics",
"editable": true,
"fiscalYearStartMonth": 0,
"gnetId": 12559,
"graphTooltip": 2,
"id": 60,
"links": [],
"liveNow": false,
"panels": [
{
"datasource": {
"type": "loki",
"uid": "XJPOAlTVz"
},
"description": "",
"gridPos": {
"h": 17,
"w": 15,
"x": 0,
"y": 0
},
"id": 14,
"interval": "5m",
"options": {
"baidu": {
"callback": "bmapReady",
"key": ""
},
"editor": {
"format": "auto",
"height": 600
},
"gaode": {
"key": "",
"plugin": "AMap.Scale,AMap.ToolBar"
},
"getOption": "const countries =\n{\n AF: \"Afghanistan\",\n AX: \"Aland Islands\",\n AL: \"Albania\",\n DZ: \"Algeria\",\n AS: \"American Samoa\",\n AD: \"Andorra\",\n AO: \"Angola\",\n AI: \"Anguilla\",\n AQ: \"Antarctica\",\n AG: \"Antigua and Barbuda\",\n AR: \"Argentina\",\n AM: \"Armenia\",\n AW: \"Aruba\",\n AU: \"Australia\",\n AT: \"Austria\",\n AZ: \"Azerbaijan\",\n BS: \"Bahamas\",\n BH: \"Bahrain\",\n BD: \"Bangladesh\",\n BB: \"Barbados\",\n BY: \"Belarus\",\n BE: \"Belgium\",\n BZ: \"Belize\",\n BJ: \"Benin\",\n BM: \"Bermuda\",\n BT: \"Bhutan\",\n BO: \"Bolivia (Plurinational State of)\",\n BQ: \"Bonaire, Sint Eustatius and Saba\",\n BA: \"Bosnia and Herzegovina\",\n BW: \"Botswana\",\n BV: \"Bouvet Island\",\n BR: \"Brazil\",\n IO: \"British Indian Ocean Territory\",\n BN: \"Brunei Darussalam\",\n BG: \"Bulgaria\",\n BF: \"Burkina Faso\",\n BI: \"Burundi\",\n CV: \"Cabo Verde\",\n KH: \"Cambodia\",\n CM: \"Cameroon\",\n CA: \"Canada\",\n KY: \"Cayman Islands\",\n CF: \"Central African Republic\",\n TD: \"Chad\",\n CL: \"Chile\",\n CN: \"China\",\n CX: \"Christmas Island\",\n CC: \"Cocos (Keeling) Islands\",\n CO: \"Colombia\",\n KM: \"Comoros\",\n CG: \"Congo\",\n CD: \"Congo (Democratic Republic of the)\",\n CK: \"Cook Islands\",\n CR: \"Costa Rica\",\n CI: \"Cote d'Ivoire\",\n HR: \"Croatia\",\n CU: \"Cuba\",\n CW: \"Curaçao\",\n CY: \"Cyprus\",\n CZ: \"Czechia\",\n DK: \"Denmark\",\n DJ: \"Djibouti\",\n DM: \"Dominica\",\n DO: \"Dominican Republic\",\n EC: \"Ecuador\",\n EG: \"Egypt\",\n SV: \"El Salvador\",\n GQ: \"Equatorial Guinea\",\n ER: \"Eritrea\",\n EE: \"Estonia\",\n SZ: \"Eswatini\",\n ET: \"Ethiopia\",\n FK: \"Falkland Islands (Malvinas)\",\n FO: \"Faroe Islands\",\n FJ: \"Fiji\",\n FI: \"Finland\",\n FR: \"France\",\n GF: \"French Guiana\",\n PF: \"French Polynesia\",\n TF: \"French Southern Territories\",\n GA: \"Gabon\",\n GM: \"Gambia\",\n GE: \"Georgia\",\n DE: \"Germany\",\n GH: \"Ghana\",\n GI: \"Gibraltar\",\n GR: \"Greece\",\n GL: \"Greenland\",\n GD: \"Grenada\",\n GP: \"Guadeloupe\",\n GU: \"Guam\",\n GT: \"Guatemala\",\n GG: \"Guernsey\",\n GN: \"Guinea\",\n GW: \"Guinea-Bissau\",\n GY: \"Guyana\",\n HT: \"Haiti\",\n HM: \"Heard Island and McDonald Islands\",\n VA: \"Holy See\",\n HN: \"Honduras\",\n HK: \"Hong Kong\",\n HU: \"Hungary\",\n IS: \"Iceland\",\n IN: \"India\",\n ID: \"Indonesia\",\n IR: \"Iran (Islamic Republic of)\",\n IQ: \"Iraq\",\n IE: \"Ireland\",\n IM: \"Isle of Man\",\n IL: \"Israel\",\n IT: \"Italy\",\n JM: \"Jamaica\",\n JP: \"Japan\",\n JE: \"Jersey\",\n JO: \"Jordan\",\n KZ: \"Kazakhstan\",\n KE: \"Kenya\",\n KI: \"Kiribati\",\n KP: \"Korea (Democratic People's Republic of)\",\n KR: \"Korea (Republic of)\",\n KW: \"Kuwait\",\n KG: \"Kyrgyzstan\",\n LA: \"Lao People's Democratic Republic\",\n LV: \"Latvia\",\n LB: \"Lebanon\",\n LS: \"Lesotho\",\n LR: \"Liberia\",\n LY: \"Libya\",\n LI: \"Liechtenstein\",\n LT: \"Lithuania\",\n LU: \"Luxembourg\",\n MO: \"Macao\",\n MG: \"Madagascar\",\n MW: \"Malawi\",\n MY: \"Malaysia\",\n MV: \"Maldives\",\n ML: \"Mali\",\n MT: \"Malta\",\n MH: \"Marshall Islands\",\n MQ: \"Martinique\",\n MR: \"Mauritania\",\n MU: \"Mauritius\",\n YT: \"Mayotte\",\n MX: \"Mexico\",\n FM: \"Micronesia (Federated States of)\",\n MD: \"Moldova (Republic of)\",\n MC: \"Monaco\",\n MN: \"Mongolia\",\n ME: \"Montenegro\",\n MS: \"Montserrat\",\n MA: \"Morocco\",\n MZ: \"Mozambique\",\n MM: \"Myanmar\",\n NA: \"Namibia\",\n NR: \"Nauru\",\n NP: \"Nepal\",\n NL: \"Netherlands\",\n NC: \"New Caledonia\",\n NZ: \"New Zealand\",\n NI: \"Nicaragua\",\n NE: \"Niger\",\n NG: \"Nigeria\",\n NU: \"Niue\",\n NF: \"Norfolk Island\",\n MK: \"North Macedonia\",\n MP: \"Northern Mariana Islands\",\n NO: \"Norway\",\n OM: \"Oman\",\n PK: \"Pakistan\",\n PW: \"Palau\",\n PS: \"Palestine, State of\",\n PA: \"Panama\",\n PG: \"Papua New Guinea\",\n PY: \"Paraguay\",\n PE: \"Peru\",\n PH: \"Philippines\",\n PN: \"Pitcairn\",\n PL: \"Poland\",\n PT: \"Portugal\",\n PR: \"Puerto Rico\",\n QA: \"Qatar\",\n RE: \"Reunion\",\n RO: \"Romania\",\n RU: \"Russia\",\n RW: \"Rwanda\",\n BL: \"Saint Barthelemy\",\n SH: \"Saint Helena, Ascension and Tristan da Cunha\",\n KN: \"Saint Kitts and Nevis\",\n LC: \"Saint Lucia\",\n MF: \"Saint Martin (French Part)\",\n PM: \"Saint Pierre and Miquelon\",\n VC: \"Saint Vincent and the Grenadines\",\n WS: \"Samoa\",\n SM: \"San Marino\",\n ST: \"Sao Tome and Principe\",\n SA: \"Saudi Arabia\",\n SN: \"Senegal\",\n RS: \"Serbia\",\n SC: \"Seychelles\",\n SL: \"Sierra Leone\",\n SG: \"Singapore\",\n SX: \"Sint Maarten (Dutch Part)\",\n SK: \"Slovakia\",\n SI: \"Slovenia\",\n SB: \"Solomon Islands\",\n SO: \"Somalia\",\n ZA: \"South Africa\",\n GS: \"South Georgia and the South Sandwich Islands\",\n SS: \"South Sudan\",\n ES: \"Spain\",\n LK: \"Sri Lanka\",\n SD: \"Sudan\",\n SR: \"Suriname\",\n SJ: \"Svalbard and Jan Mayen\",\n SE: \"Sweden\",\n CH: \"Switzerland\",\n SY: \"Syrian Arab Republic\",\n TW: \"Taiwan (Province of China)\",\n TJ: \"Tajikistan\",\n TZ: \"Tanzania, United Republic of\",\n TH: \"Thailand\",\n TL: \"Timor-Leste\",\n TG: \"Togo\",\n TK: \"Tokelau\",\n TO: \"Tonga\",\n TT: \"Trinidad and Tobago\",\n TN: \"Tunisia\",\n TR: \"Turkey\",\n TM: \"Turkmenistan\",\n TC: \"Turks and Caicos Islands\",\n TV: \"Tuvalu\",\n UG: \"Uganda\",\n UA: \"Ukraine\",\n AE: \"United Arab Emirates\",\n GB: \"United Kingdom\",\n UM: \"United States Minor Outlying Islands\",\n US: \"United States\",\n UY: \"Uruguay\",\n UZ: \"Uzbekistan\",\n VU: \"Vanuatu\",\n VE: \"Venezuela (Bolivarian Republic of)\",\n VN: \"Viet Nam\",\n VG: \"Virgin Islands (British)\",\n VI: \"Virgin Islands (U.S.)\",\n WF: \"Wallis and Futuna\",\n EH: \"Western Sahara\",\n YE: \"Yemen\",\n ZM: \"Zambia\",\n ZW: \"Zimbabwe\"\n}\n\nconst requests = data.series.map((s) => {\n const names = s.fields.find((f) => f.name === \"Metric\").values.buffer;\n const values = s.fields.find((f) => f.name === \"Value (sum)\").values.buffer;\n\n return names.map((name, i) => {\n return { name: countries[name], value: values[i] }\n });\n})[0];\n\nconst min = Math.min(...requests.map(o => o.value));\nconst max = Math.max(...requests.map(o => o.value));\nconst labelValue = max / 10;\n\nreturn {\n animation: true,\n backgroundColor: 'transparent',\n tooltip: {\n trigger: 'item',\n },\n visualMap: {\n bottom: 'bottom',\n \"type\": \"piecewise\",\n \"orient\": \"horizontal\",\n min,\n max,\n text: ['High', 'Low'],\n calculable: true,\n inRange: {\n color: [\n '#e4d8fd',\n '#c1a4fb',\n '#b593fa',\n '#9d70f9'\n ]\n }\n },\n series: [\n {\n left: 0,\n right: 0,\n name: 'Requests',\n type: 'map',\n roam: false,\n map: 'world',\n label: {\n show: true,\n formatter: function (d) {\n if (!d.data || d.data.value <= labelValue) {\n return '';\n }\n\n return d.name;\n }\n },\n emphasis: {\n itemStyle: {\n areaColor: '#FF5656'\n },\n label: {\n show: true,\n }\n },\n data: requests\n }\n ]\n};\n",
"google": {
"callback": "gmapReady",
"key": ""
},
"map": "json",
"renderer": "canvas"
},
"pluginVersion": "9.3.6",
"targets": [
{
"datasource": {
"type": "loki",
"uid": "XJPOAlTVz"
},
"editorMode": "code",
"expr": "sum by (geoip_country_code) (count_over_time({host=~\"$host\"} | json | status = 200 [$__interval]))",
"legendFormat": "{{geoip_country_code}}",
"queryType": "range",
"refId": "A"
}
],
"transformations": [
{
"id": "seriesToRows",
"options": {}
},
{
"id": "groupBy",
"options": {
"fields": {
"Metric": {
"aggregations": [],
"operation": "groupby"
},
"Value": {
"aggregations": ["sum"],
"operation": "aggregate"
}
}
}
}
],
"type": "volkovlabs-echarts-panel"
},
{
"datasource": {
"type": "loki",
"uid": "XJPOAlTVz"
},
"description": "",
"fieldConfig": {
"defaults": {
"color": {
"mode": "thresholds"
},
"mappings": [],
"min": 0,
"thresholds": {
"mode": "absolute",
"steps": [
{
"color": "#9d70f9",
"value": null
}
]
},
"unit": "short"
},
"overrides": []
},
"gridPos": {
"h": 3,
"w": 5,
"x": 15,
"y": 0
},
"hideTimeOverride": false,
"id": 4,
"interval": "5m",
"options": {
"colorMode": "background",
"graphMode": "area",
"justifyMode": "center",
"orientation": "auto",
"reduceOptions": {
"calcs": ["sum"],
"fields": "",
"values": false
},
"text": {},
"textMode": "value"
},
"pluginVersion": "9.3.6",
"targets": [
{
"datasource": {
"type": "loki",
"uid": "XJPOAlTVz"
},
"editorMode": "code",
"expr": "sum by(host) (count_over_time({host=~\"$host\"} | json | status = 200 [$__interval])) ",
"legendFormat": "{{host}}",
"queryType": "range",
"refId": "A"
}
],
"title": "Requests with status OK",
"transformations": [],
"type": "stat"
},
{
"datasource": {
"type": "loki",
"uid": "XJPOAlTVz"
},
"description": "Different IP addresses",
"fieldConfig": {
"defaults": {
"color": {
"mode": "thresholds"
},
"mappings": [],
"min": 0,
"thresholds": {
"mode": "absolute",
"steps": [
{
"color": "#9d70f9",
"value": null
}
]
},
"unit": "short"
},
"overrides": []
},
"gridPos": {
"h": 3,
"w": 4,
"x": 20,
"y": 0
},
"id": 22,
"interval": "1h",
"options": {
"colorMode": "background",
"graphMode": "area",
"justifyMode": "auto",
"orientation": "auto",
"reduceOptions": {
"calcs": ["mean"],
"fields": "",
"values": false
},
"text": {},
"textMode": "value"
},
"pluginVersion": "9.3.6",
"targets": [
{
"datasource": {
"type": "loki",
"uid": "XJPOAlTVz"
},
"editorMode": "code",
"expr": "count(sum by (remote_addr) (count_over_time({host=~\"$host\"} | json | status = 200 [$__interval])))",
"instant": true,
"legendFormat": "",
"queryType": "range",
"range": false,
"refId": "A"
}
],
"title": "Visitors per Hour",
"transformations": [],
"type": "stat"
},
{
"datasource": {
"type": "loki",
"uid": "XJPOAlTVz"
},
"description": "",
"fieldConfig": {
"defaults": {
"color": {
"mode": "palette-classic"
},
"custom": {
"axisCenteredZero": false,
"axisColorMode": "text",
"axisLabel": "",
"axisPlacement": "auto",
"barAlignment": 0,
"drawStyle": "bars",
"fillOpacity": 75,
"gradientMode": "hue",
"hideFrom": {
"graph": false,
"legend": false,
"tooltip": false,
"viz": false
},
"lineInterpolation": "smooth",
"lineWidth": 1,
"pointSize": 5,
"scaleDistribution": {
"type": "linear"
},
"showPoints": "never",
"spanNulls": true,
"stacking": {
"group": "A",
"mode": "normal"
},
"thresholdsStyle": {
"mode": "off"
}
},
"decimals": 0,
"mappings": [],
"thresholds": {
"mode": "absolute",
"steps": [
{
"color": "green",
"value": null
},
{
"color": "red",
"value": 80
}
]
},
"unit": "short"
},
"overrides": [
{
"matcher": {
"id": "byName",
"options": "Moved Permanently"
},
"properties": [
{
"id": "color",
"value": {
"fixedColor": "dark-orange",
"mode": "fixed"
}
}
]
},
{
"matcher": {
"id": "byName",
"options": "OK"
},
"properties": [
{
"id": "color",
"value": {
"fixedColor": "#9d70f9",
"mode": "fixed"
}
}
]
},
{
"matcher": {
"id": "byName",
"options": "Not Found"
},
"properties": [
{
"id": "color",
"value": {
"fixedColor": "red",
"mode": "fixed"
}
}
]
},
{
"matcher": {
"id": "byName",
"options": "Method Not Allowed"
},
"properties": [
{
"id": "color",
"value": {
"fixedColor": "dark-red",
"mode": "fixed"
}
}
]
},
{
"matcher": {
"id": "byName",
"options": "Not Modified"
},
"properties": [
{
"id": "color",
"value": {
"fixedColor": "blue",
"mode": "fixed"
}
}
]
}
]
},
"gridPos": {
"h": 8,
"w": 9,
"x": 15,
"y": 3
},
"id": 26,
"interval": "5m",
"maxDataPoints": 24,
"options": {
"legend": {
"calcs": [],
"displayMode": "list",
"placement": "bottom",
"showLegend": true
},
"tooltip": {
"mode": "multi",
"sort": "desc"
}
},
"pluginVersion": "8.0.0-beta3",
"targets": [
{
"datasource": {
"type": "loki",
"uid": "XJPOAlTVz"
},
"editorMode": "code",
"expr": "sum by (status) (count_over_time({host=~\"$host\"} | json [$__interval]))",
"legendFormat": "{{status}}",
"queryType": "range",
"refId": "A"
}
],
"title": "Status",
"transformations": [
{
"id": "joinByField",
"options": {
"byField": "Time",
"mode": "outer"
}
},
{
"id": "organize",
"options": {
"excludeByName": {},
"indexByName": {},
"renameByName": {
"200": "OK",
"206": "Partial Content",
"301": "Moved Permanently",
"304": "Not Modified",
"400": "Bad Request",
"404": "Not Found",
"405": "Method Not Allowed"
}
}
}
],
"type": "timeseries"
},
{
"datasource": {
"type": "loki",
"uid": "XJPOAlTVz"
},
"description": "",
"fieldConfig": {
"defaults": {
"color": {
"fixedColor": "#9d70f9",
"mode": "fixed"
},
"custom": {
"axisCenteredZero": false,
"axisColorMode": "text",
"axisLabel": "",
"axisPlacement": "auto",
"axisSoftMax": 1,
"barAlignment": 0,
"drawStyle": "bars",
"fillOpacity": 75,
"gradientMode": "hue",
"hideFrom": {
"legend": false,
"tooltip": false,
"viz": false
},
"lineInterpolation": "smooth",
"lineWidth": 1,
"pointSize": 5,
"scaleDistribution": {
"type": "linear"
},
"showPoints": "never",
"spanNulls": true,
"stacking": {
"group": "A",
"mode": "none"
},
"thresholdsStyle": {
"mode": "off"
}
},
"mappings": [],
"thresholds": {
"mode": "absolute",
"steps": [
{
"color": "green",
"value": null
}
]
},
"unit": "s"
},
"overrides": [
{
"matcher": {
"id": "byName",
"options": "Max Latency"
},
"properties": [
{
"id": "color",
"value": {
"fixedColor": "#eb4444",
"mode": "fixed"
}
}
]
}
]
},
"gridPos": {
"h": 6,
"w": 9,
"x": 15,
"y": 11
},
"id": 16,
"interval": "5m",
"maxDataPoints": 24,
"options": {
"legend": {
"calcs": [],
"displayMode": "list",
"placement": "bottom",
"showLegend": true
},
"tooltip": {
"mode": "multi",
"sort": "desc"
}
},
"pluginVersion": "9.3.6",
"targets": [
{
"datasource": {
"type": "loki",
"uid": "XJPOAlTVz"
},
"editorMode": "code",
"expr": "quantile_over_time(0.95,{host=~\"$host\"} | json | unwrap request_time [$__interval]) by (host)",
"legendFormat": "95th Percentile",
"queryType": "range",
"refId": "C"
},
{
"datasource": {
"type": "loki",
"uid": "XJPOAlTVz"
},
"editorMode": "code",
"expr": "max by (host) (max_over_time({host=~\"$host\"} | json | unwrap request_time [$__interval]))",
"legendFormat": "Max Latency",
"queryType": "range",
"refId": "D"
}
],
"title": "Processing Time",
"type": "timeseries"
},
{
"datasource": {
"type": "loki",
"uid": "XJPOAlTVz"
},
"description": "",
"fieldConfig": {
"defaults": {
"color": {
"mode": "continuous-BlPu"
},
"custom": {
"axisCenteredZero": false,
"axisColorMode": "text",
"axisLabel": "",
"axisPlacement": "auto",
"fillOpacity": 80,
"gradientMode": "none",
"hideFrom": {
"legend": false,
"tooltip": false,
"viz": false
},
"lineWidth": 1,
"scaleDistribution": {
"type": "linear"
},
"thresholdsStyle": {
"mode": "off"
}
},
"mappings": [
{
"options": {
"/": {
"index": 0,
"text": "Home"
},
"/blog/": {
"index": 1,
"text": "Blog"
}
},
"type": "value"
}
],
"thresholds": {
"mode": "absolute",
"steps": [
{
"color": "green",
"value": null
}
]
},
"unit": "short"
},
"overrides": []
},
"gridPos": {
"h": 12,
"w": 15,
"x": 0,
"y": 17
},
"id": 24,
"interval": "5m",
"options": {
"barRadius": 0.5,
"barWidth": 0.8,
"colorByField": "Value (sum)",
"groupWidth": 0.7,
"legend": {
"calcs": [],
"displayMode": "list",
"placement": "bottom",
"showLegend": false
},
"orientation": "horizontal",
"showValue": "auto",
"stacking": "none",
"tooltip": {
"mode": "none",
"sort": "none"
},
"xField": "Metric",
"xTickLabelMaxLength": 60,
"xTickLabelRotation": 0,
"xTickLabelSpacing": 0
},
"pluginVersion": "9.3.6",
"targets": [
{
"datasource": {
"type": "loki",
"uid": "XJPOAlTVz"
},
"editorMode": "code",
"expr": "sum by (request_uri) (count_over_time({host=~\"$host\"} | json | status = 200 [$__interval]))",
"legendFormat": "{{request_uri}}",
"queryType": "range",
"refId": "A"
}
],
"title": "Pages",
"transformations": [
{
"id": "seriesToRows",
"options": {}
},
{
"id": "groupBy",
"options": {
"fields": {
"Metric": {
"aggregations": [],
"operation": "groupby"
},
"Value": {
"aggregations": ["sum"],
"operation": "aggregate"
}
}
}
},
{
"id": "sortBy",
"options": {
"fields": {},
"sort": [
{
"desc": true,
"field": "Value (sum)"
}
]
}
},
{
"id": "limit",
"options": {
"limitField": 15
}
}
],
"type": "barchart"
},
{
"datasource": {
"type": "datasource",
"uid": "-- Dashboard --"
},
"description": "",
"fieldConfig": {
"defaults": {
"color": {
"mode": "continuous-BlPu"
},
"custom": {
"axisCenteredZero": false,
"axisColorMode": "text",
"axisLabel": "",
"axisPlacement": "auto",
"fillOpacity": 80,
"gradientMode": "hue",
"hideFrom": {
"legend": false,
"tooltip": false,
"viz": false
},
"lineWidth": 1,
"scaleDistribution": {
"type": "linear"
},
"thresholdsStyle": {
"mode": "off"
}
},
"mappings": [
{
"options": {
"AD": {
"index": 1,
"text": "🇦🇩 Andorra"
},
"AE": {
"index": 2,
"text": "🇦🇪 United Arab Emirates"
},
"AF": {
"index": 3,
"text": "🇦🇫 Afghanistan"
},
"AM": {
"index": 4,
"text": "🇦🇲 Armenia"
},
"AP": {
"index": 5,
"text": "Asia/Pacific Region"
},
"AR": {
"index": 6,
"text": "🇦🇷 Argentina"
},
"AT": {
"index": 7,
"text": "🇦🇹 Austria"
},
"AU": {
"index": 8,
"text": "🇦🇺 Australia"
},
"BE": {
"index": 9,
"text": "🇧🇪 Belgium"
},
"BG": {
"index": 10,
"text": "🇧🇬 Bulgaria"
},
"BR": {
"index": 11,
"text": "🇧🇷 Brazil"
},
"BT": {
"index": 12,
"text": "🇧🇹 Bhutan"
},
"BY": {
"index": 94,
"text": "🇧🇾 Belarus"
},
"CA": {
"index": 13,
"text": "🇨🇦 Canada"
},
"CD": {
"index": 14,
"text": "🇨🇩 Congo"
},
"CH": {
"index": 15,
"text": "🇨🇭 Switzerland"
},
"CL": {
"index": 18,
"text": "🇨🇱 Chile"
},
"CM": {
"index": 16,
"text": "🇨🇲 Cameroon"
},
"CN": {
"index": 17,
"text": "🇨🇳 China"
},
"CO": {
"index": 19,
"text": "🇨🇴 Colombia"
},
"CR": {
"index": 20,
"text": "🇨🇷 Costa Rica"
},
"CY": {
"index": 21,
"text": "🇨🇾 Cyprus"
},
"CZ": {
"index": 22,
"text": "🇨🇿 Czech Republic"
},
"DE": {
"index": 23,
"text": "🇩🇪 Germany"
},
"DK": {
"index": 24,
"text": "🇩🇰 Denmark"
},
"DZ": {
"index": 25,
"text": "🇩🇿 Algeria"
},
"ES": {
"index": 26,
"text": "🇪🇸 Spain"
},
"ET": {
"index": 27,
"text": "🇪🇹 Ethiopia"
},
"EU": {
"index": 28,
"text": "European Union"
},
"FI": {
"index": 29,
"text": "🇫🇮 Finland"
},
"FR": {
"index": 30,
"text": "🇫🇷 France"
},
"GB": {
"index": 31,
"text": "🇬🇧 United Kingdom"
},
"GE": {
"index": 32,
"text": "🇬🇪 Georgia"
},
"GR": {
"index": 33,
"text": "🇬🇷 Greece"
},
"HK": {
"index": 35,
"text": "🇭🇰 Hong Kong"
},
"HN": {
"index": 36,
"text": "🇭🇳 Honduras"
},
"HR": {
"index": 37,
"text": "🇭🇷 Croatia"
},
"HU": {
"index": 34,
"text": "🇭🇺 Hungary"
},
"ID": {
"index": 38,
"text": "🇮🇩 Indonesia"
},
"IE": {
"index": 39,
"text": "🇮🇪 Ireland"
},
"IL": {
"index": 40,
"text": "🇮🇱 Israel"
},
"IN": {
"index": 41,
"text": "🇮🇳 India"
},
"IR": {
"index": 42,
"text": "🇮🇷 Iran"
},
"IS": {
"index": 44,
"text": "🇮🇸 Iceland"
},
"IT": {
"index": 43,
"text": "🇮🇹 Italy"
},
"JO": {
"index": 45,
"text": "🇯🇴 Jordan"
},
"JP": {
"index": 46,
"text": "🇯🇵 Japan"
},
"KE": {
"index": 47,
"text": "🇰🇪 Kenya"
},
"KH": {
"index": 48,
"text": "🇰🇭 Cambodia"
},
"KR": {
"index": 49,
"text": "🇰🇷 South Korea"
},
"KZ": {
"index": 50,
"text": "🇰🇿 Kazakhstan"
},
"LA": {
"index": 51,
"text": "🇱🇦 Lao People's Democratic Republic"
},
"LK": {
"index": 52,
"text": "🇱🇰 Sri Lanka"
},
"LT": {
"index": 53,
"text": "🇱🇹 Lithuania"
},
"LU": {
"index": 54,
"text": "🇱🇺 Luxembourg"
},
"LV": {
"index": 55,
"text": "🇱🇻 Latvia"
},
"MA": {
"index": 56,
"text": "🇲🇦 Morocco"
},
"MD": {
"index": 57,
"text": "🇲🇩 Moldova"
},
"ME": {
"index": 58,
"text": "🇲🇪 Montenegro"
},
"MR": {
"index": 59,
"text": "🇲🇷 Mauritania"
},
"MT": {
"index": 61,
"text": "🇲🇹 Malta"
},
"MX": {
"index": 60,
"text": "🇲🇽 Mexico"
},
"MY": {
"index": 62,
"text": "🇲🇾 Malaysia"
},
"NA": {
"index": 63,
"text": "🇳🇦 Namibia"
},
"NL": {
"index": 64,
"text": "🇳🇱 Netherlands"
},
"NO": {
"index": 66,
"text": "🇳🇴 Norway"
},
"NP": {
"index": 65,
"text": "🇳🇵 Nepal"
},
"NZ": {
"index": 67,
"text": "🇳🇿 New Zealand"
},
"OM": {
"index": 68,
"text": "🇴🇲 Oman"
},
"PE": {
"index": 69,
"text": "🇵🇪 Peru"
},
"PK": {
"index": 70,
"text": "🇵🇰 Pakistan"
},
"PL": {
"index": 71,
"text": "🇵🇱 Poland"
},
"PT": {
"index": 72,
"text": "🇵🇹 Portugal"
},
"PY": {
"index": 95,
"text": "🇵🇾 Paraguay"
},
"RO": {
"index": 73,
"text": "🇷🇴 Romania"
},
"RS": {
"index": 74,
"text": "🇷🇸 Serbia"
},
"RU": {
"index": 75,
"text": "🇷🇺 Russia"
},
"SA": {
"index": 76,
"text": "🇸🇦 Saudi Arabia"
},
"SC": {
"index": 77,
"text": "🇸🇨 Seychelles"
},
"SE": {
"index": 78,
"text": "🇸🇪 Sweden"
},
"SG": {
"index": 81,
"text": "🇸🇬 Singapore"
},
"SI": {
"index": 79,
"text": "🇸🇮 Slovenia"
},
"SK": {
"index": 80,
"text": "🇸🇰 Slovakia"
},
"TH": {
"index": 82,
"text": "🇹🇭 Thailand"
},
"TN": {
"index": 83,
"text": "🇹🇳 Tunisia"
},
"TR": {
"index": 84,
"text": "🇹🇷 Turkey"
},
"TT": {
"index": 96,
"text": "🇹🇹 Trinidad and Tobago"
},
"TW": {
"index": 85,
"text": "🇹🇼 Taiwan"
},
"UA": {
"index": 86,
"text": "🇺🇦 Ukraine"
},
"US": {
"index": 87,
"text": "🇺🇸 United States"
},
"UY": {
"index": 88,
"text": "🇺🇾 Uruguay"
},
"UZ": {
"index": 89,
"text": "🇺🇿 Uzbekistan"
},
"Unknown": {
"index": 0,
"text": "🏴☠️ Unknown"
},
"VE": {
"index": 90,
"text": "🇻🇪 Venezuela"
},
"VN": {
"index": 91,
"text": "🇻🇳 Viet Nam"
},
"ZA": {
"index": 92,
"text": "🇿🇦 South Africa"
},
"ZW": {
"index": 93,
"text": "🇿🇼 Zimbabwe"
}
},
"type": "value"
}
],
"noValue": "Unknown",
"thresholds": {
"mode": "absolute",
"steps": [
{
"color": "green",
"value": null
}
]
},
"unit": "short"
},
"overrides": []
},
"gridPos": {
"h": 12,
"w": 9,
"x": 15,
"y": 17
},
"id": 3,
"interval": "5m",
"options": {
"barRadius": 0.5,
"barWidth": 0.8,
"colorByField": "Value (sum)",
"groupWidth": 0.7,
"legend": {
"calcs": [],
"displayMode": "list",
"placement": "bottom",
"showLegend": false
},
"orientation": "horizontal",
"showValue": "auto",
"stacking": "none",
"tooltip": {
"mode": "single",
"sort": "none"
},
"xField": "Metric",
"xTickLabelRotation": 0,
"xTickLabelSpacing": 0
},
"pluginVersion": "9.3.6",
"targets": [
{
"datasource": {
"type": "datasource",
"uid": "-- Dashboard --"
},
"panelId": 14,
"refId": "A"
}
],
"title": "Country",
"transformations": [
{
"id": "seriesToRows",
"options": {}
},
{
"id": "groupBy",
"options": {
"fields": {
"Metric": {
"aggregations": [],
"operation": "groupby"
},
"Value": {
"aggregations": ["sum"],
"operation": "aggregate"
}
}
}
},
{
"id": "sortBy",
"options": {
"fields": {},
"sort": [
{
"desc": true,
"field": "Value (sum)"
}
]
}
},
{
"id": "limit",
"options": {
"limitField": 15
}
}
],
"type": "barchart"
},
{
"collapsed": false,
"gridPos": {
"h": 1,
"w": 24,
"x": 0,
"y": 29
},
"id": 28,
"panels": [],
"title": "Technical",
"type": "row"
},
{
"datasource": {
"type": "loki",
"uid": "XJPOAlTVz"
},
"description": "",
"fieldConfig": {
"defaults": {
"color": {
"mode": "thresholds"
},
"custom": {
"axisCenteredZero": false,
"axisColorMode": "text",
"axisLabel": "",
"axisPlacement": "auto",
"fillOpacity": 80,
"gradientMode": "none",
"hideFrom": {
"legend": false,
"tooltip": false,
"viz": false
},
"lineWidth": 1,
"scaleDistribution": {
"type": "linear"
},
"thresholdsStyle": {
"mode": "off"
}
},
"mappings": [
{
"options": {
"https://community.grafana.com/": {
"index": 3,
"text": "Community Grafana Forum"
},
"https://github.com/mikhail-vl": {
"index": 6,
"text": "GitHub Profile"
},
"https://grafana.com/": {
"index": 1,
"text": "Grafana"
},
"https://live.volkovlabs.io/": {
"index": 5,
"text": "Live Dashboard"
},
"https://www.bing.com/": {
"index": 4,
"text": "Bing"
},
"https://www.google.com/": {
"index": 0,
"text": "Google"
},
"https://www.linkedin.com/": {
"index": 8,
"text": "LinkedIn"
},
"https://www.youtube.com/": {
"index": 2,
"text": "YouTube"
},
"www.bing.com": {
"index": 7,
"text": "Bing"
}
},
"type": "value"
}
],
"noValue": "None",
"thresholds": {
"mode": "absolute",
"steps": [
{
"color": "green",
"value": null
},
{
"color": "red",
"value": 80
}
]
}
},
"overrides": [
{
"matcher": {
"id": "byName",
"options": "Value (sum)"
},
"properties": [
{
"id": "color",
"value": {
"mode": "continuous-BlPu"
}
}
]
}
]
},
"gridPos": {
"h": 12,
"w": 12,
"x": 0,
"y": 30
},
"id": 6,
"interval": "5m",
"options": {
"barRadius": 0.5,
"barWidth": 0.8,
"colorByField": "Value (sum)",
"groupWidth": 0.7,
"legend": {
"calcs": [],
"displayMode": "list",
"placement": "bottom",
"showLegend": false
},
"orientation": "horizontal",
"showValue": "auto",
"stacking": "none",
"tooltip": {
"mode": "none",
"sort": "none"
},
"xTickLabelMaxLength": 40,
"xTickLabelRotation": 0,
"xTickLabelSpacing": 0
},
"pluginVersion": "9.3.6",
"targets": [
{
"datasource": {
"type": "loki",
"uid": "XJPOAlTVz"
},
"editorMode": "code",
"expr": "sum by (http_referer) (count_over_time({host=~\"$host\"} | json [$__interval]))",
"instant": true,
"legendFormat": "{{http_referer}}",
"queryType": "range",
"range": false,
"refId": "A"
}
],
"title": "Referers",
"transformations": [
{
"id": "seriesToRows",
"options": {}
},
{
"id": "groupBy",
"options": {
"fields": {
"Metric": {
"aggregations": [],
"operation": "groupby"
},
"Value": {
"aggregations": ["sum"],
"operation": "aggregate"
}
}
}
},
{
"id": "sortBy",
"options": {
"fields": {},
"sort": [
{
"desc": true,
"field": "Value (sum)"
}
]
}
},
{
"id": "limit",
"options": {
"limitField": 12
}
}
],
"type": "barchart"
},
{
"datasource": {
"type": "loki",
"uid": "XJPOAlTVz"
},
"description": "",
"fieldConfig": {
"defaults": {
"color": {
"mode": "continuous-BlPu"
},
"custom": {
"axisCenteredZero": false,
"axisColorMode": "text",
"axisLabel": "",
"axisPlacement": "auto",
"fillOpacity": 80,
"gradientMode": "none",
"hideFrom": {
"legend": false,
"tooltip": false,
"viz": false
},
"lineWidth": 1,
"scaleDistribution": {
"type": "linear"
},
"thresholdsStyle": {
"mode": "off"
}
},
"mappings": [
{
"options": {
"pattern": ".*Mac OS X.*",
"result": {
"index": 0,
"text": "Mac OS X"
}
},
"type": "regex"
},
{
"options": {
"pattern": ".*Iphone.*",
"result": {
"index": 1,
"text": "Iphone"
}
},
"type": "regex"
},
{
"options": {
"pattern": ".*Linux.*",
"result": {
"index": 2,
"text": "Linux"
}
},
"type": "regex"
},
{
"options": {
"pattern": ".*Windows NT.*",
"result": {
"index": 3,
"text": "Windows"
}
},
"type": "regex"
},
{
"options": {
"pattern": ".*Android.*",
"result": {
"index": 4,
"text": "Android"
}
},
"type": "regex"
}
],
"thresholds": {
"mode": "absolute",
"steps": [
{
"color": "green",
"value": null
},
{
"color": "red",
"value": 80
}
]
}
},
"overrides": []
},
"gridPos": {
"h": 12,
"w": 12,
"x": 12,
"y": 30
},
"id": 7,
"interval": "5m",
"options": {
"barRadius": 0.5,
"barWidth": 0.8,
"colorByField": "Value (sum)",
"groupWidth": 0.7,
"legend": {
"calcs": [],
"displayMode": "list",
"placement": "bottom",
"showLegend": false
},
"orientation": "horizontal",
"showValue": "auto",
"stacking": "none",
"tooltip": {
"mode": "none",
"sort": "none"
},
"xTickLabelRotation": 0,
"xTickLabelSpacing": 0
},
"pluginVersion": "9.3.6",
"targets": [
{
"datasource": {
"type": "loki",
"uid": "XJPOAlTVz"
},
"editorMode": "code",
"expr": "sum by (http_user_agent) (count_over_time({host=~\"$host\"} | json [$__interval]))",
"instant": true,
"legendFormat": "{{http_user_agent}}",
"queryType": "range",
"range": false,
"refId": "A"
}
],
"title": "User Agents",
"transformations": [
{
"id": "seriesToRows",
"options": {}
},
{
"id": "groupBy",
"options": {
"fields": {
"Metric": {
"aggregations": [],
"operation": "groupby"
},
"Value": {
"aggregations": ["sum"],
"operation": "aggregate"
}
}
}
},
{
"id": "sortBy",
"options": {
"fields": {},
"sort": [
{
"desc": true,
"field": "Value (sum)"
}
]
}
},
{
"id": "limit",
"options": {
"limitField": 12
}
}
],
"type": "barchart"
},
{
"datasource": {
"type": "loki",
"uid": "XJPOAlTVz"
},
"description": "",
"gridPos": {
"h": 12,
"w": 12,
"x": 0,
"y": 42
},
"id": 11,
"interval": "5m",
"maxDataPoints": 1,
"options": {
"dedupStrategy": "signature",
"enableLogDetails": true,
"prettifyLogMessage": false,
"showCommonLabels": false,
"showLabels": false,
"showTime": true,
"sortOrder": "Descending",
"wrapLogMessage": false
},
"pluginVersion": "9.3.6",
"targets": [
{
"datasource": {
"type": "loki",
"uid": "XJPOAlTVz"
},
"editorMode": "code",
"expr": "{host=~\"$host\"} | json | (status = 404 or request_time>1) | line_format \"{{.request_uri}}\"",
"legendFormat": "",
"queryType": "range",
"refId": "A"
}
],
"title": "Not Found and Long Requests",
"type": "logs"
},
{
"datasource": {
"type": "loki",
"uid": "XJPOAlTVz"
},
"description": "",
"gridPos": {
"h": 12,
"w": 12,
"x": 12,
"y": 42
},
"id": 33,
"interval": "5m",
"maxDataPoints": 1,
"options": {
"dedupStrategy": "signature",
"enableLogDetails": true,
"prettifyLogMessage": false,
"showCommonLabels": false,
"showLabels": false,
"showTime": true,
"sortOrder": "Descending",
"wrapLogMessage": false
},
"pluginVersion": "9.3.6",
"targets": [
{
"datasource": {
"type": "loki",
"uid": "XJPOAlTVz"
},
"editorMode": "code",
"expr": "{host=~\"$host\"} | json | status != 200 | status != 404 | line_format \"| {{.status}} | {{.request_uri}}\"",
"legendFormat": "",
"queryType": "range",
"refId": "A"
}
],
"title": "Other Requests",
"type": "logs"
},
{
"collapsed": false,
"gridPos": {
"h": 1,
"w": 24,
"x": 0,
"y": 54
},
"id": 32,
"panels": [],
"title": "Heatmap",
"type": "row"
},
{
"datasource": {
"type": "loki",
"uid": "XJPOAlTVz"
},
"description": "",
"fieldConfig": {
"defaults": {
"custom": {
"hideFrom": {
"legend": false,
"tooltip": false,
"viz": false
},
"scaleDistribution": {
"type": "linear"
}
}
},
"overrides": []
},
"gridPos": {
"h": 16,
"w": 24,
"x": 0,
"y": 55
},
"id": 30,
"interval": "1h",
"maxDataPoints": 24,
"options": {
"calculate": false,
"cellGap": 0,
"color": {
"exponent": 0.5,
"fill": "#9d70f9",
"mode": "scheme",
"reverse": false,
"scale": "exponential",
"scheme": "Reds",
"steps": 64
},
"exemplars": {
"color": "rgba(255,0,255,0.7)"
},
"filterValues": {
"le": 0
},
"legend": {
"show": true
},
"rowsFrame": {
"layout": "auto",
"value": "Requests"
},
"tooltip": {
"show": true,
"yHistogram": false
},
"yAxis": {
"axisPlacement": "left",
"reverse": true,
"unit": "short"
}
},
"pluginVersion": "9.3.6",
"targets": [
{
"datasource": {
"type": "loki",
"uid": "XJPOAlTVz"
},
"editorMode": "code",
"expr": "topk(3, sum by (geoip_country_code) (count_over_time({host=~\"$host\"} | json | status = 200 [$__interval])))",
"legendFormat": "{{geoip_country_code}}",
"queryType": "range",
"refId": "A"
}
],
"title": "Country",
"transformations": [
{
"id": "joinByField",
"options": {}
},
{
"id": "organize",
"options": {
"excludeByName": {},
"indexByName": {},
"renameByName": {
"AU": "Australia",
"BE": "Belgium",
"CH": "Switzerland",
"CN": "China",
"CR": "Costa Rica",
"CZ": "Czech Republic",
"DK": "Denmark",
"FR": "France",
"ID": "Indonesia",
"IE": "Ireland",
"IL": "Israel",
"IN": "India",
"NL": "Netherlands",
"PL": "Poland",
"RU": "Russia",
"SK": "Slovakia",
"UA": "Ukraine",
"US": "United States",
"Unknown": ""
}
}
}
],
"type": "heatmap"
},
{
"datasource": {
"type": "loki",
"uid": "XJPOAlTVz"
},
"description": "",
"fieldConfig": {
"defaults": {
"custom": {
"hideFrom": {
"legend": false,
"tooltip": false,
"viz": false
},
"scaleDistribution": {
"type": "linear"
}
}
},
"overrides": []
},
"gridPos": {
"h": 15,
"w": 24,
"x": 0,
"y": 71
},
"id": 29,
"interval": "1h",
"maxDataPoints": 24,
"options": {
"calculate": false,
"cellGap": 1,
"color": {
"exponent": 0.1,
"fill": "#9d70f9",
"mode": "scheme",
"reverse": false,
"scale": "exponential",
"scheme": "Reds",
"steps": 128
},
"exemplars": {
"color": "rgba(255,0,255,0.7)"
},
"filterValues": {
"le": 1e-9
},
"legend": {
"show": true
},
"rowsFrame": {
"layout": "auto"
},
"tooltip": {
"show": true,
"yHistogram": false
},
"yAxis": {
"axisPlacement": "left",
"reverse": true,
"unit": "short"
}
},
"pluginVersion": "9.3.6",
"targets": [
{
"datasource": {
"type": "loki",
"uid": "XJPOAlTVz"
},
"editorMode": "code",
"expr": "topk(3, sum by (request_uri) (count_over_time({host=~\"$host\"} | json | status = 200 [$__interval])))",
"legendFormat": "{{request_uri}}",
"queryType": "range",
"refId": "A"
}
],
"title": "Pages",
"transformations": [
{
"id": "joinByField",
"options": {}
},
{
"id": "organize",
"options": {
"excludeByName": {},
"indexByName": {},
"renameByName": {
"/": "Home",
"/blog/": "Blog"
}
}
}
],
"type": "heatmap"
}
],
"refresh": "1m",
"schemaVersion": 37,
"style": "dark",
"tags": [],
"templating": {
"list": [
{
"current": {
"selected": true,
"text": ["All"],
"value": ["$__all"]
},
"datasource": {
"type": "loki",
"uid": "XJPOAlTVz"
},
"definition": "label_values($label_name)",
"hide": 2,
"includeAll": true,
"label": "Host",
"multi": true,
"name": "host",
"options": [],
"query": {
"label": "host",
"refId": "LokiVariableQueryEditor-VariableQuery",
"stream": "",
"type": 1
},
"refresh": 1,
"regex": "",
"skipUrlSync": false,
"sort": 1,
"tagValuesQuery": "",
"tagsQuery": "",
"type": "query",
"useTags": false
}
]
},
"time": {
"from": "now-6h",
"to": "now"
},
"timepicker": {
"refresh_intervals": [
"10s",
"30s",
"1m",
"5m",
"15m",
"30m",
"1h",
"2h",
"1d"
]
},
"timezone": "",
"title": "Website Analytics",
"uid": "Nz6kKgtGj",
"version": 434,
"weekStart": ""
}
Search
Search should not be painful and sometimes we got lost ourselves. We implemented Algolia Search for our Blog and Documentation and couldn't be happier with the outcome.
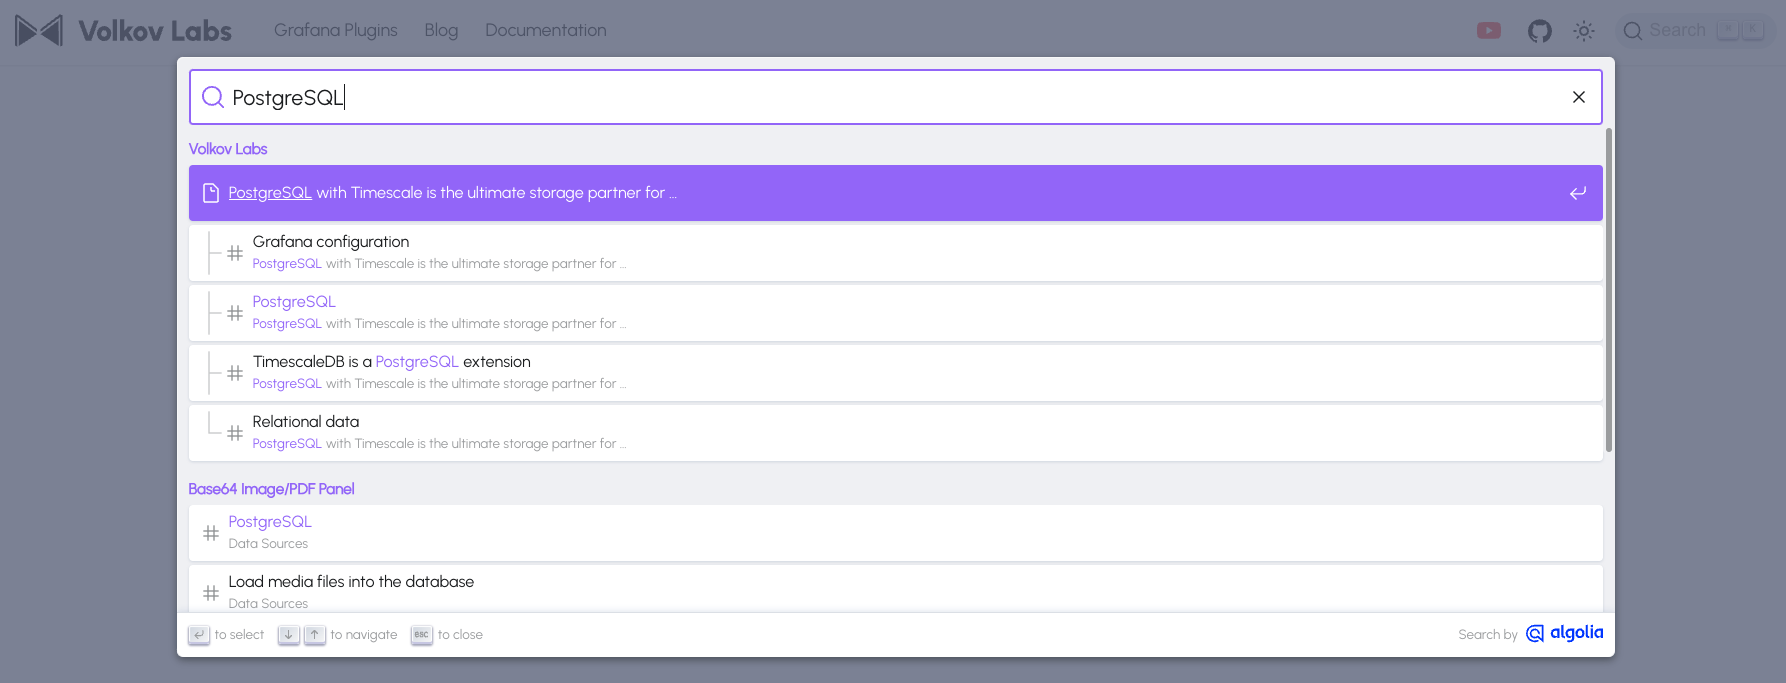
During installation, the Algolia Crawler helped us to fix multiple internal issues and was easy to configure with an intuitive UI.
Algolia Search provides us with valuable information on what visitors are looking for and having a hard time finding.
Tutorial
We explained how to set up Nginx, Loki, Promtail and Grafana in the article Website Analytics based on Nginx, Loki, Promtail, and Grafana. It's up to date with our latest findings.
In the following video, I will walk you through the visual panel configuration. Please be aware demonstrated dashboard is a little different from the one we use in our production.
Summary
Documentation is a skeleton, blog posts are the meat. The documentation is an outline, and blog posts are coloring. They complement each other.
When one gives direction, the other explains why. We believe that both are equally important. That is why we improve them daily.
The analytical dashboard is our web heart rate monitor that helps us to maneuver in the sea of questions and requests.
Let’s Stay Connected!
Join the Conversation: Stay updated and share your thoughts! Subscribe to our YouTube Channel and leave your comments—we can’t wait to hear what you think.
Your input helps us improve, so don’t hesitate to get in touch!