US and World maps, ECharts 5.4.2, and annotations in Business Charts 4.3.1

We are happy to announce the release of the Business Charts panel 4.3.1. This release include the following updates:
- Added an alert state and annotations.
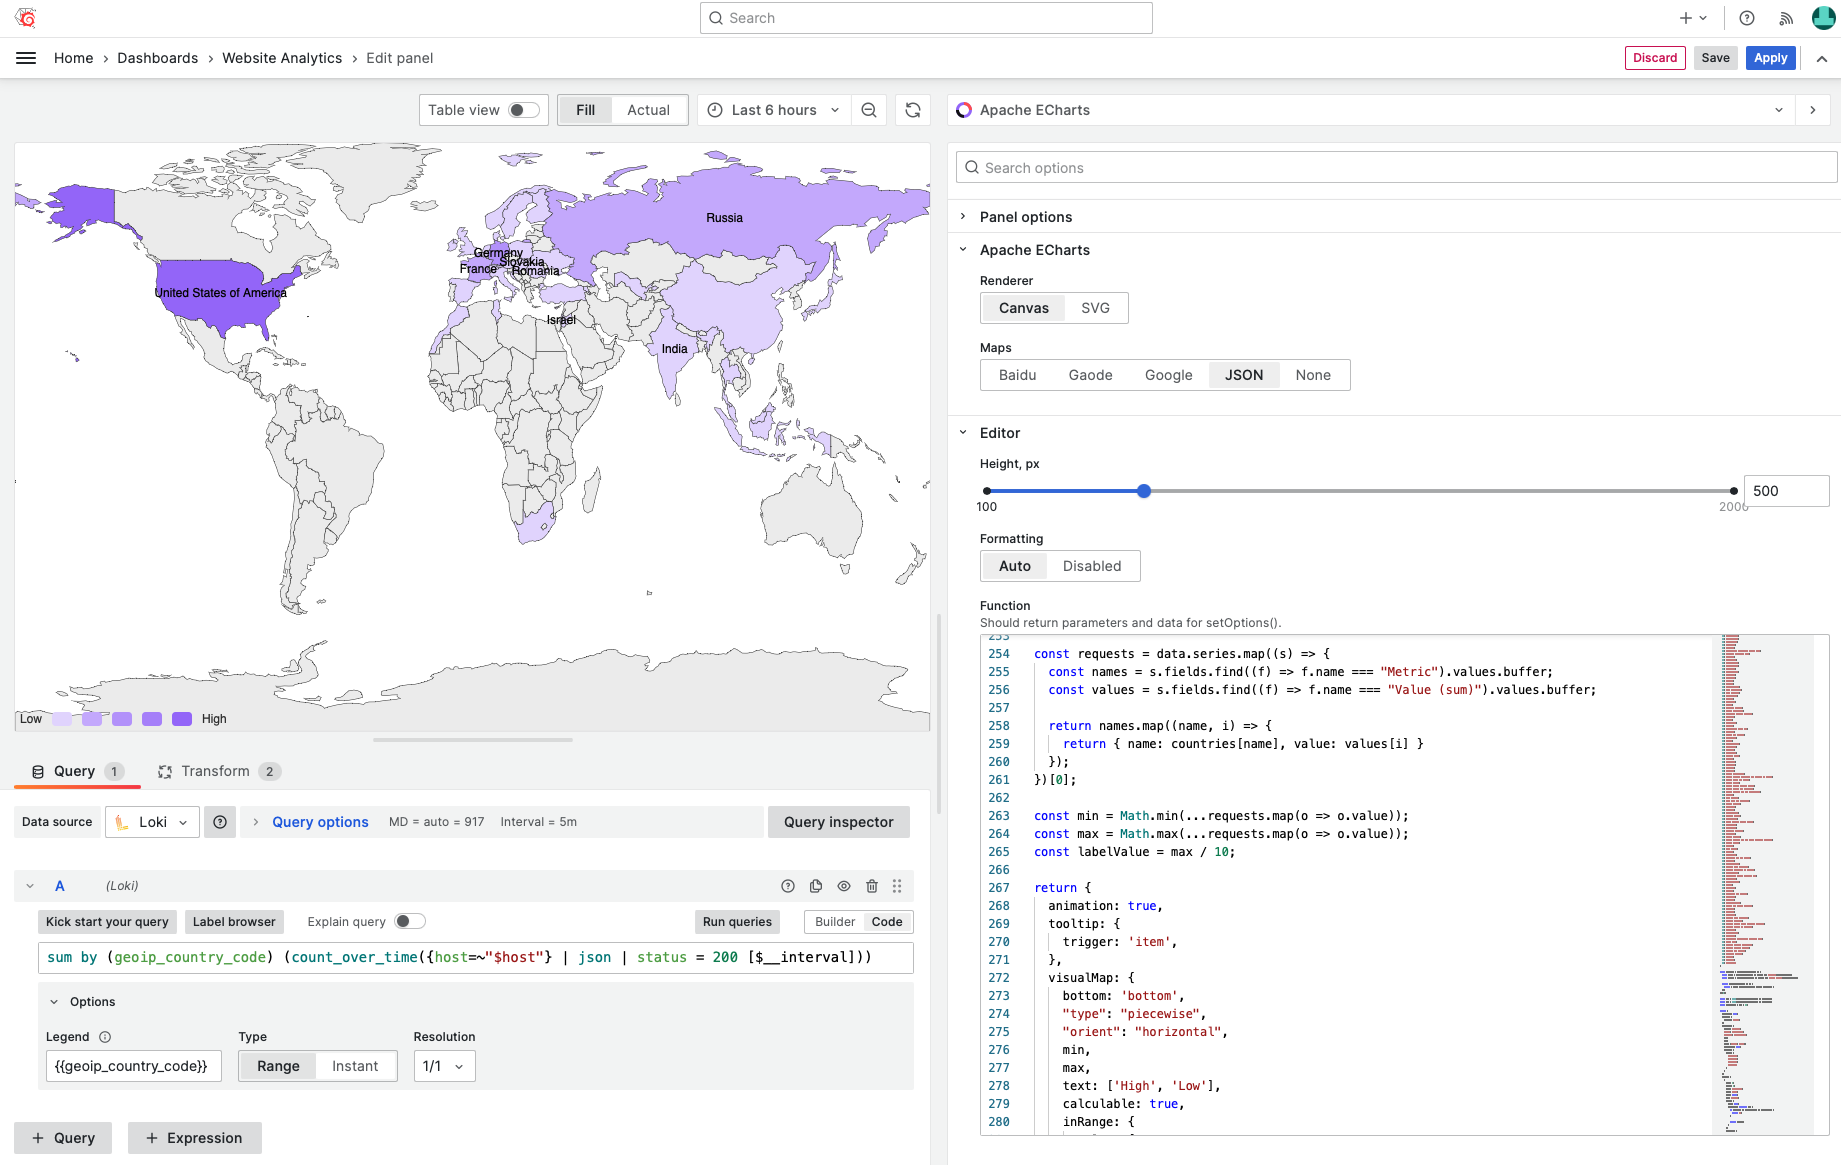
- Updated U.S. and world maps in the GeoJSON module.
- Updated the plugin to the latest Grafana 9.4.7 toolkit and the Apache ECharts 5.4.2 library.
After the plugin review by the Grafana team, the getDataSourceSrv parameter was removed due to security reasons in v4.3.1.
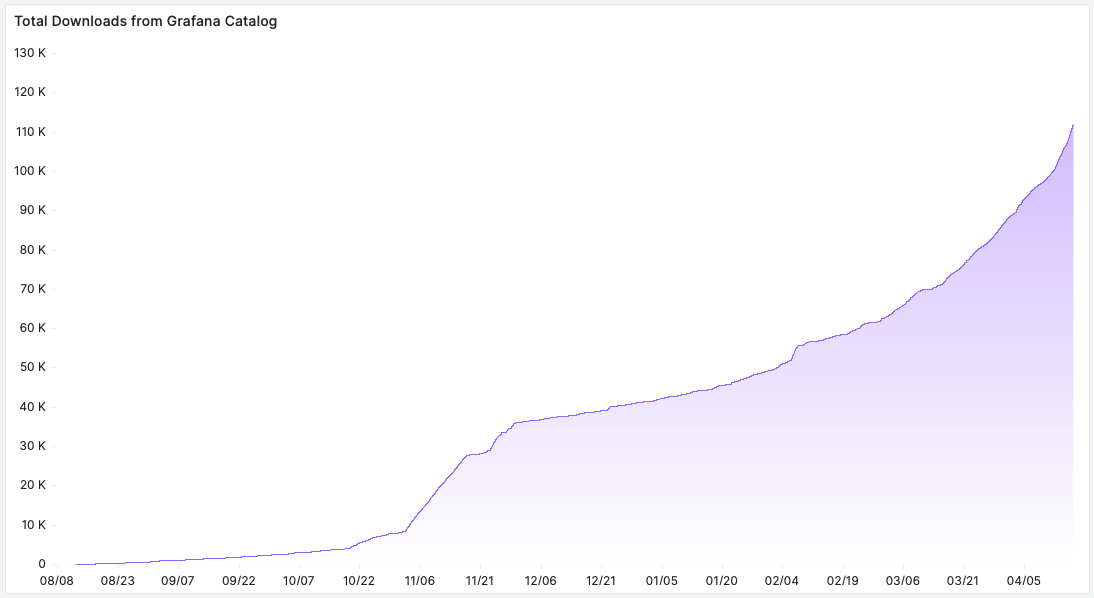
100k downloads
We are pleased to announce that Business Charts panel has been downloaded over 100,000 times. This extension is not a plug-and-play product and requires some learning. Our YouTube tutorials and documentation will undoubtedly assist you in mastering the plugin and revealing its unrivaled customization potential.
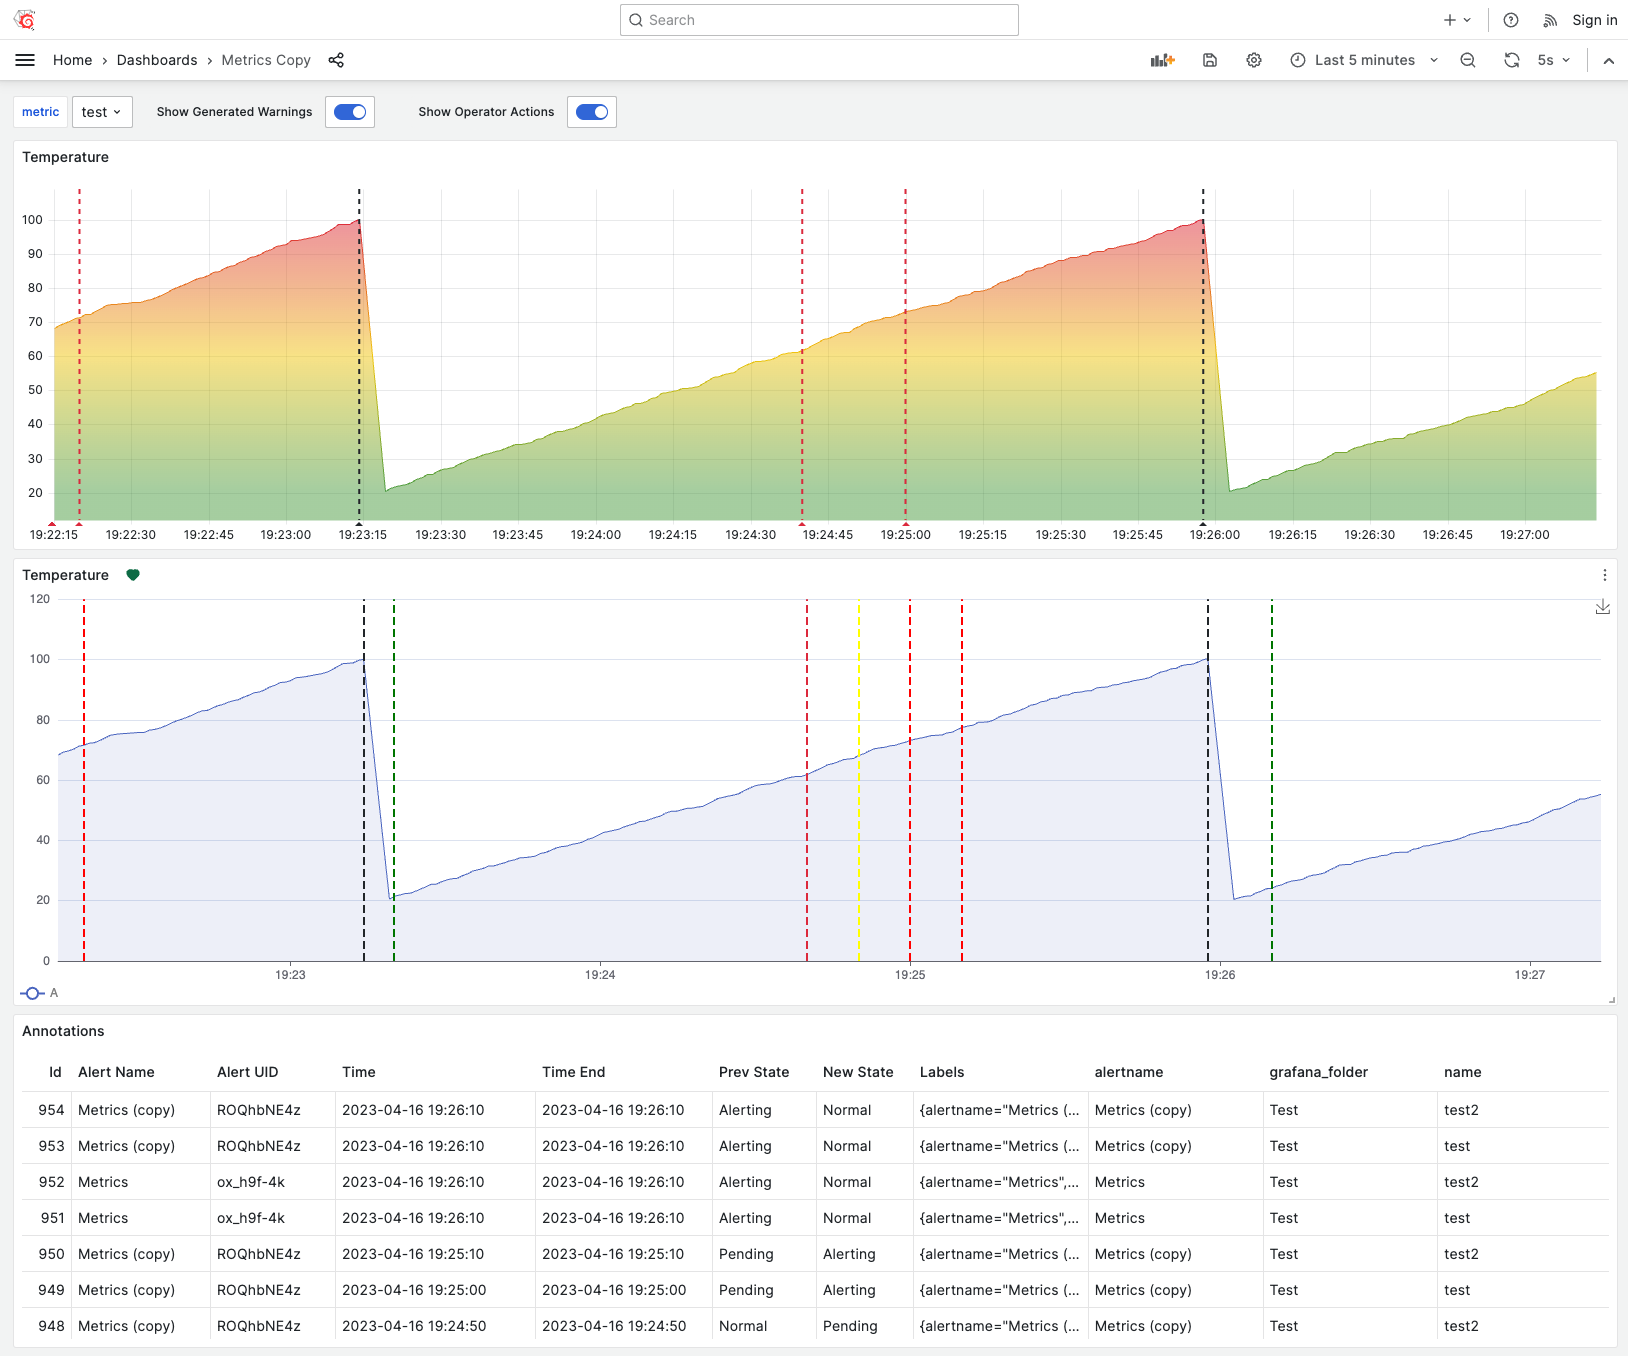
Alert State and Annotations
We added support for Annotations in Apache ECharts using mark lines. Data for mark lines is retrieved from the context.panel.data.annotations object as explained in the product documentation.
const annotations = [];
context.panel.data.annotations.map((a) => {
  a.source.forEach((source) =>
    annotations.push({
      xAxis: source.time,
      label: source.text,
      lineStyle: {
        color: source.color,
        width: 2,
      },
    })
  );
});

/**
 * Data Sources
 */
const series = context.panel.data.series.map((s) => {
  const sData = s.fields.find((f) => f.type === "number").values;
  const sTime = s.fields.find((f) => f.type === "time").values;

  return {
    name: s.refId,
    type: "line",
    showSymbol: false,
    areaStyle: {
      opacity: 0.1,
    },
    lineStyle: {
      width: 1,
    },
    data: sData.map((d, i) => [sTime[i], d.toFixed(2)]),
    markLine: {
      data: annotations,
      label: {
        show: false,
      },
      symbol: ["none", "none"],
    },
  };
});
Entry point to data sources
After the plugin review by the Grafana team, this functionality was removed due to security reasons in v4.3.1.
We are testing a security-safe technique in the Data Manipulation plugin and plan to include it into Business Charts panel.
Business Charts panel allows you to retrieve an entry point of a data source. You can use the data source instance to perform any methods supplied by the data source.
async () => {
  const targets = data.request?.targets;
  if (targets.length && targets[0].datasource) {
    const datasource = await getDataSourceSrv().get(targets[0].datasource);
    notifySuccess(["PostgreSQL Version", await datasource.getVersion()]);
  }
};
GeoJSON updates
GeoJSON files (U.S. and world maps) were synchronized with native maps provided within Grafana GeoMap. You may now quickly transition from GeoMap to Business Charts panel to display visual maps, like we already did for the Website Analytics blog.
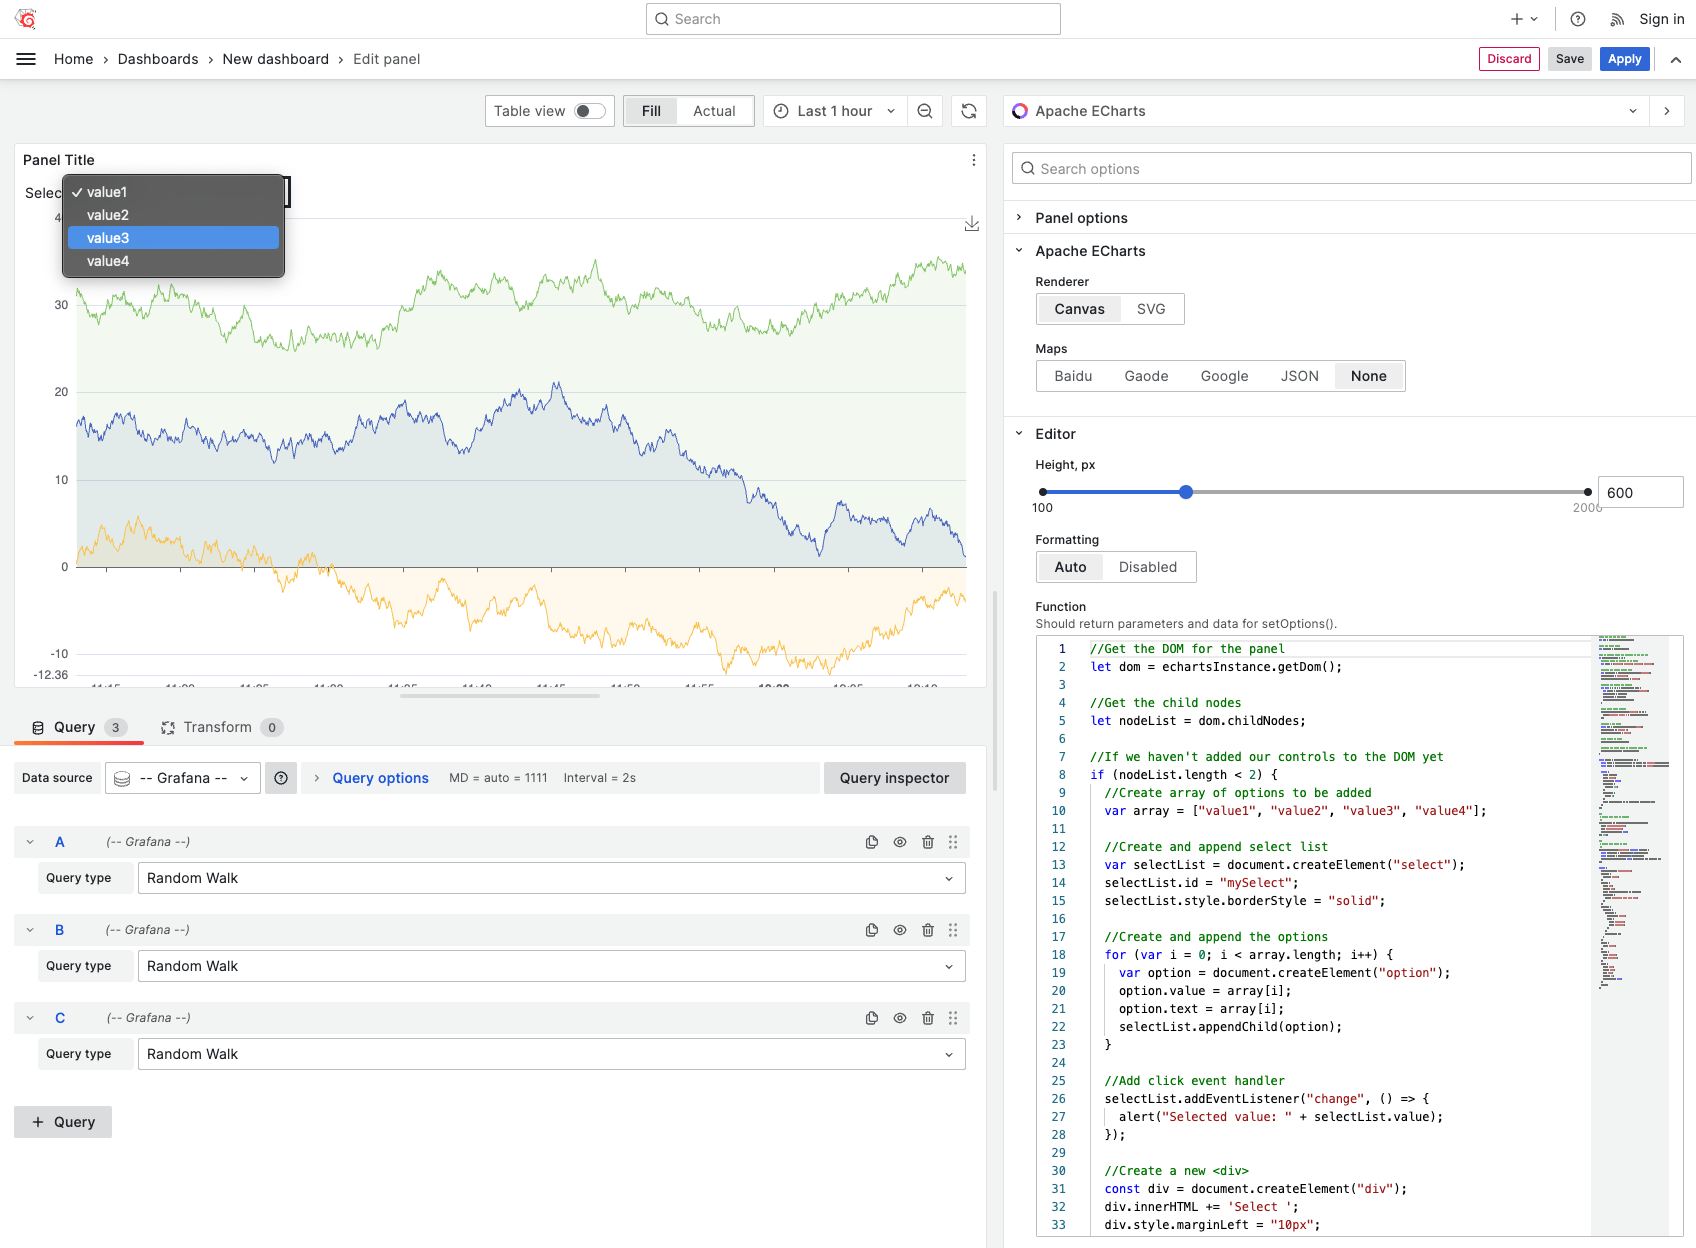
Panel Variables
We continue to explore with integrating DOM components straight into the Apache ECharts container to add more interactivity. This time, we introduced a dropdown box that lets you update Apache ECharts or establish a direct interaction with the data source through an entry point.
//Get the DOM for the panel
let dom = context.panel.chart.getDom();

//Get the child nodes
let nodeList = dom.childNodes;

//If we haven't added our controls to the DOM yet
if (nodeList.length < 2) {
  //Create a select list
  const selectList = document.createElement("select");
  selectList.id = "mySelect";
  selectList.style.borderStyle = "solid";

  //Add options
  const array = ["value1", "value2", "value3", "value4"];
  array.forEach((value) => {
    const option = document.createElement("option");
    option.value = value;
    option.text = value;
    selectList.appendChild(option);
  });

  //Add click event handler
  selectList.addEventListener("change", () => {
    alert("Selected value: " + selectList.value);
  });

  //Create a new <div>
  const div = document.createElement("div");
  div.innerHTML += "Select ";
  div.style.marginLeft = "10px";

  //Add select to <div>
  div.appendChild(selectList);

  //Insert new <div> ahead of existing chart div
  dom.insertBefore(div, dom.firstChild);
}
Getting Started
You can install the Business Charts panel from the Grafana Plugins catalog or using the Grafana command line tool.
For the latter, please use the following command.
grafana cli plugins install volkovlabs-echarts-panel
Tutorial
This is the first video we created about Business Charts after the plugin rebranding. It features dazzling chart examples followed by a high-level plugin architecture. Knowing the basics of plugin architecture will help you create your custom charts.
To get you started quicker we prepared the web resource with numerous ready-to-use examples. In the video, Daria demonstrates how to work with this resource.
The main obstacle for many plugin users is the data transmission from the Grafana data frame(s) into the Charts function. In the video, in addition to the resource with how-to examples, Daria introduces the Visual Editor - the mechanism we started to work on to simplify the transmission.
We have many other tutorials that you can find helpful. You can review all related to this plugin tutorials here.
Release Notes
- Removed the
getDataSourceSrvparameter due to security reasons.
Features / Enhancements
- Added compatibility with Grafana 9.4.7 (#146).
- Added
getDataSourceSrvparameter to retrieve the entry point to data sources (#146). - Updated the Apache ECharts library to version 5.4.2 (#147).
- Updated U.S. and world GeoJSON maps used in the GeoMap module (#154).
- Added the Alert State and Annotations (#155).
Apache ECharts 5.4.2
- [Feature] [bar] Support borderRadius for polar bar and its background. #17995 (Ovilia)
- [Feature] [i18n] Add Turkish(tr_TR) translation. #18012 (partitect)
- [Feature] [i18n] Add Vietnamese(vi_VN) translation. #18279 (nghiepdev)
- [Fix] [bar] Polar bar animation should start from r0 rather than 0. #17997 (Ovilia)
- [Fix] [marker] Fix abnormal range of markArea in bar series. #18229 (Ovilia)
- [Fix] [line] Fix labels don't show in line series when ssr is enabled. #18032 (plainheart)
- [Fix] [svg] Fix defined CSS doesn't work due to unexpected encoding for style tag. #982 (plainheart)
- [Fix] [sunburst] Fix labels might upside down in radial layout. #18240 (susiwen8)
- [Fix] [dataset] Fix chart can't render when using object array and object item contains a property named length. #18276 (susiwen8)
- [Fix] [tooltip] Fix tooltip still disappears after leaving the tooltip even if alwaysShowContent was enabled. #18221 (jianghaoran116)
- [Fix] [text] Charsets like Cyrillic should break word the same as Latin. #973 (Ovilia)
- [Fix] [type] Add missing treePathInfo property into sunburst formatter callback and add missing data option into SunburstSeriesOption. #18310 (plainheart)
- [Fix] [type] Add missing callback function type for the symbol option of tree series. #18070 (ChepteaCatalin)
We're Always Happy to Hear From You!
We value your feedback and are eager to connect with our community and partners. Whether you have a question, an idea, or an issue to report, here’s how you can reach out:
- Community Members: Have a question, want to suggest a new feature, or found a bug? We’d love to hear from you! Please create a GitHub issue to start the conversation.
- Enterprise Partners: Need assistance or have an urgent request? Open a Zendesk ticket for a prompt and dedicated response from our team.
- Join the Conversation: Stay updated and share your thoughts! Subscribe to our YouTube Channel and leave your comments—we can’t wait to hear what you think.
Your input helps us improve, so don’t hesitate to get in touch!