Improved Code Editor, included scatter and boxplot into Visual Editor, and Grafana 11.3 Scenes updates in Business Charts 6.5.0
We are happy to announce the release of the Business Charts panel 6.5.0. This release includes the following updates:
- Improved Autosize Code Editor.
- Included Scatter and Boxplot into the Visual Editor.
- Added Promise libraries import.
- Compatibility with Grafana 11.3 and Scenes-powered dashboards.
Downloads
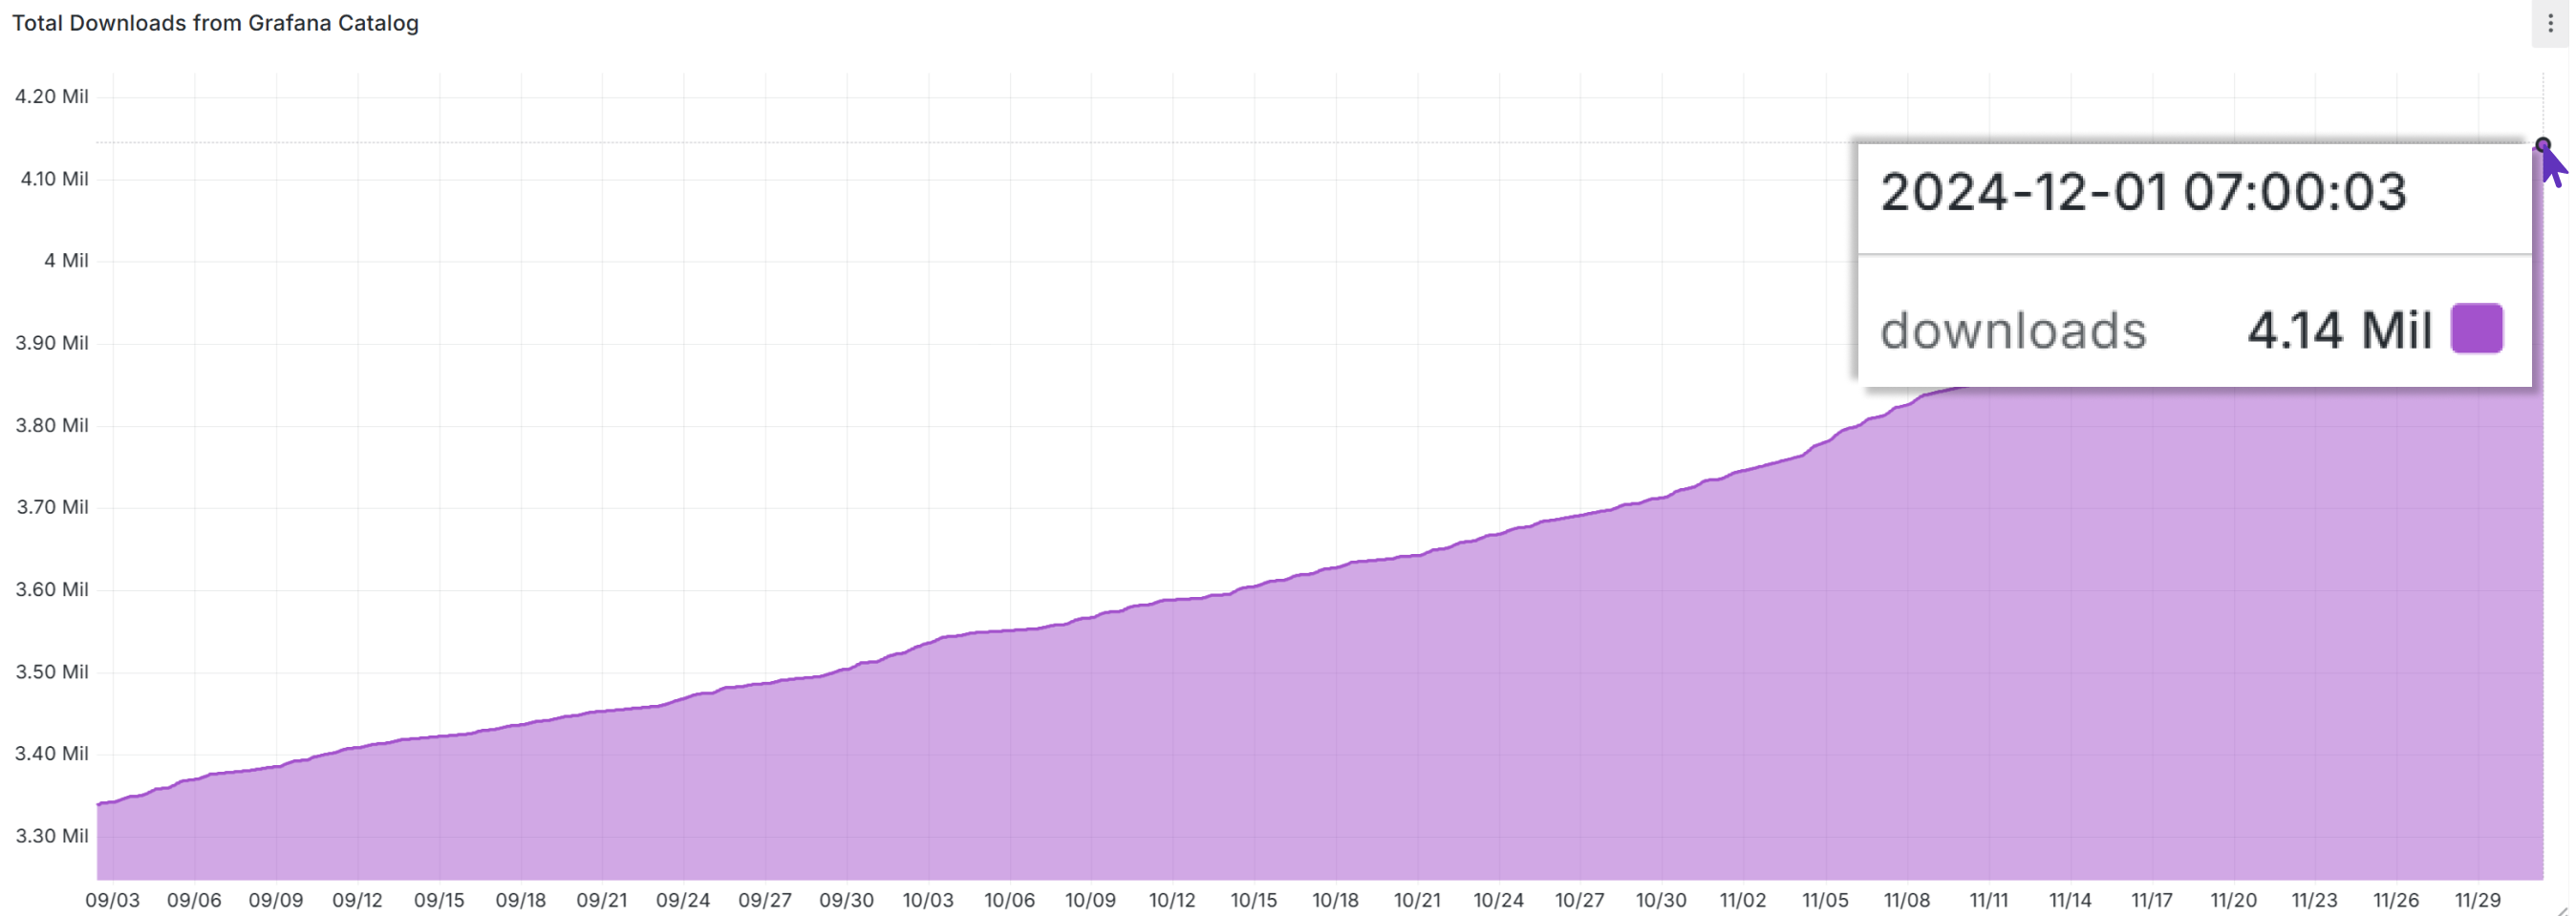
The Business Charts panel is another plugin from our Business Suite plugin collection reaching the dazzling milestone of 4,000,000 downloads.
Improved Autosize Code Editor
The Autosize Code Editor opens in a new window after a user clicks on the four-direction button.

You can find this button at the top left corner of the Code parameter.
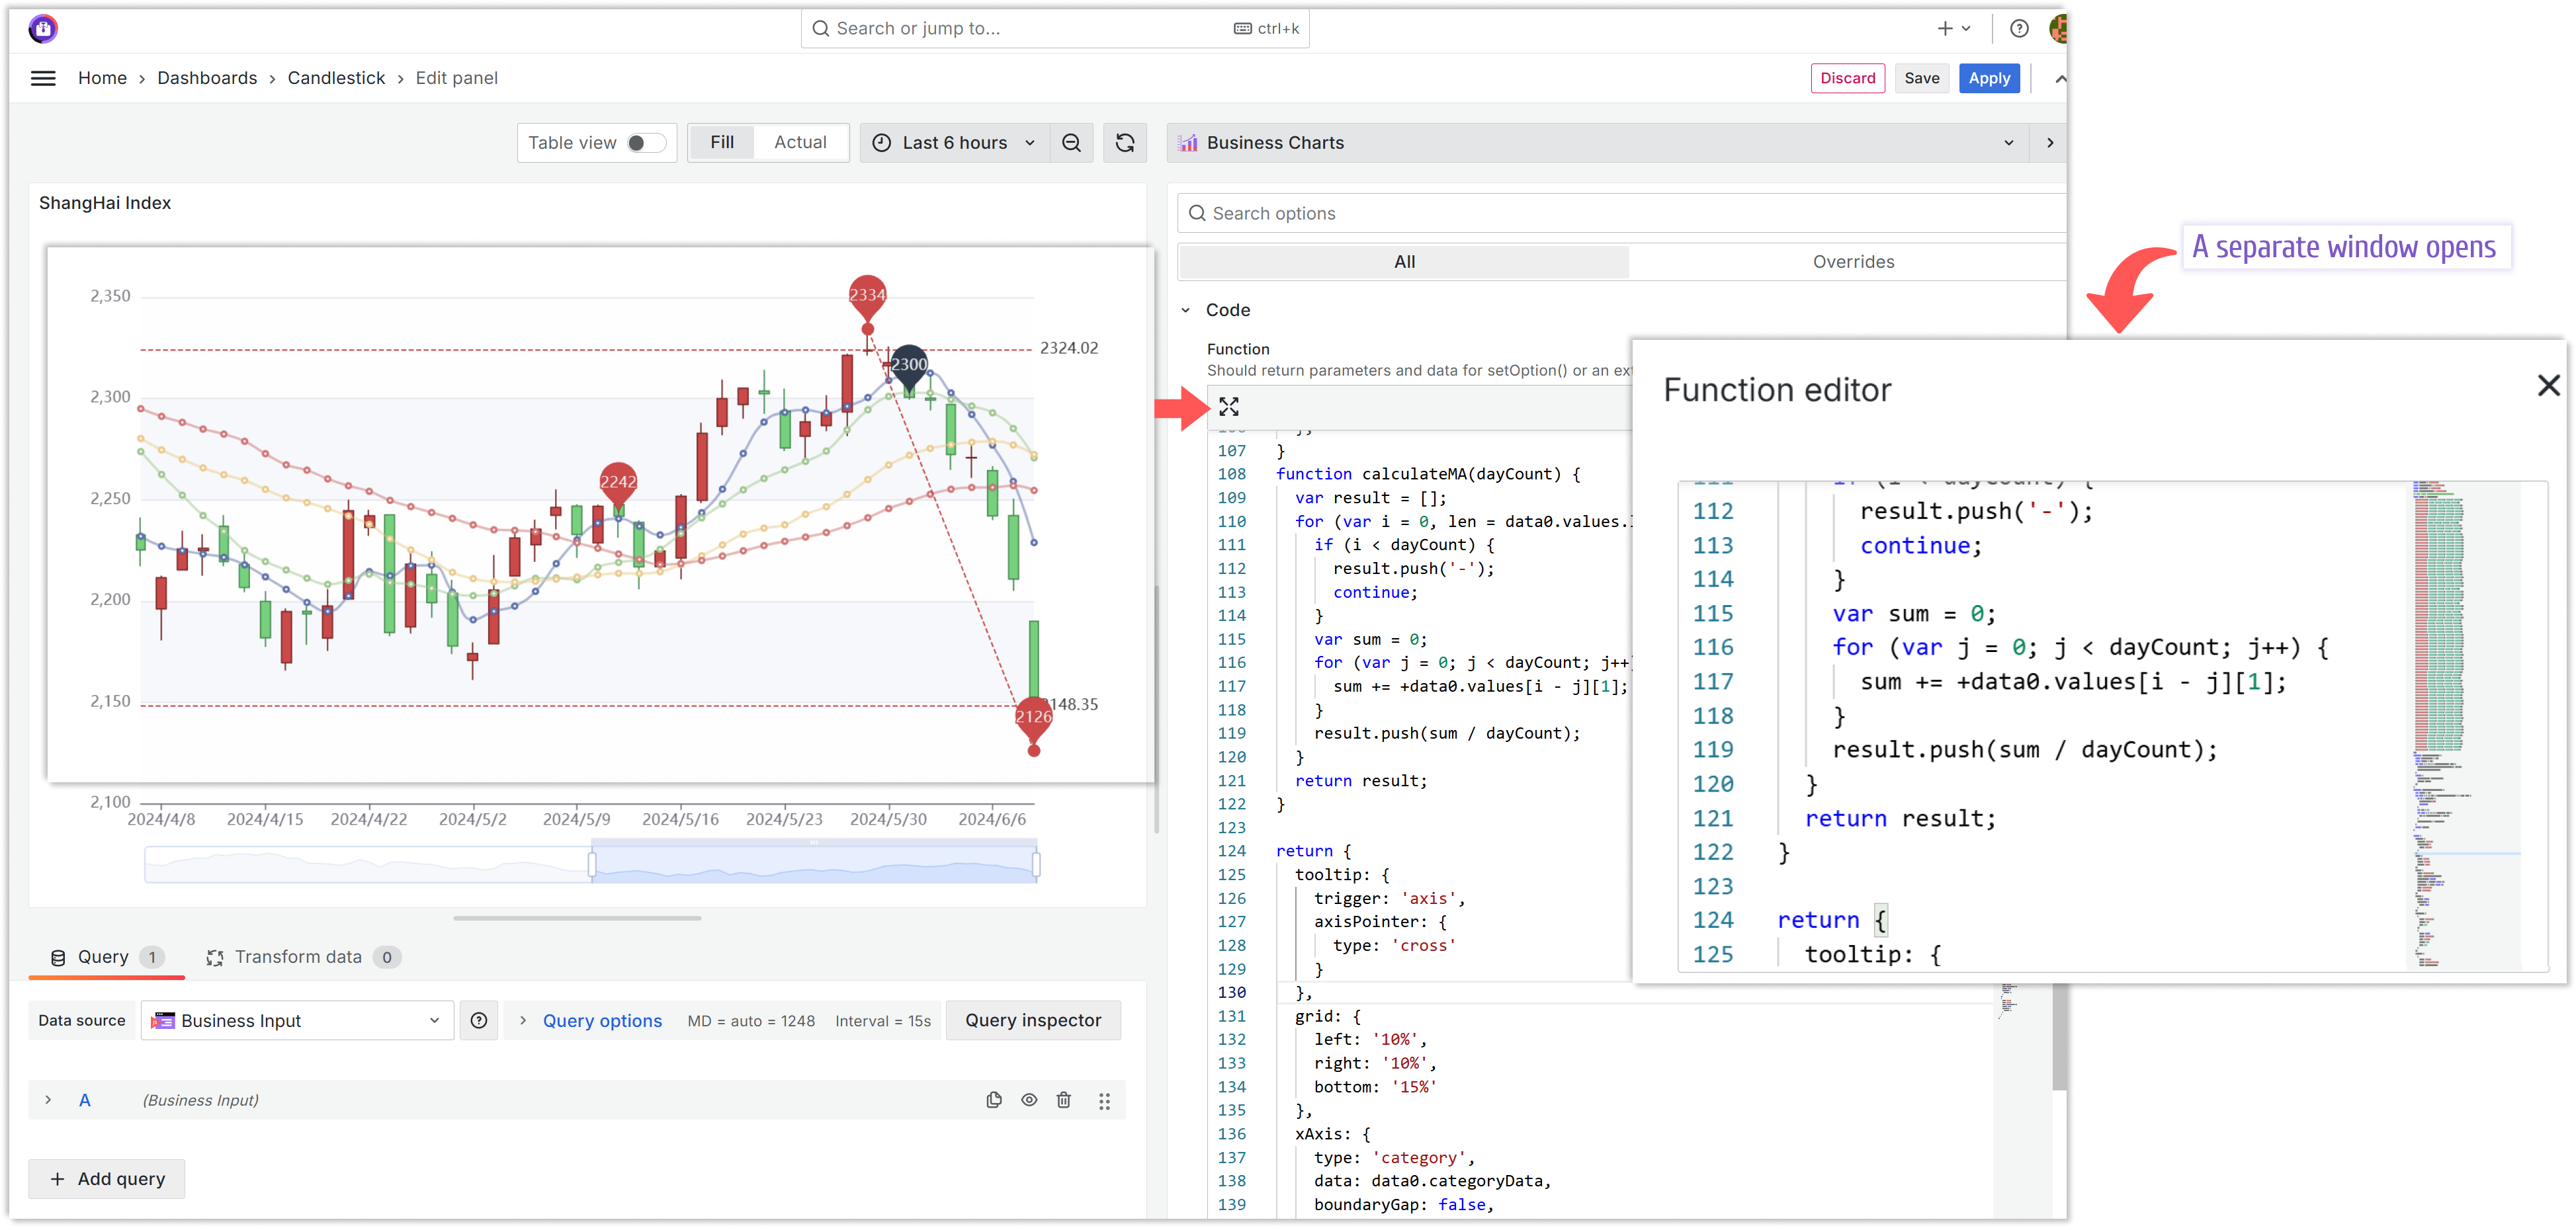
To improve the user experience further, we added the following four buttons:
- Copy code. Copies the highlighted code in the memory buffer.
- Paste code. Pastes the content of the memory buffer.
- Wrap code on new lines. Fits the text into the visible area on the screen.
- Show/Hide mini map. Shows/hides the far right area depicting the code at scale.

Included scatter and boxplot into the Visual Editor
We added the Visual Editor to simplify working with the Grafana data frames and facilitate intuitive data transmission into the Charts function.
The Visual Editor should significantly help to work with datasets, but it does not eliminate the need for the Charts function.
This feature is in the beta version. As of now, it should work for all charts enabled in the Type dropdown.
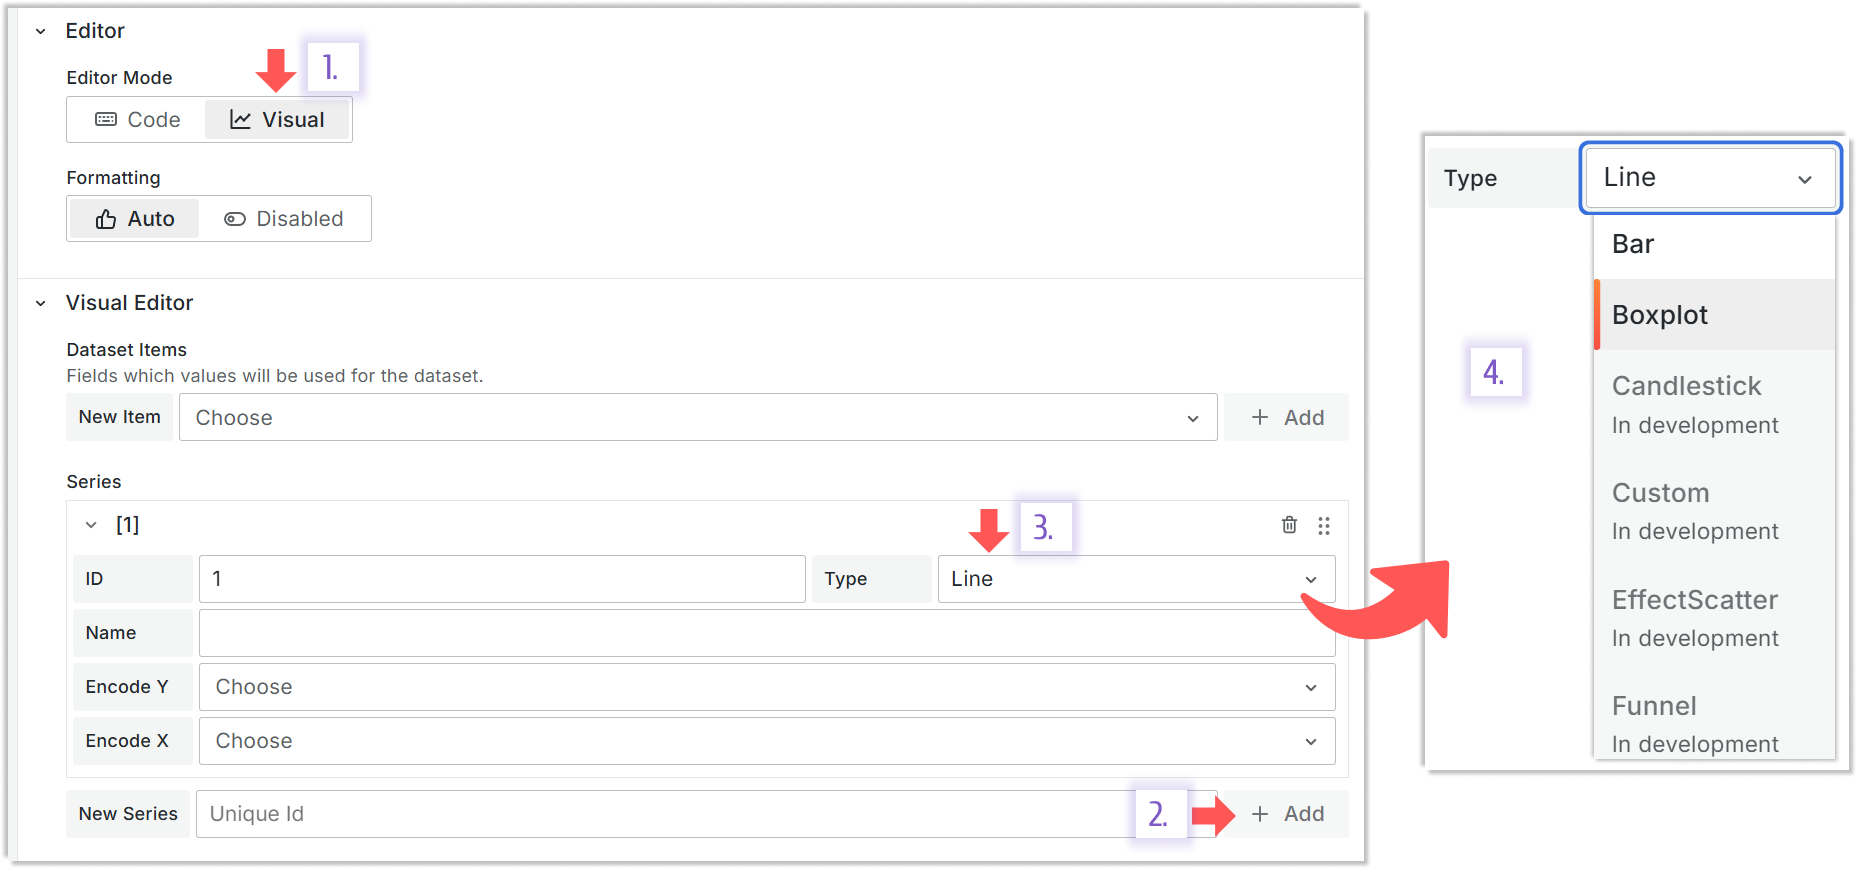
In development means that this type is coming soon. All other types are available for selection.
Boxplot
The boxplot is a chart depicting a variable distribution in a compact way where you can compare it over time or between multiple entities.
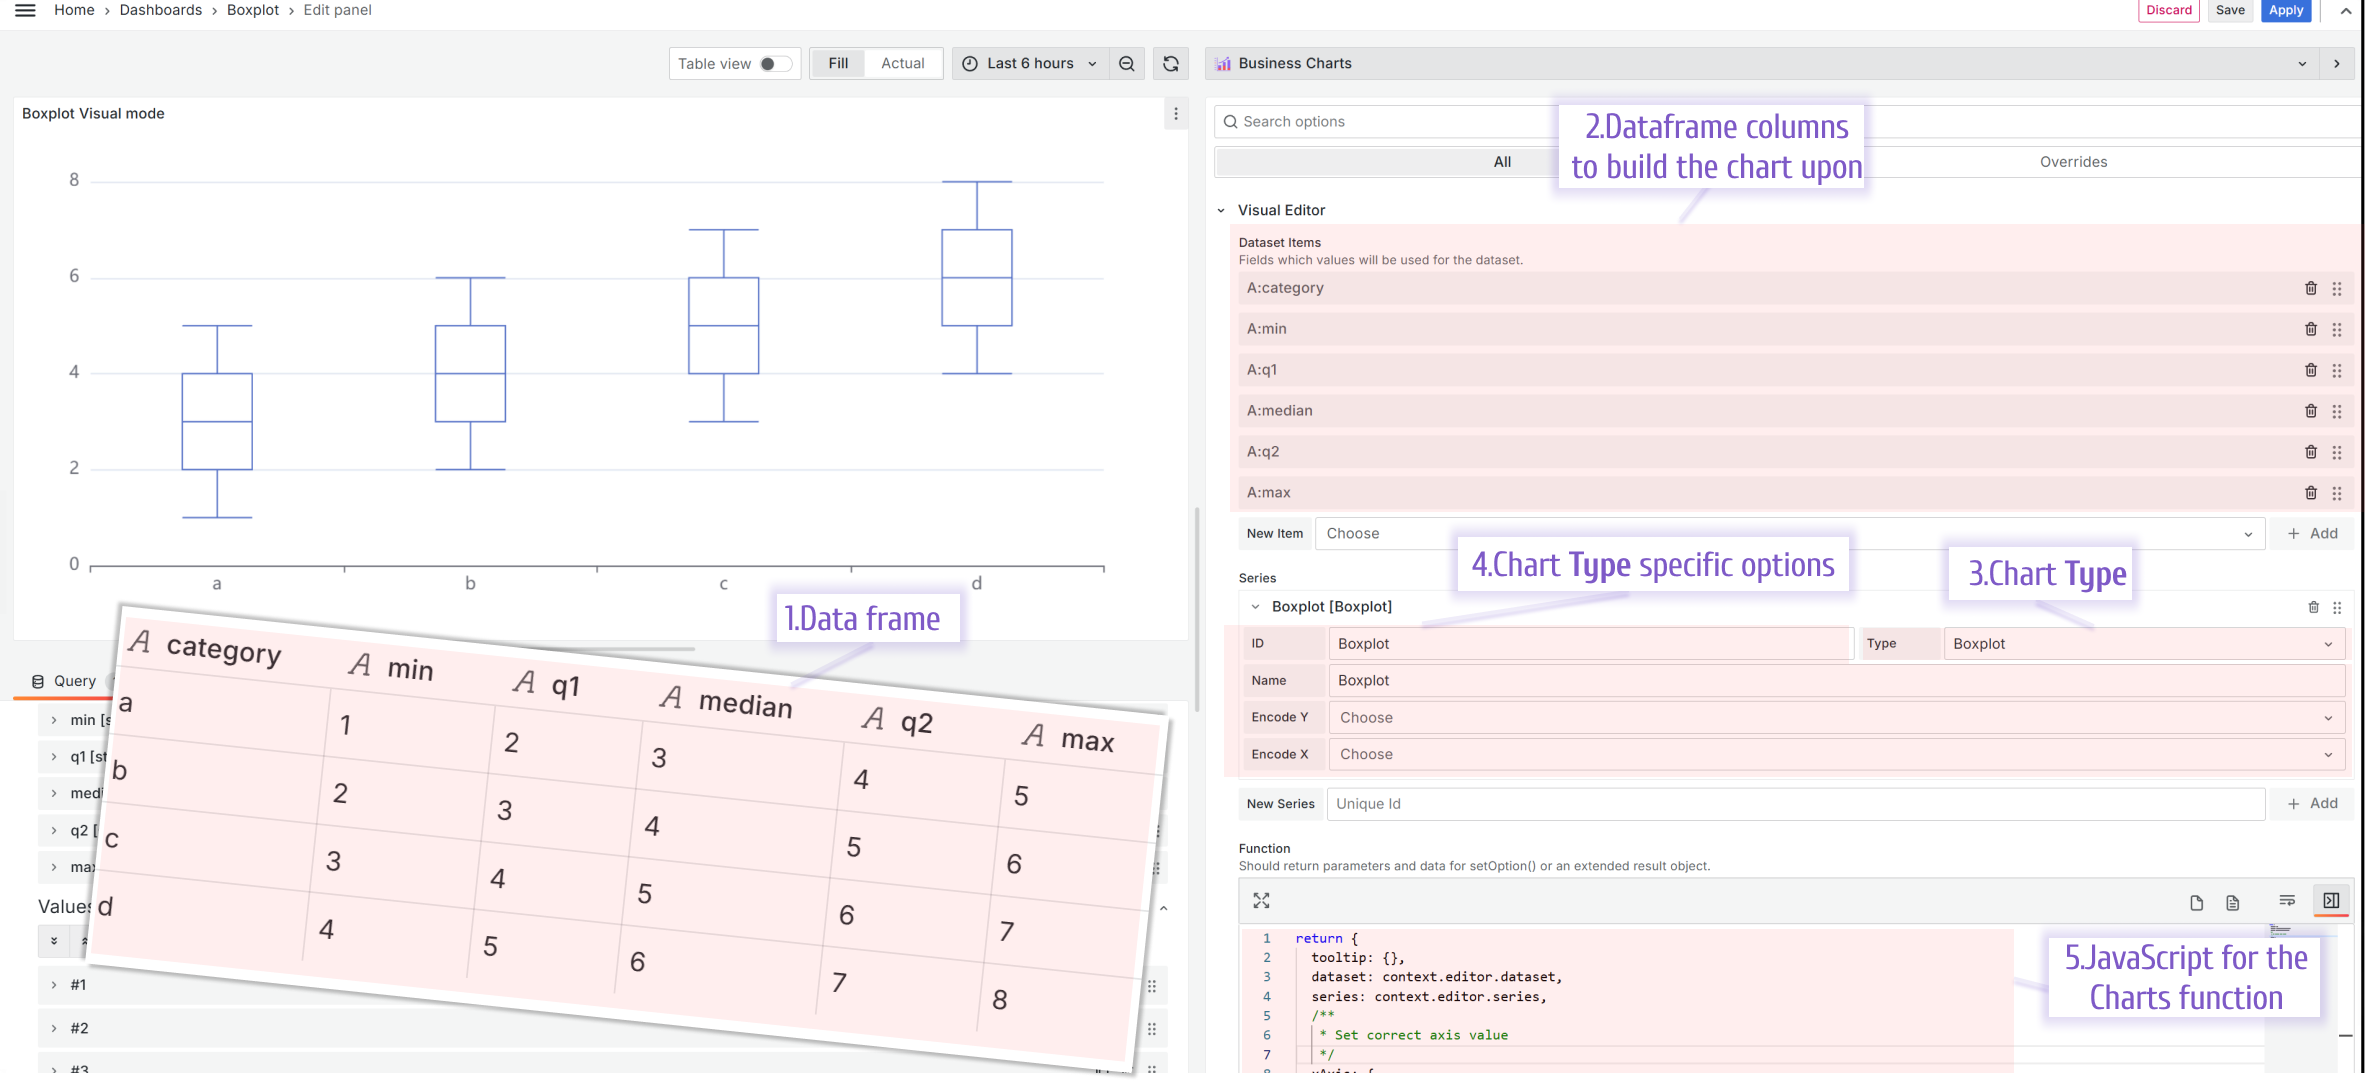
- Required dataframe. For each distribution, you provide the minimum, the first quartile (25% mark), the median, the third quartile (75% mark), and maximum values.
| Category | min | q1 | median | q3 | maximum |
|---|---|---|---|---|---|
| a | 1 | 2 | 3 | 4 | 5 |
| b | 2 | 3 | 4 | 5 | 6 |
| c | 3 | 4 | 5 | 6 | 7 |
| d | 4 | 5 | 6 | 7 | 8 |
-
Datasets. For the Boxplot, you need to add six datasets, where the first dataset should contain the category, then minimum values, first quartile, median, third quartile, and maximum. The order of the datasets is important.
-
Chart Type. Set it to the Boxplot.
-
Chart Type specific options. There are no specific options to specify with the latest plugin release.
-
Charts Function.
return {
  tooltip: {},
  dataset: context.editor.dataset,
  series: context.editor.series,
  xAxis: {
    type: "category",
  },
  yAxis: {
    type: "value",
  },
};
Scatter
The scatter (also known as scatter graph, scatter plot, scatergram) is a chart that uses Cartesian coordinates to depict a value for two variables.
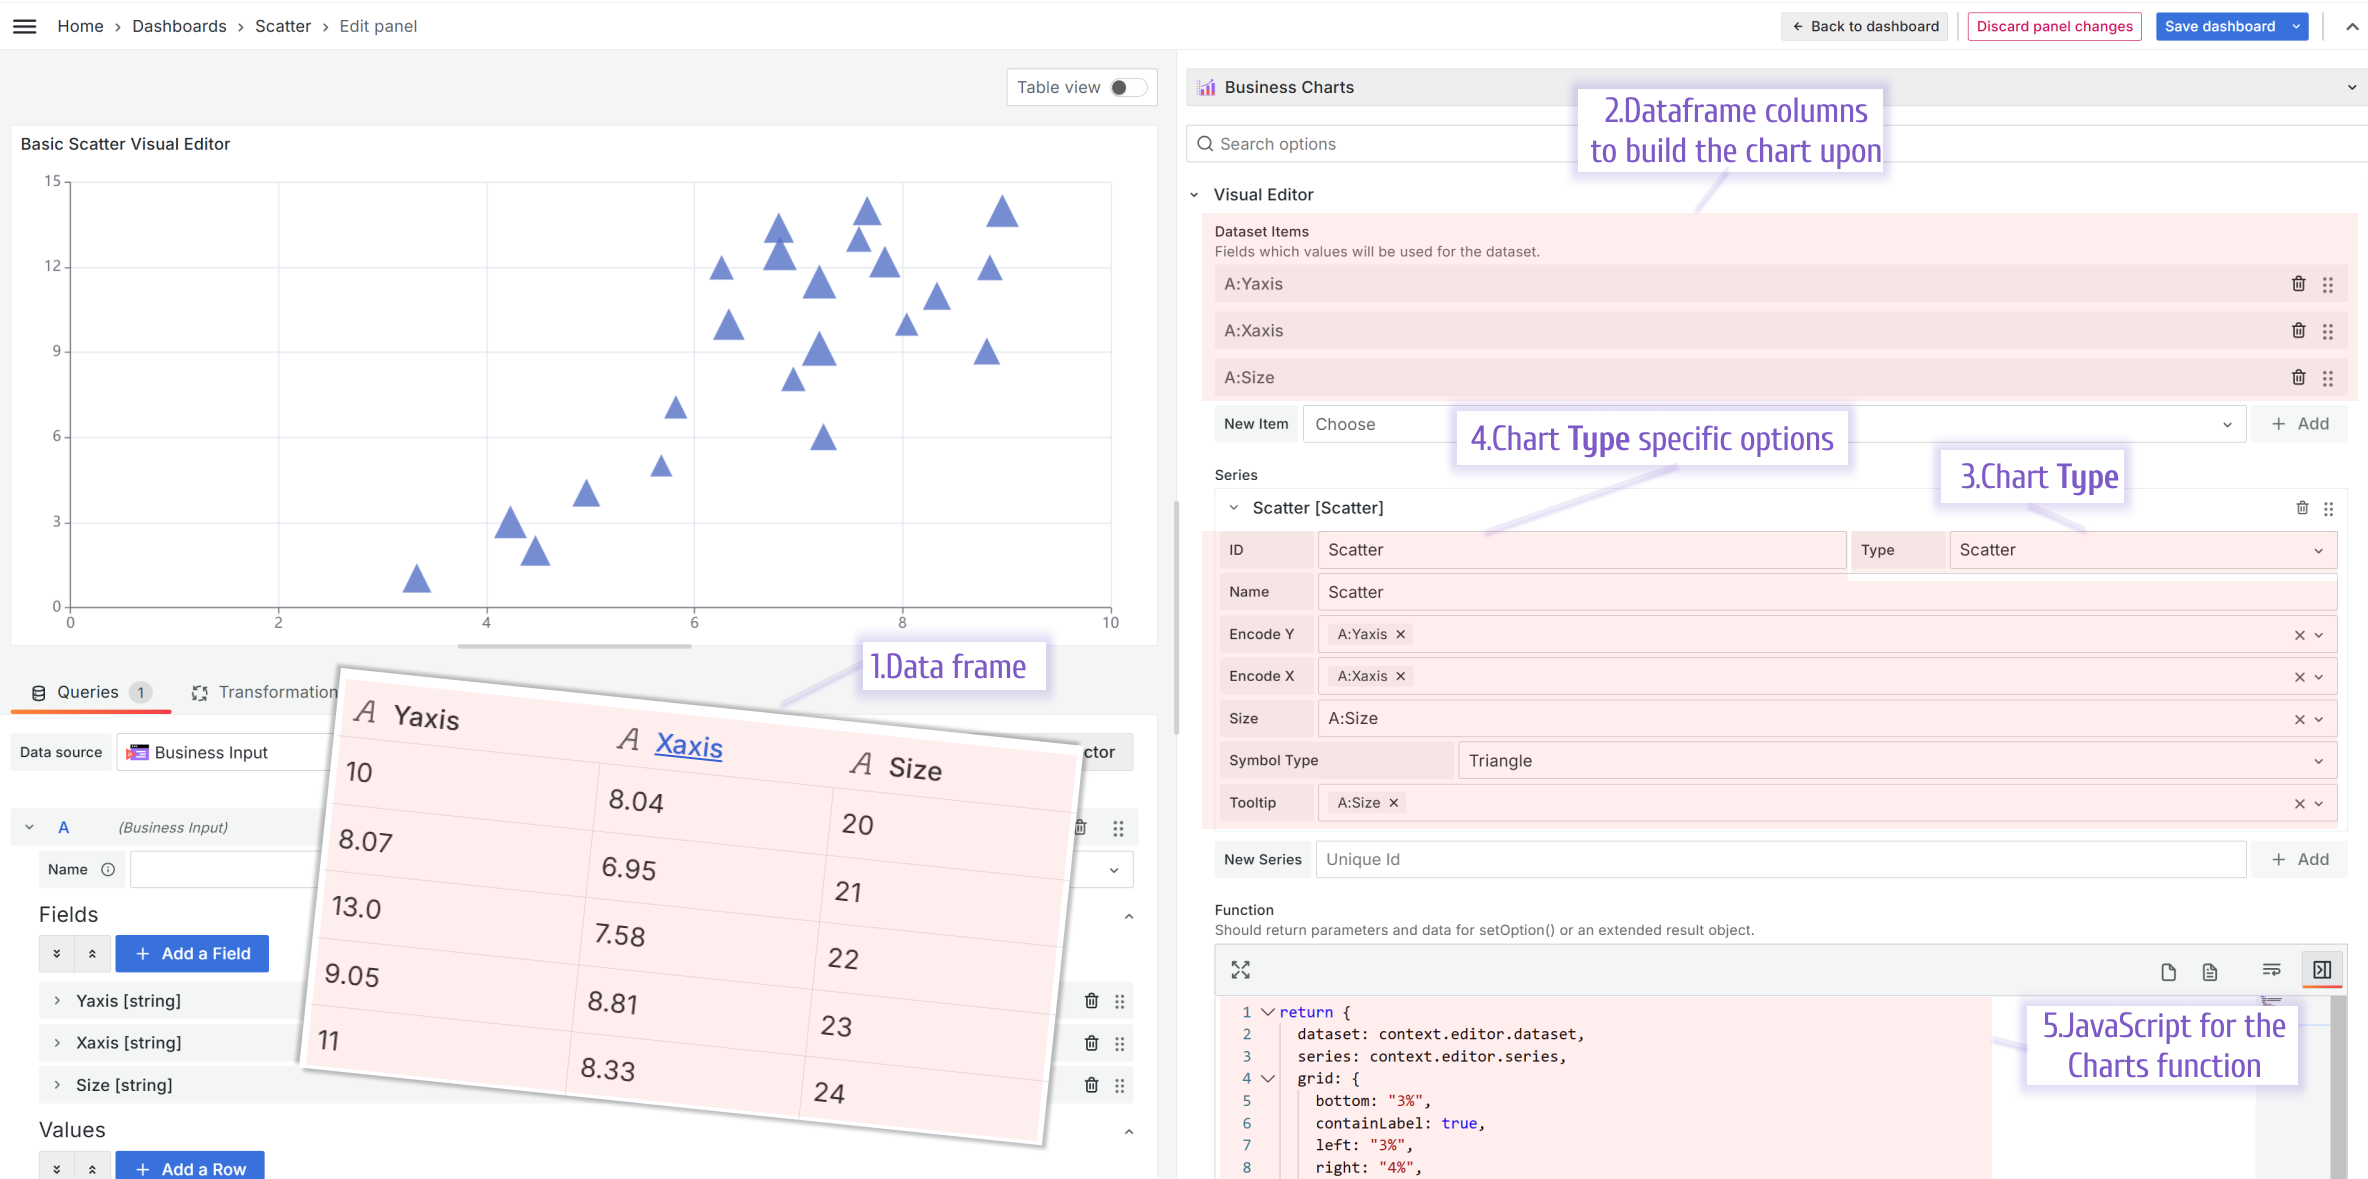
- Required dataframe. One data frame should consist of three columns, X and Y coordinates and then a value to display. For instance:
| Yaxis | Xaxis | Size |
|---|---|---|
| 10 | 8.04 | 20 |
| 8.07 | 6.95 | 21 |
| 13.0 | 7.58 | 22 |
| 9.05 | 8.81 | 23 |
| 11 | 8.33 | 24 |
-
Datasets. For the Scatter, you need to add three datasets.
-
Chart Type. Set it to the Scatter.
-
Chart Type specific options. Specify which dataset should play the role of X coordinates, Y coordinates, and the value associated with each (x,y) coordinate.
-
Charts Function.
return {
  dataset: context.editor.dataset,
  series: context.editor.series,
  grid: {
    bottom: "3%",
    containLabel: true,
    left: "3%",
    right: "4%",
    top: "4%",
  },
  /**
   * Should be added to see tooltip
   */
  tooltip: {},
  xAxis: {
    type: "value",
  },
  yAxis: {
    type: "value",
  },
};
Added Promise libraries import
We started decoupling plugin's core from the embedded libraries to make the Business Charts panel more flexible and lightweight. As of this release, all libraries are still part of the Business Charts panel. However, we are getting ready for a complete split in v7.0.0.
Starting from this release, it is optional and will become mandatory in the upcoming releases to import an external library using the Promises technology.
The syntax is identical to the Business Text import functionality.
/**
 * echarts-stat import
 */
import("https://esm.sh/echarts-stat@1.2.0").then(({ default: ecStatImport }) => {
  context.echarts.registerTransform(ecStatImport.transform.regression);
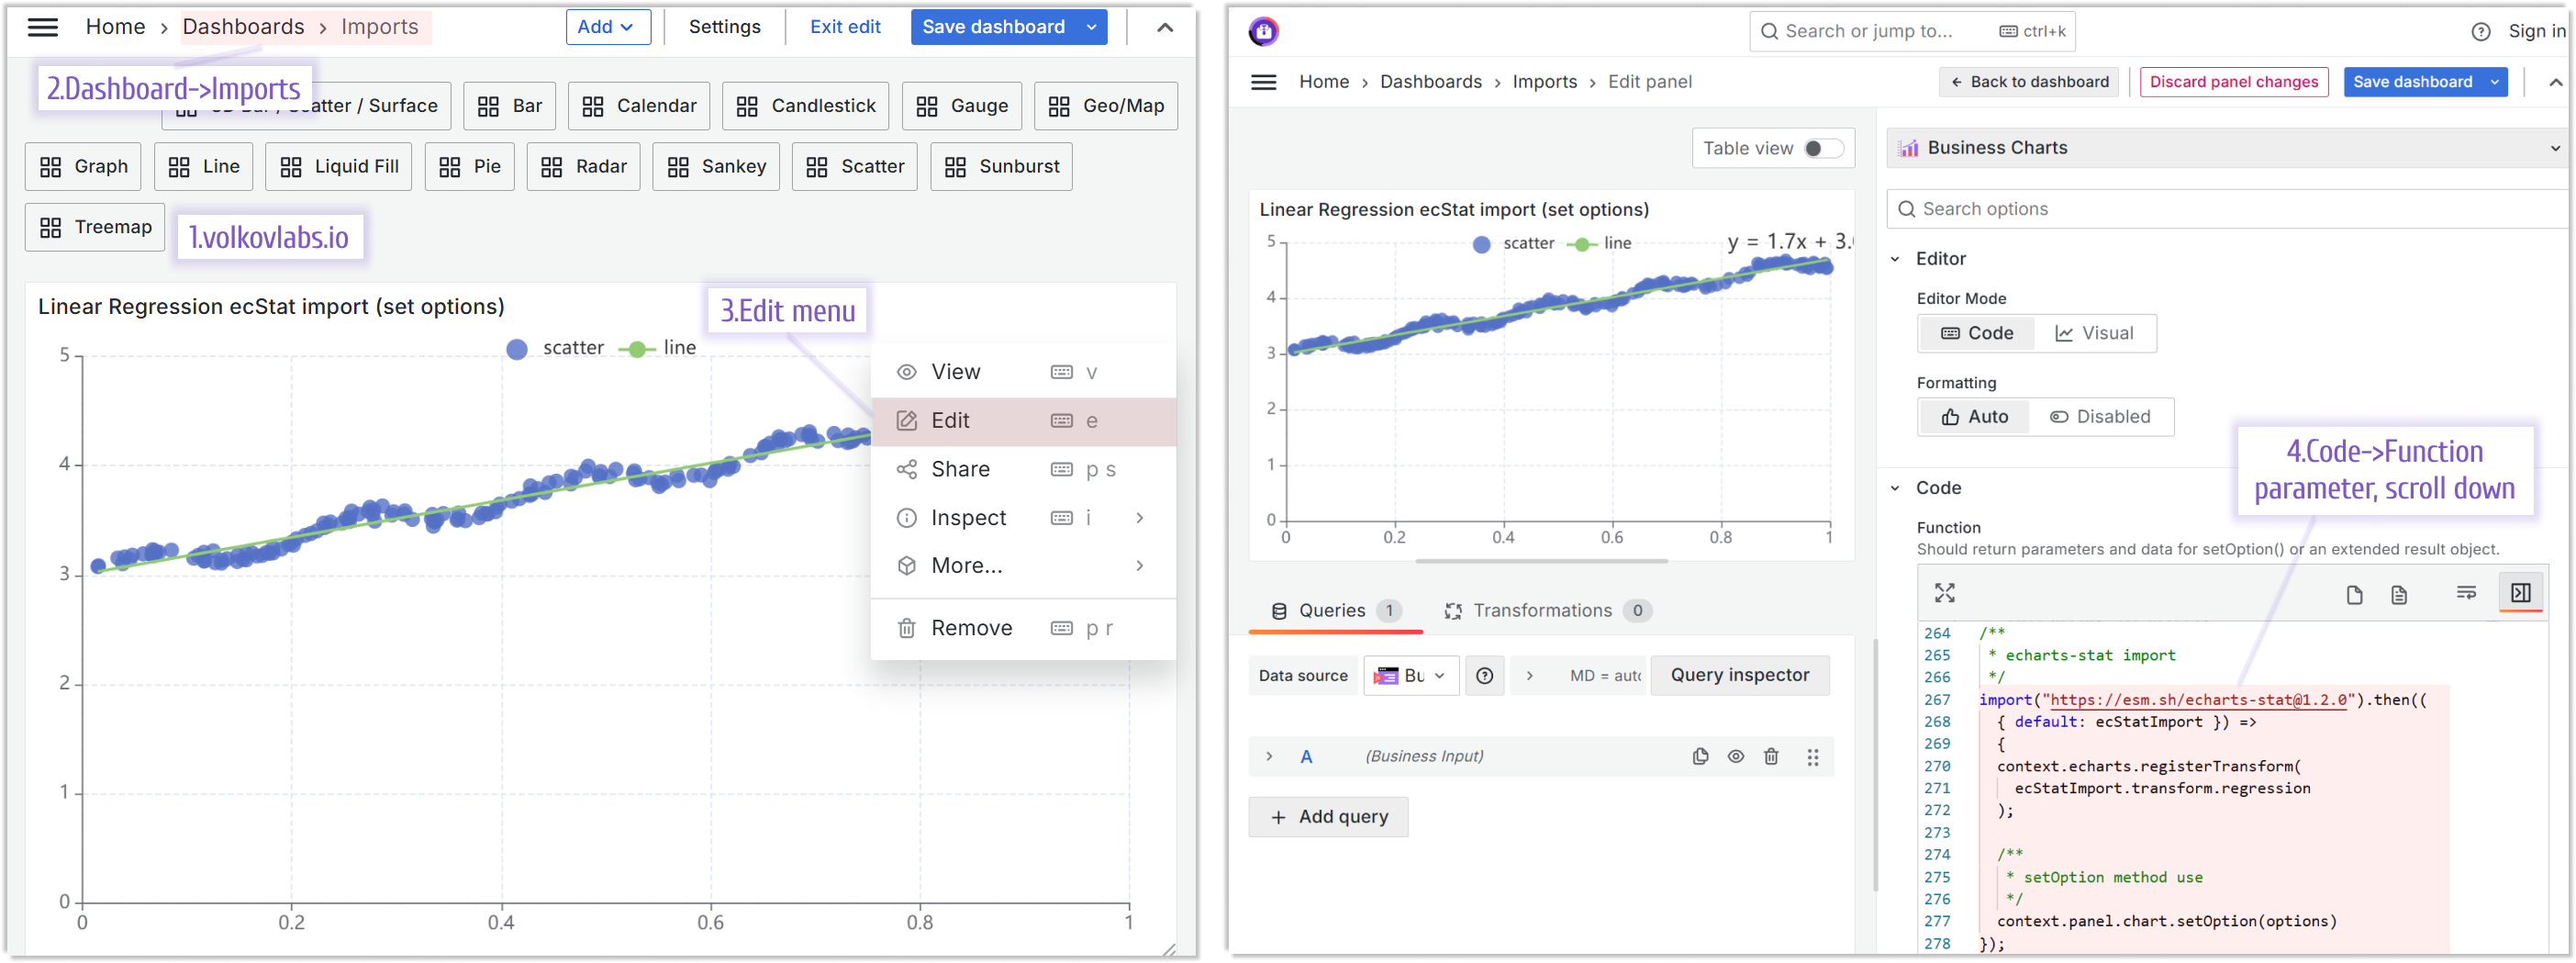
You can review the above example in our sandbox project.
The detailed steps are outlined below:
- Go to the echarts.volkovlabs.io
- Open Dashboards -> Imports.
- Open any panel in the Edit mode, for instance, the linear regression chart.
- Scroll down in the Code->Function parameter almost to the end.
Compatibility with Grafana 11.3 and Scenes-powered dashboards
The Scenes powered dashboards in Grafana 11.3 release introduced some breaking changes for our plugins.
Starting from release 6.5.0, the Business Charts panel fully migrated to support Grafana 11.3.
Getting Started
You can install the Business Charts panel from the Grafana Plugins catalog or using the Grafana command line tool.
For the latter, please use the following command.
grafana cli plugins install volkovlabs-echarts-panel
Tutorial
This is the first video we created about Business Charts after the plugin rebranding. It features dazzling chart examples followed by a high-level plugin architecture. Knowing the basics of plugin architecture will help you create your custom charts.
To get you started quicker we prepared the web resource with numerous ready-to-use examples. In the video, Daria demonstrates how to work with this resource.
The main obstacle for many plugin users is the data transmission from the Grafana data frame(s) into the Charts function. In the video, in addition to the resource with how-to examples, Daria introduces the Visual Editor - the mechanism we started to work on to simplify the transmission.
We have many other tutorials that you can find helpful. You can review all related to this plugin tutorials here.
Release Notes
Features / Enhancements in 6.5.0
- Updated Autosize Code Editor toolbar (#341)
- Updated refresh for dashboard scene (#346)
- Updated Grafana 11.3.0 and dependencies (#346)
Features / Enhancements in 6.4.1
- Updated Gauge dashboard (#337)
- Updated Code Editor toolbar (#338)
Features / Enhancements in 6.4.0
- Added Boxplot in Visual Editor (#327)
- Updated Grafana 11.2 dependencies (#330)
- Added Scatter to Visual editor and limit selection to supported charts (#332)
- Added promise libraries import (#333)
- Updated Code editor toolbar (#334)
Volkov Labs Is Now Closed
Following our acquisition, Volkov Labs has officially ceased operations as of September 26, 2025. We are no longer accepting feedback, support requests, or partnership inquiries. The Business Suite for Grafana repositories have been archived on our GitHub organization, and no further development or support will be provided.
We are deeply grateful for the incredible support from our community and partners over the past four years.

