First public release of Business Satellite 1.0.0

A new plugin Business Satellite Data Source 1.0.0 was released today. This first release
- Allows connecting to Local and Remote Grafana instances via HTTP API using API Keys and Tokens.
- Tested with Grafana HTTP API versions 8.5+. It may work with previous versions.
- Allows retrieving Health information, Annotations, Alerts, and Data Sources.
- Supports Dashboard annotations to display filtered annotations and alerts.
- Based on the Grafana 9.3.6 toolkit and workflows.
Why?
Imagine you have many Grafana instances and you want to
- Quickly check information, configuration and usage reports from all of them.
- Validate users and teams across all instances.
- Display annotations collected from many instances on a Time Series panel.
Even if you have a single Grafana instance and you want to display Alerting Annotations filtered by variable on a Time Series panel, which was one of the reasons we created this data source. We will discuss this use case in the upcoming blog.
First release
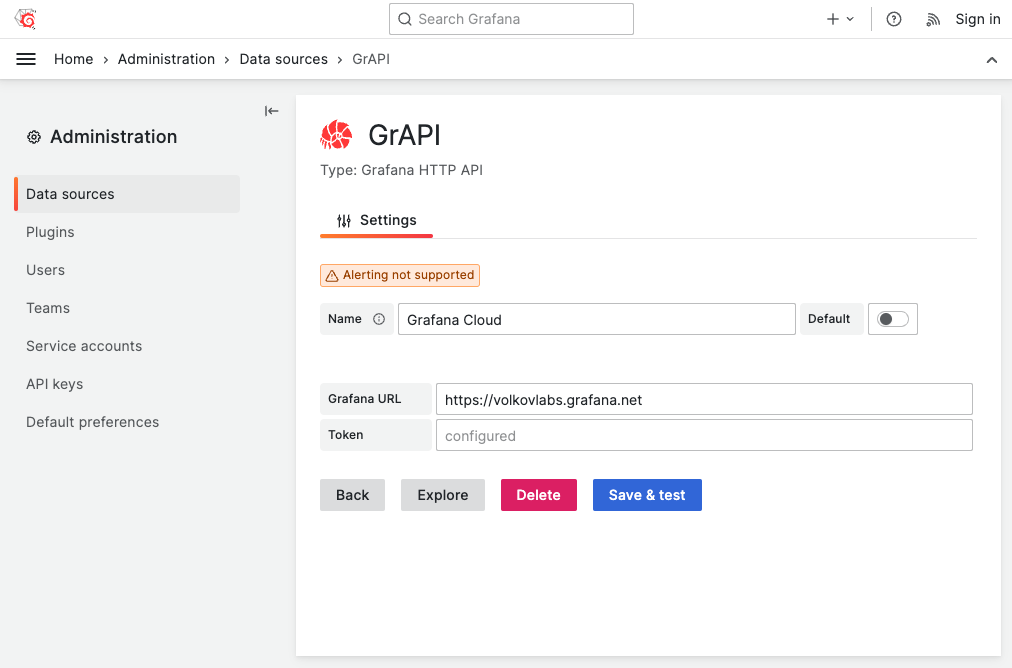
This is the first release of the Business Satellite Data Source. It is a game-changer to retrieve annotations, check health information, and verify the configuration of the local and remote Grafana instances, including Grafana Cloud.
Grafana HTTP API requires API Key or Token to access local and remote instances.
Highlights
The first release can retrieve
- Health information.
- List of Data Sources.
- Annotations and Alarms with filter capabilities.
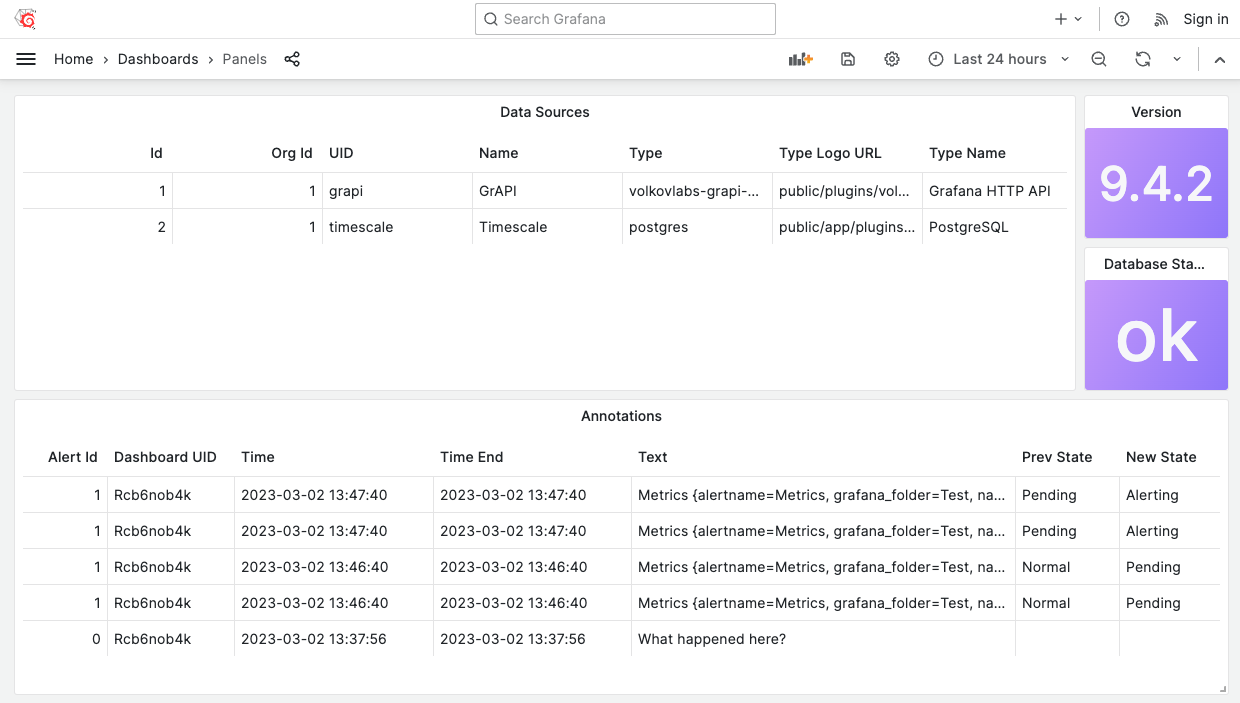
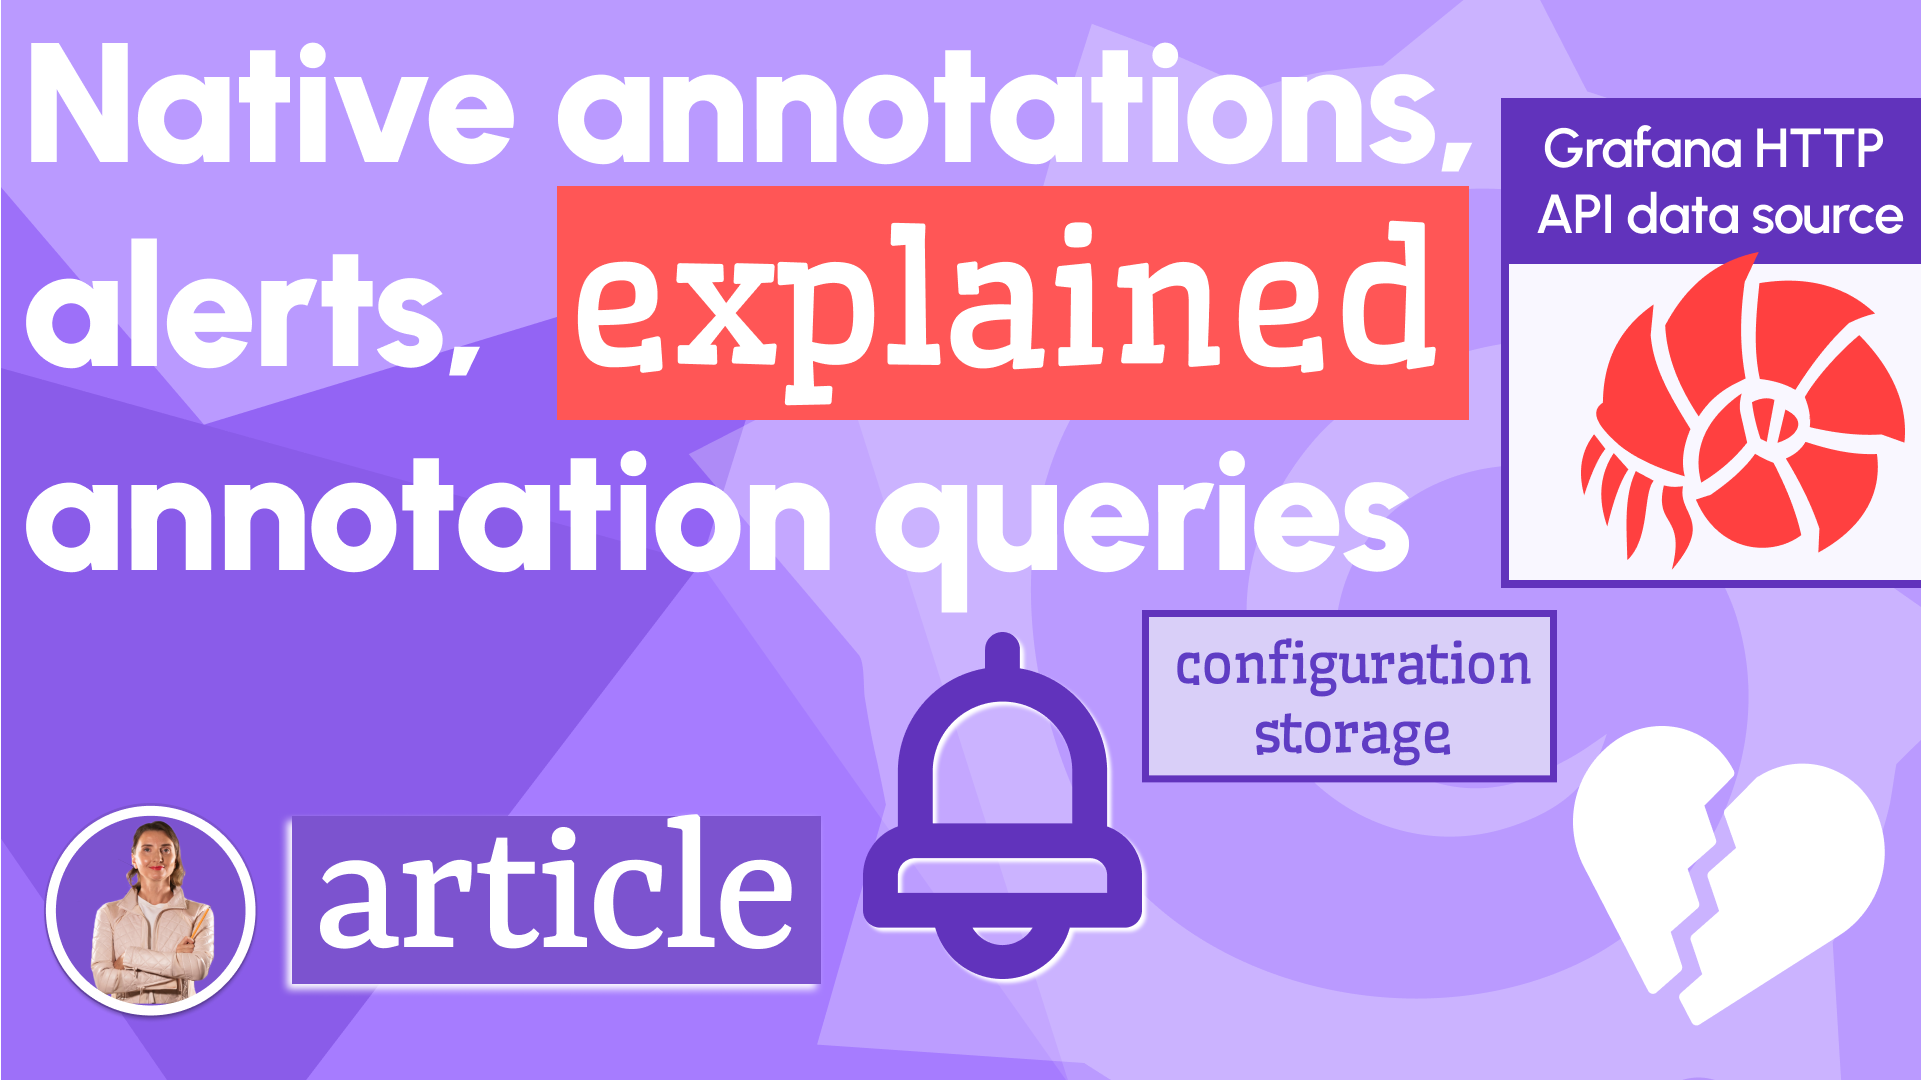
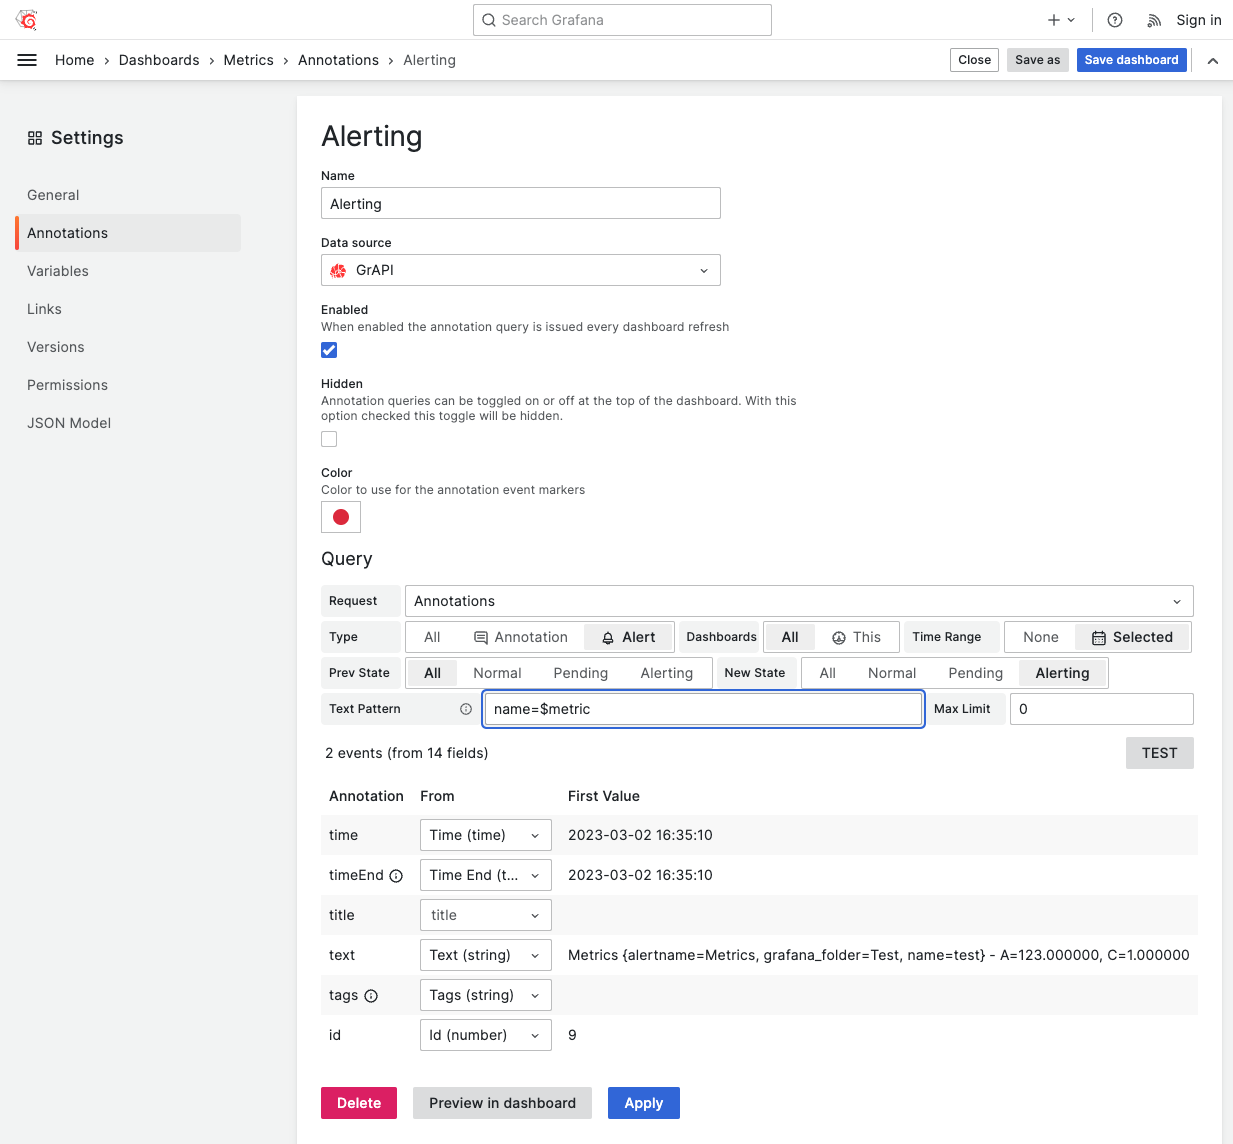
Annotations
Business Satellite Data Source supports Dashboard annotations to display filtered annotations and alerts.
| Filter | Options |
|---|---|
| Type | All, Annotation, or Alert. |
| Dashboards | All or This. |
| Time Range | None or Selected in the dashboard. |
| Prev State | All, Normal, Pending, or Alerting. |
| Next State | All, Normal, Pending, or Alerting. |
| Text Pattern | Supports Regular expressions and variables. |
| Max Limit | Maximum number of annotations to retrieve. |
Getting Started
The Business Satellite data source can be installed from the Grafana Catalog or utilizing the Grafana command line tool.
For the latter, please use the following command.
grafana cli plugins install volkovlabs-grapi-datasource
Tutorial
Daria starts with Grafana widgets, explaining its limitations and how with the Business Satellite data source you can have flexible visualizations of anything stored in the Grafana central repository (settings, metadata, alerts, and annotations). She touches upon Grafana's transformations to show little data transformation tricks.
Towards the end, she demonstrates how the Business Satellite data source supports the regex pattern conditions to let you work with the cherry-picked data elements you need.
Release Notes
Features / Enhancements
- Initial release based on Volkov Labs Data source template
- Update README and configuration (#1)
- Add Postgres for Alerting (#2)
- Add Annotations (#3)
- Update name to Grafana HTTP API (#4)
- Improve Annotations and update to Timescale (#5)
- Improve Data Source to check Organization (#6)
- Add Notifications and increase Test Coverage (#7)
- Add Annotation filters (#8)
- Add Annotation Alert States filter (#9)
- Add Health and Data Sources (#10)
- Update README to prepare for the release (#11, #12)
We're Always Happy to Hear From You!
We value your feedback and are eager to connect with our community and partners. Whether you have a question, an idea, or an issue to report, here’s how you can reach out:
- Community Members: Have a question, want to suggest a new feature, or found a bug? We’d love to hear from you! Please create a GitHub issue to start the conversation.
- Enterprise Partners: Need assistance or have an urgent request? Open a Zendesk ticket for a prompt and dedicated response from our team.
- Join the Conversation: Stay updated and share your thoughts! Subscribe to our YouTube Channel and leave your comments—we can’t wait to hear what you think.
Your input helps us improve, so don’t hesitate to get in touch!