We created panel plugin template for Grafana


Grafana has excellent tutorials on building panel plugins, but we found ourselves repeating the same steps when creating custom plugins for our customers. Eventually, we decided to create our template for a panel plugin, which I hope can be helpful for the community.
Grafana's tutorial Build a panel plugin provides information on setting up the environment, creating a new plugin, and explaining the basics of a panel development using data frames and options control. It's a great starting point, and we recommend reading it before continuing with this article.
As I mentioned before, we wanted to have a template, which can be used as a base for a new panel with everything in place and updated to the latest version of Grafana. We called it the Abc panel template.
Since publishing this blog Abc panel template was archived. We recommend to use Plugin Tools to create new plugins.
Panel plugins
Panels allow visualizing of data received from data sources. While Grafana has several built-in panels like Table, Time Series, and Text, you can also create your custom panels.
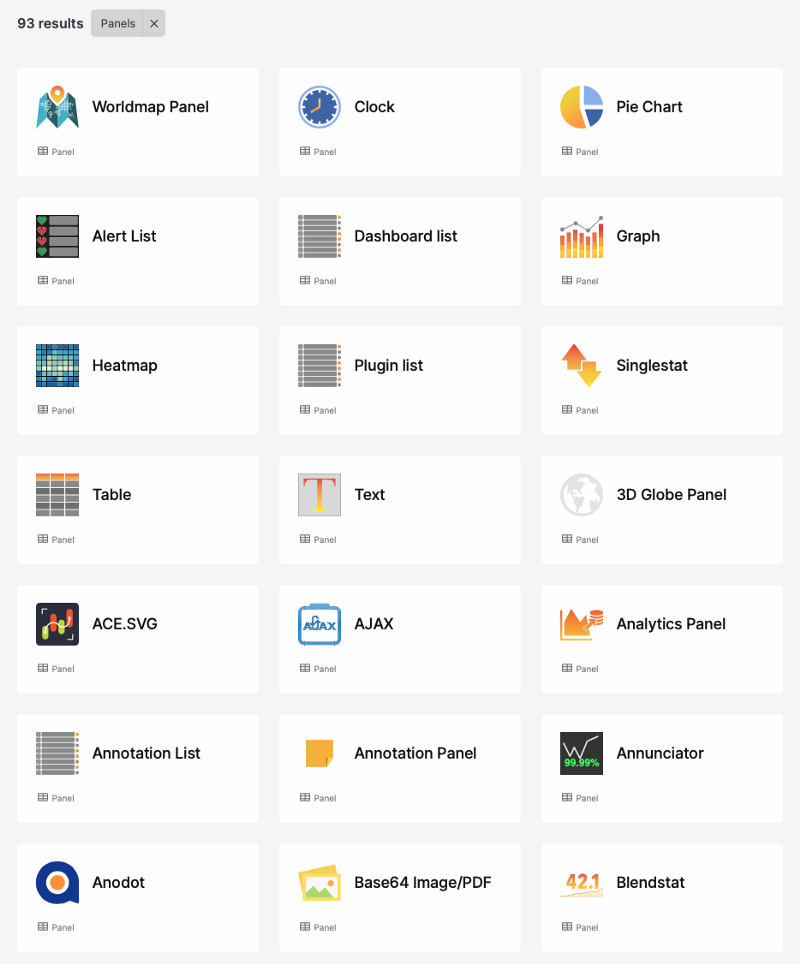
There are a lot of use cases that require custom visualization with additional logic implemented on the front end, which goes beyond standard and available panels.
Docker container
For all of our developments, we use Docker and Docker Compose to orchestrate containers. Compose is a tool for defining and running multi-container Docker applications.
Here are some benefits of using Docker containers compared to locally installed Grafana.
- Easy to deploy and share configuration with team members and customers.
- Allows testing plugins against multiple versions and the main branch to be prepared for the upcoming release.
- Docker always starts from a fresh configuration with initial Provisioning done automatically (more information below).
Our typical configuration for Grafana is included in the template.
version: "3.4"

services:
  grafana:
    container_name: grafana
    image: ghcr.io/volkovlabs/app:latest
    ports:
      - 3000:3000/tcp
    environment:
      - GF_DEFAULT_APP_MODE=development
      - GF_DASHBOARDS_DEFAULT_HOME_DASHBOARD_PATH=/etc/grafana/provisioning/dashboards/panels.json
      - GF_INSTALL_PLUGINS=marcusolsson-static-datasource
    volumes:
      - ./dist:/var/lib/grafana/plugins/volkovlabs-abc-panel
      - ./provisioning:/etc/grafana/provisioning
In this configuration, Grafana starts in Anonymous mode and does not require authentication. Any plugins can be installed at the start-up automatically.
We use the Business Input Data Source to prototype the idea and then include additional services to Docker Compose and corresponding data sources to Grafana.
Building and Signing
Before starting the Grafana container, the plugin should be built and signed in the /dist folder. The other option is to enable the development mode.
The /dist folder is mounted to the Grafana container in the provided configuration. Plugin signing was introduced in Grafana 7.0 and became mandatory for Grafana 8.0. Take a look at the Documentation about different signing levels.
To build and sign plugins as Private we use scripts configured in the package.json file. When the plugin is ready to release, the signature can be updated by the Grafana team to Community or Commercial and the parameter rootUrls can be removed.
"scripts": {
    "build": "grafana-toolkit plugin:build --coverage",
    "sign": "grafana-toolkit plugin:sign --rootUrls http://localhost:3000/",
  },
Visual Studio Code
Scripts can be executed using the command line or Visual Studio Code, which is our preferred UI for development, and we recommend it to our clients who want to contribute and follow the process.
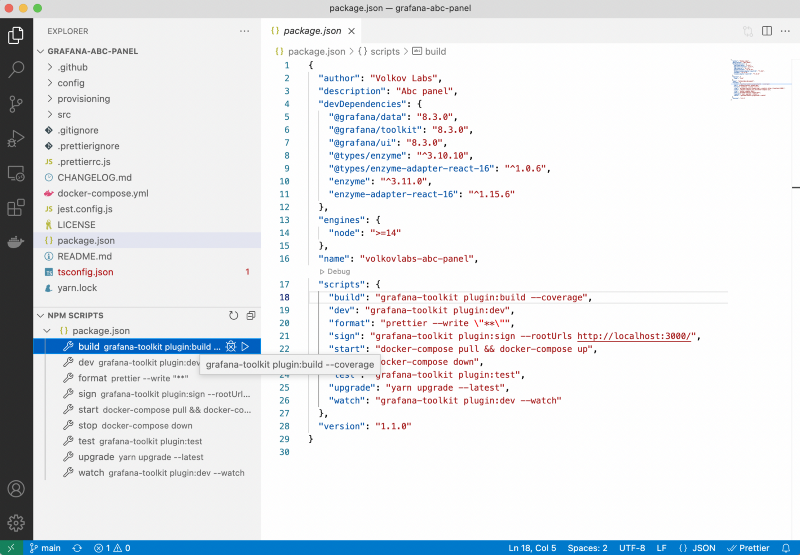
You may notice special --coverage flag added to the build command to generate coverage files, which are uploaded and reviewed as a part of Continuous Integration (CI).
Provisioning
To make the development process repeatable, transferrable, and easier for the Grafana team to Review, we create provisioning files to add data sources, application plugins, and dashboards in the /provisioning folder.
Here is an example of how to add a Business Input Data Source:
apiVersion: 1

datasources:
  - name: Business Input
    type: marcusolsson-static-datasource
    access: proxy
    isDefault: true
    orgId: 1
    version: 1
    editable: true
To add or update dashboards, they should be exported as Global and placed in the /provisioning/dashboards folder. Detailed information can be found in the Grafana Documentation.
Testing and Continuous Integration
Validating test coverage is included in the CI workflow. To track coverage, we use CodeCov - the leading Code Coverage solution.
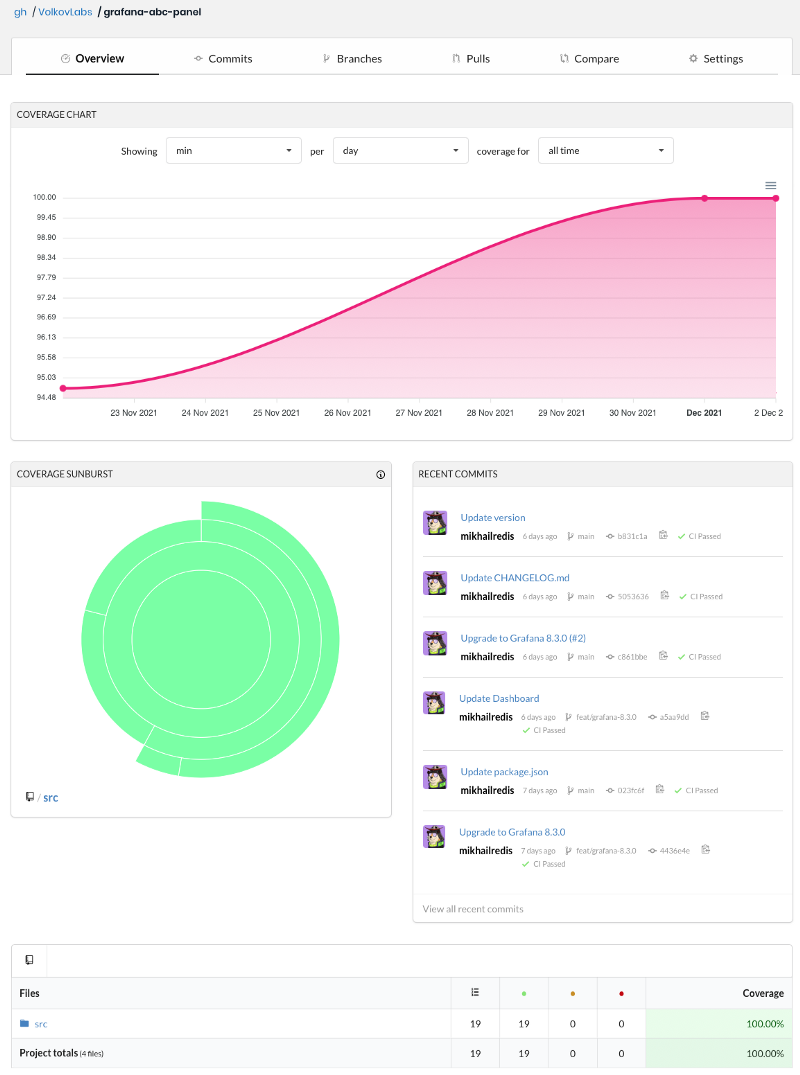
On every commit, GitHub CI Action checks the plugin's functionality by running tests and submitting coverage to CodeCov. With additional functionality, overall test coverage can decrease, and the action fails. The CodeCov can track it and help you keep the test coverage at an acceptable level.
Here is a part of the GitHub Action to submit coverage to CodeCov.
- name: Upload coverage to Codecov
  uses: codecov/codecov-action@v2
  with:
    directory: ./coverage/
    files: ./coverage/lcov.info
    env_vars: OS,PYTHON
    fail_ci_if_error: true
Long-term Support
Every release of Grafana introduces new features, breaking changes, and minor updates. Depending on the features and complexity of the custom plugin, some tests can fail, and parts of the code should be replaced or improved with every major Grafana release.
We recommend doing manual testing of custom plugins and applications for each new release. As mentioned before, Docker with Provisioning and CI included in the template makes it effortless.
Grafana Crash Course
We demonstrated how to create a panel plugin in the three parts series in the Grafana Crash Course section Build a panel plugin.