First community release of Business Variable 1.4.0

We are happy to announce the first community-signed version of Business Variable panel 1.4.0. This release includes the following updates:
- Added a Favorite icon to filter selected favorites.
- Added Tree View groups to provide location, configuration, manufacturer, etc. selections in the same panel.
- Added auto-scroll to the selected value when the panel loads.
- Added an option to display the variable name in front of the value.
- Updated Sticky scrollbar to support Grafana 9.
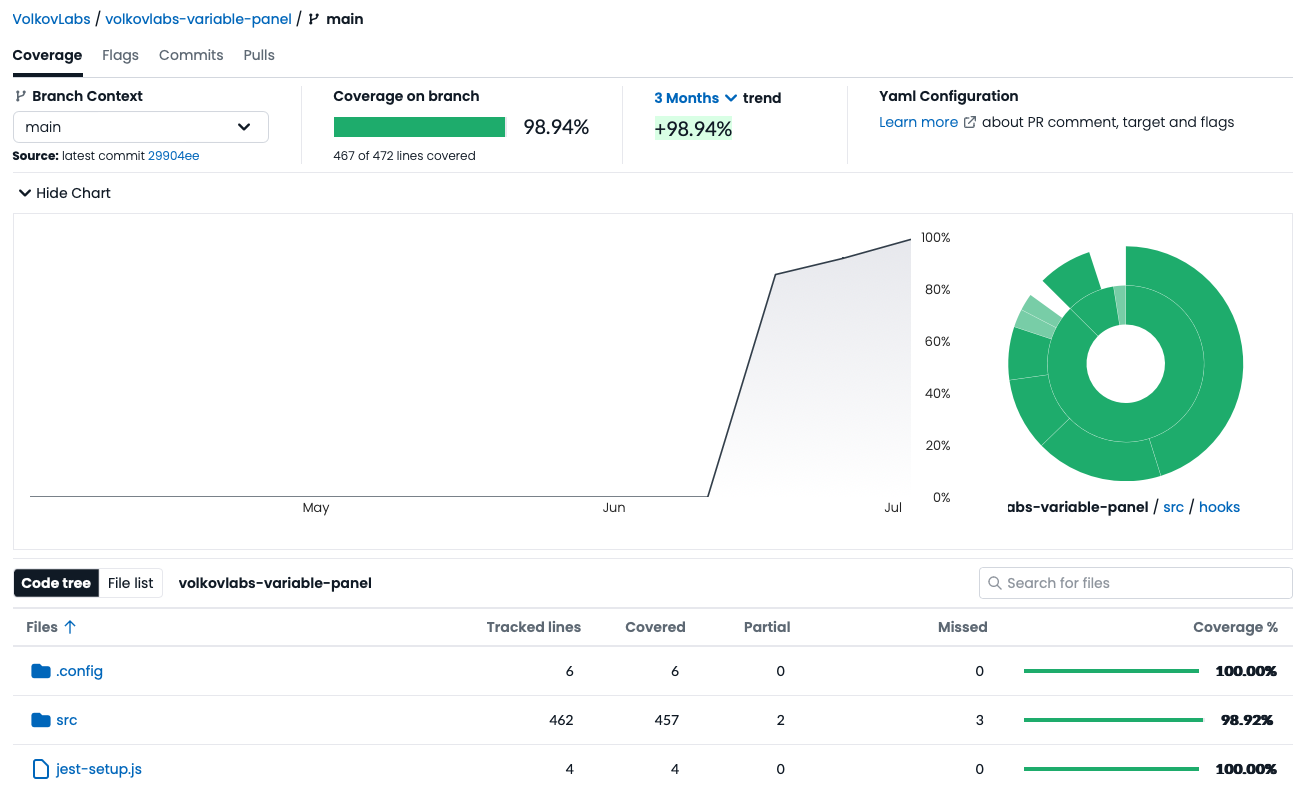
- Increased Test coverage to 99%.
Favorites
The variable panel allows selecting values as favorites, which are stored in the Web browser's storage and are unique for each user.
The new favorite icon in the header allows you to filter all selected favorites for quick navigation and selection.
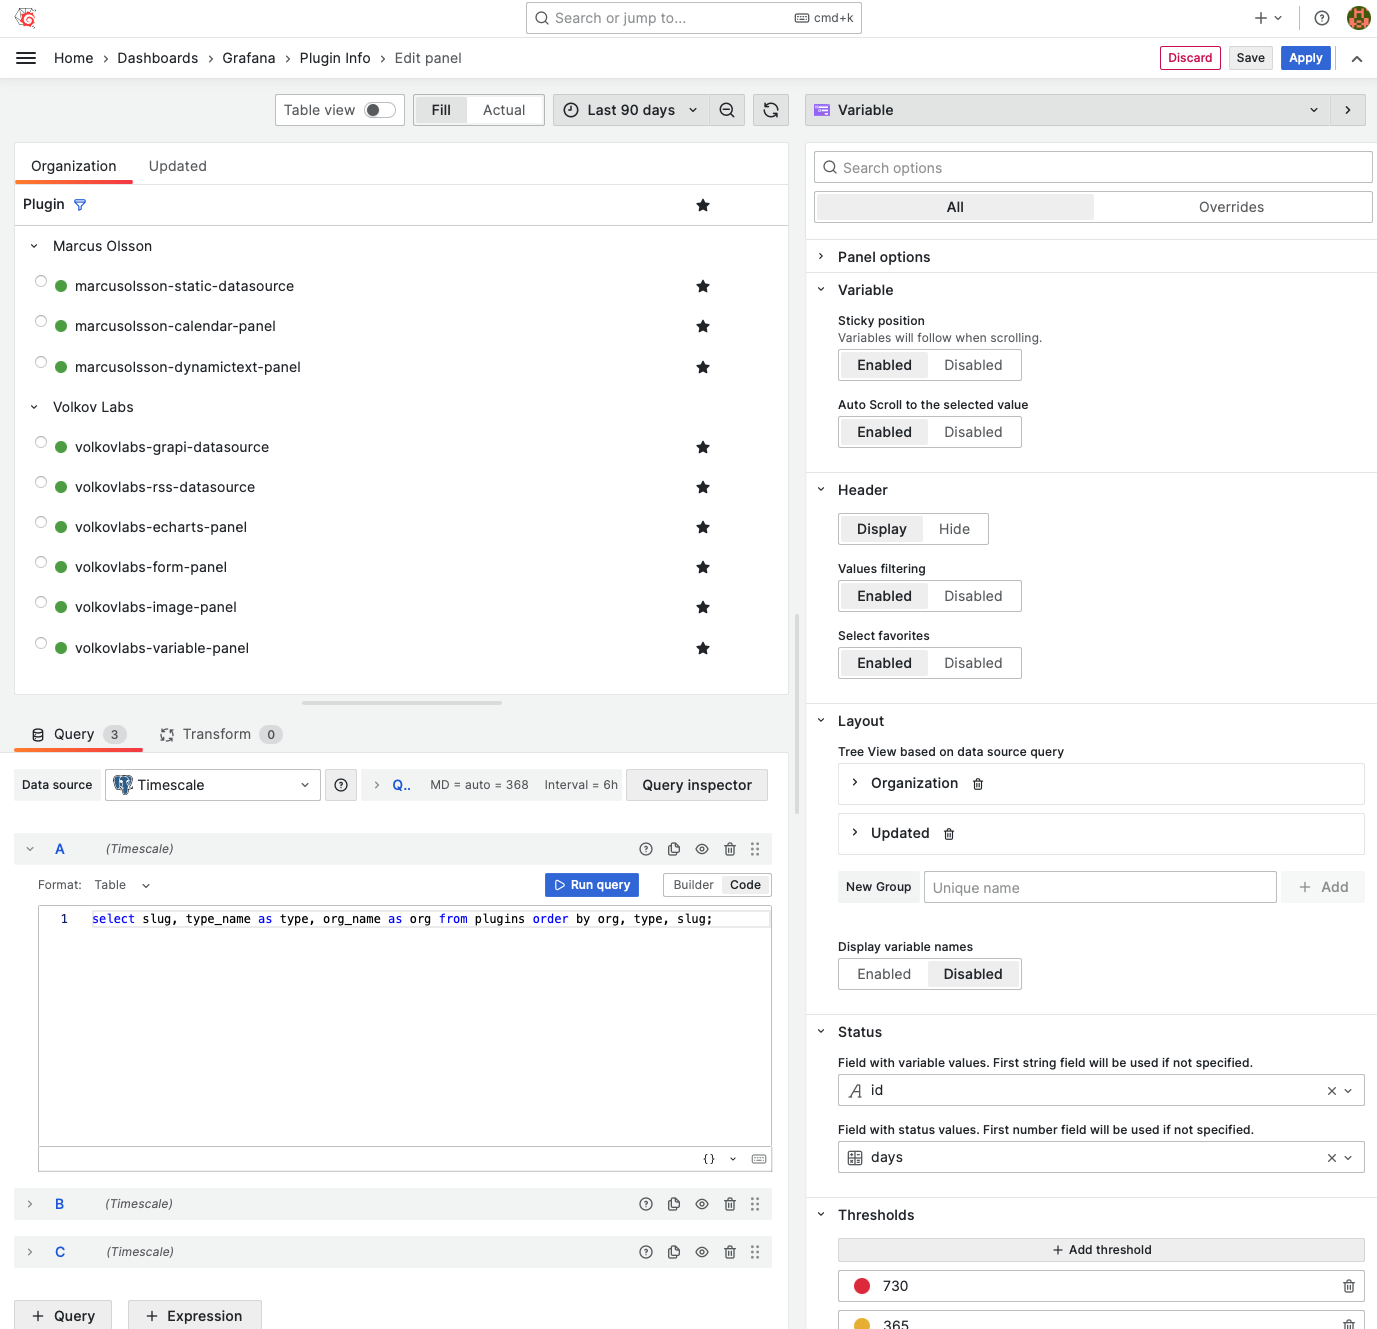
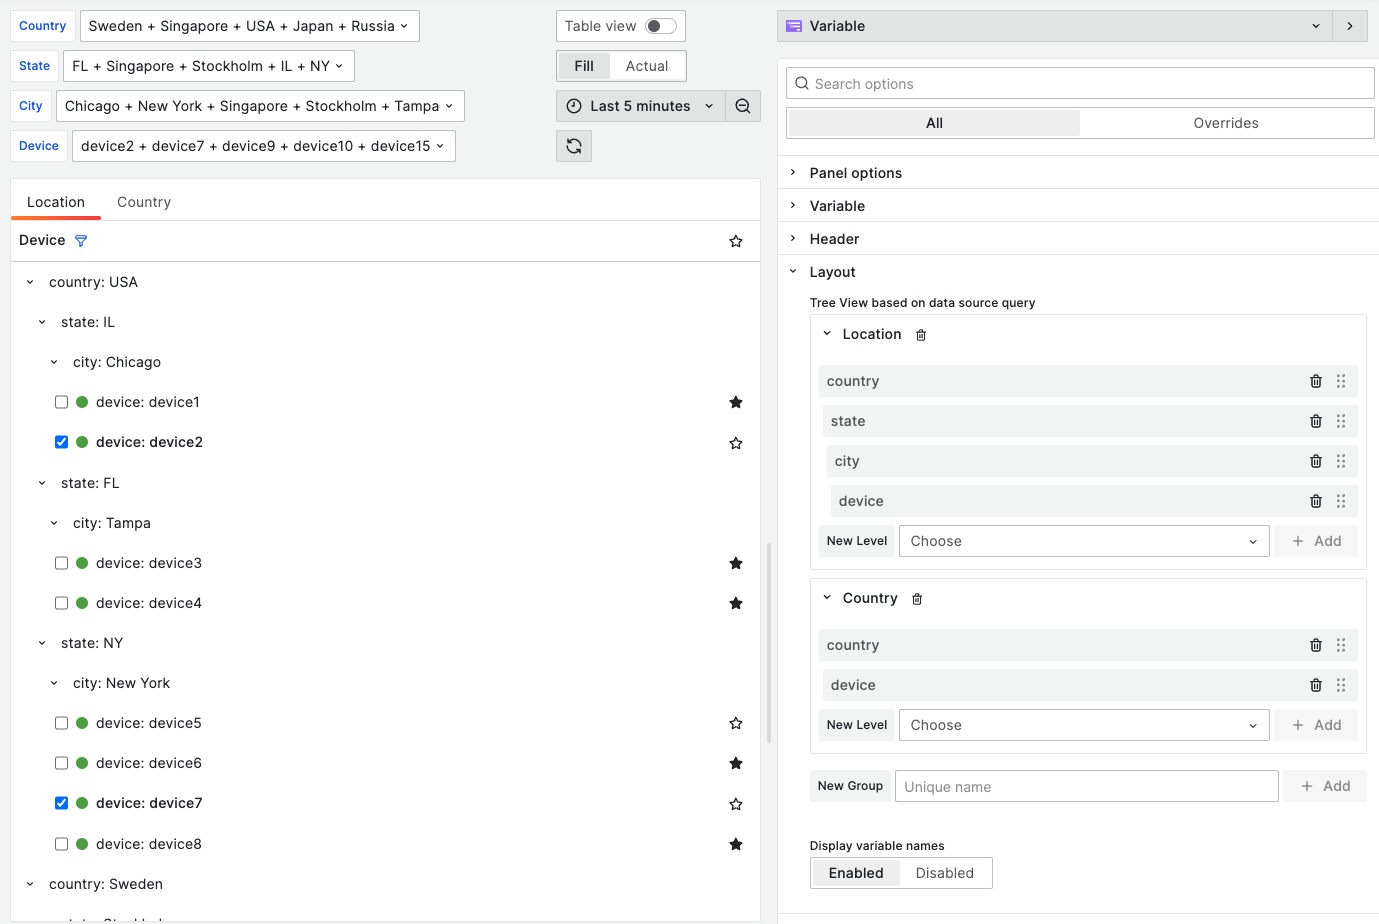
Tree View groups
Multiple tree view groups allow selecting variables based on location, configuration, manufacturer, etc.
Each group has its level configuration and is based on the data from the data frames. Levels from the data frame should have the same name as the variable.
An additional option to display the variable name in front of the value can be enabled to provide additional context for the users.
Test Coverage
For developing our plugins we use continuous integration with 80+% test coverage to make sure that any changes won't break existing functionality. We talked about it in our developing panel plugins series.
Getting Started
The Business Variable panel can be installed from the Grafana Catalog or utilizing the Grafana command line tool.
For the latter, please use the following command.
grafana cli plugins install volkovlabs-variable-panel
Tutorial
This video reviews the latest features introduced in Business Variable 3.0.0.
Daria demonstrates many new options for the Minimize mode, such as
- allow empty value,
- allow custom values,
- maximum visible values.
For the Table mode, she explains how to display total and selected counts. Further, Daria introduces a Slider mode and touches upon the TreeView layout improvements and advanced features.
For the all plugin options overview, please refer the other video.
We have many other tutorials that you can find helpful. You can review all related to this plugin tutorials here.
Release Notes
Features / Enhancements
- Add Tutorial (#21)
- Update adding new Level to last (#22)
- Hide unselectable items (#24)
- Use the main view scroll element to support Grafana 9 (#26)
- Add a Favorite icon to filter selected favorites (#25)
- Add Tree View groups. Requires to update Tree View configuration. (#20)
- Add an option to display the variable name in front of the value (#30)
- Increase tests coverage (#31)
- Add auto scroll to the selected value (#32)
- Community signed release (#37)
We're Always Happy to Hear From You!
We value your feedback and are eager to connect with our community and partners. Whether you have a question, an idea, or an issue to report, here’s how you can reach out:
- Community Members: Have a question, want to suggest a new feature, or found a bug? We’d love to hear from you! Please create a GitHub issue to start the conversation.
- Enterprise Partners: Need assistance or have an urgent request? Open a Zendesk ticket for a prompt and dedicated response from our team.
- Join the Conversation: Stay updated and share your thoughts! Subscribe to our YouTube Channel and leave your comments—we can’t wait to hear what you think.
Your input helps us improve, so don’t hesitate to get in touch!