Exploring Annotations
Annotations in Grafana bring your dashboards to life by highlighting key events. They encompass three core elements:
- Native annotations
- Alerts
- Annotation queries
Curious about how they stack up? The schema below breaks it down.
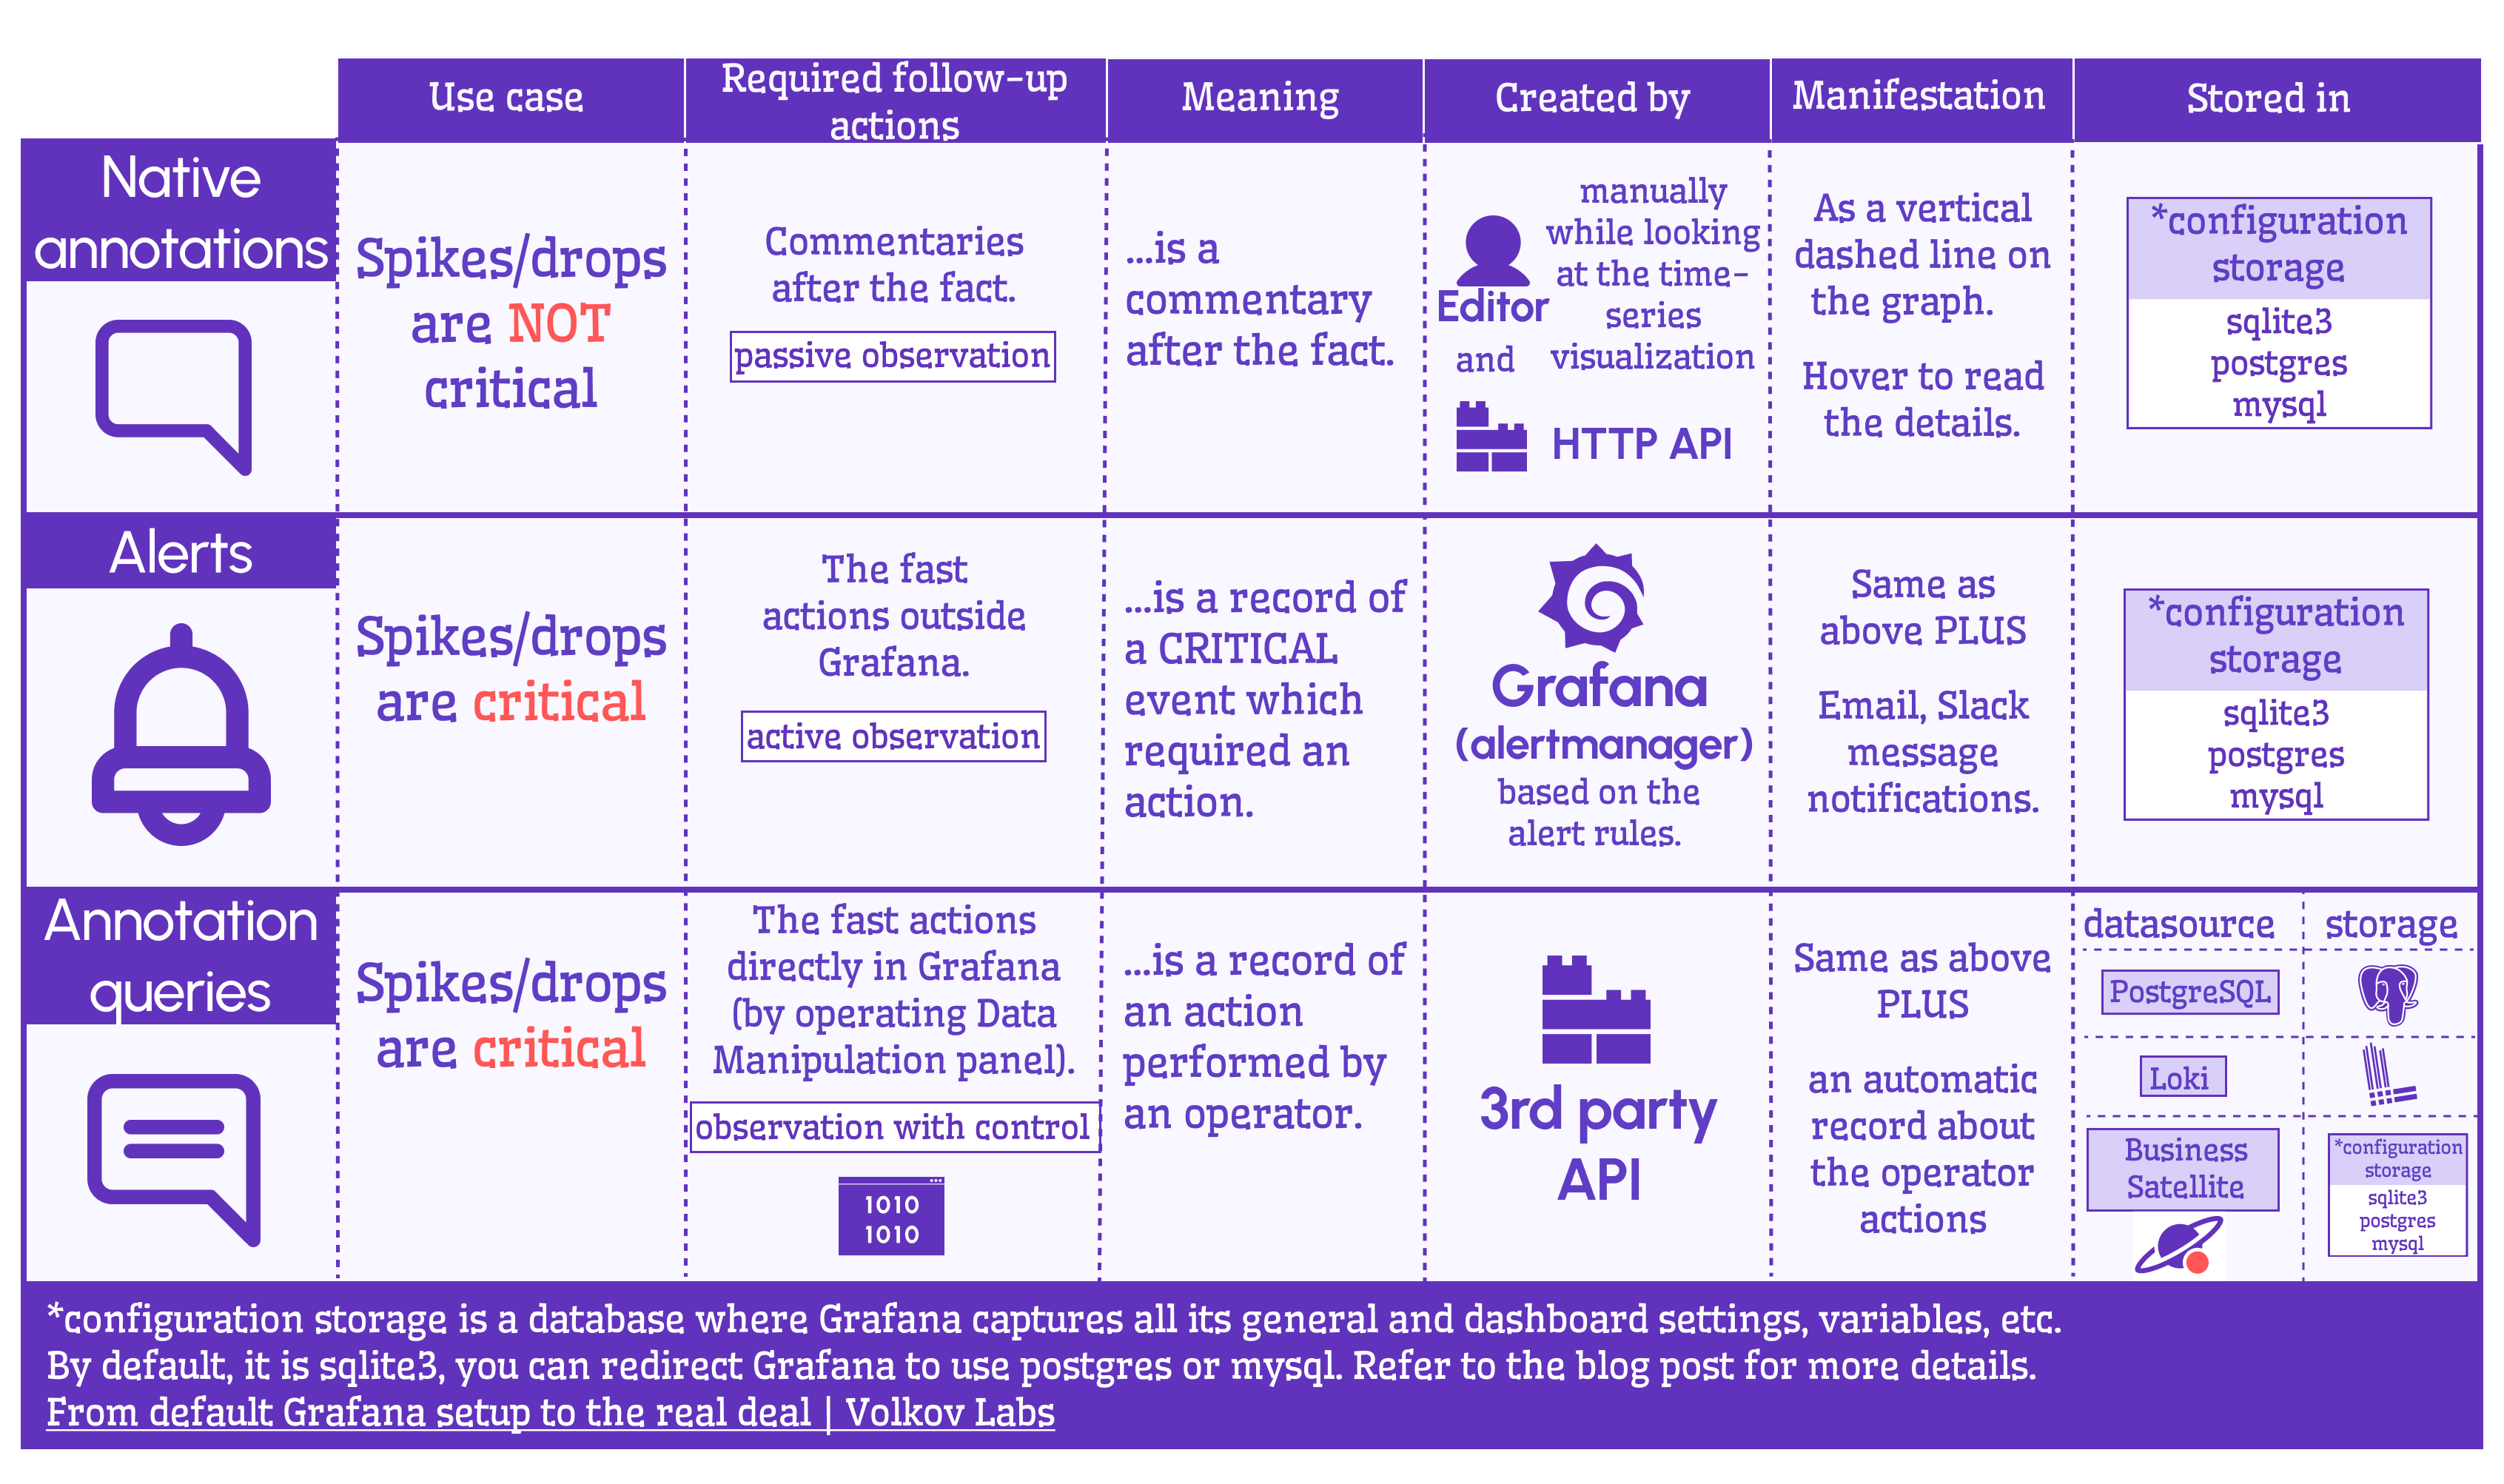
Native annotations and Alerts are stored as records in Grafana’s configuration database, while Annotation queries are custom requests to fetch and display them on your dashboard.
Understanding Annotation Queries
Annotation queries come in two flavors:
- Built-in: Basic functionality out of the box.
- User-defined: Flexible queries that can tap into any database—or even Grafana’s own storage with the Business Satellite data source.
Check out the dataflow schema below for a closer look.
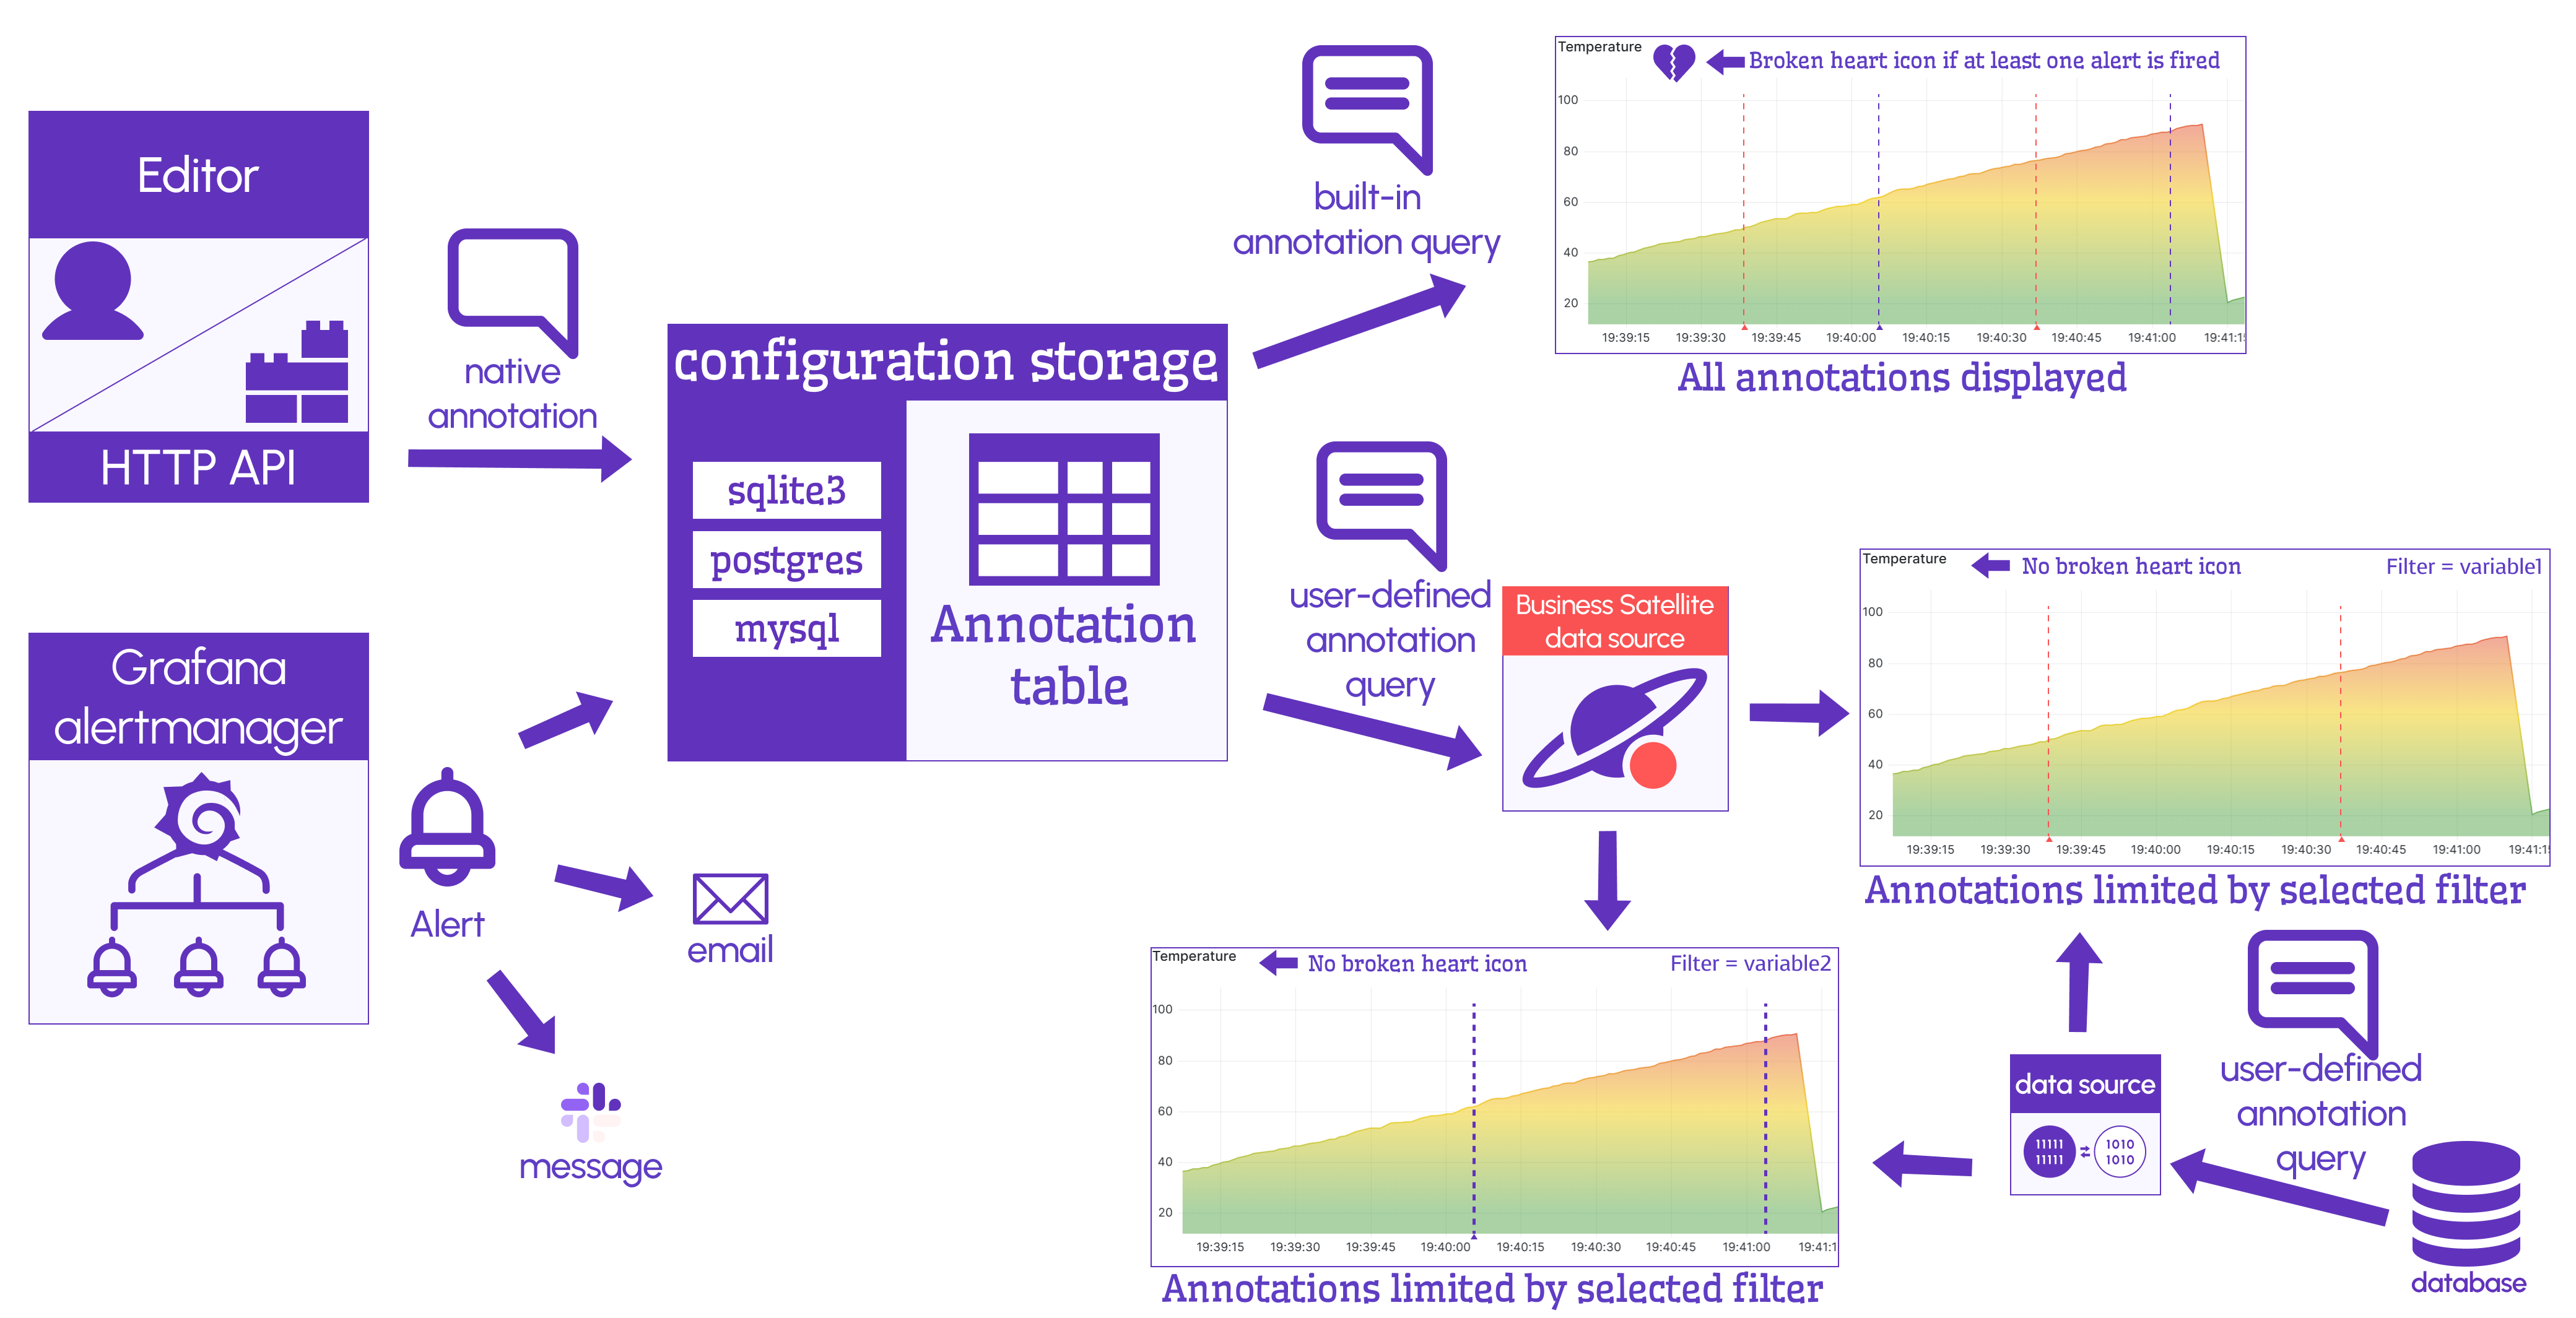
Despite their names, native annotations and Alerts share a lot under the hood. With the Business Satellite data source, you can manage both seamlessly.
Annotation Types Explained
Dive into the video below for a walkthrough of the comparative schema.
Hands-On Tutorial: Annotations and Alerts with Timescale
This is hands-down the best way to master Grafana annotations. Follow along as I guide you through the dataflow schema with step-by-step instructions—learn by doing!
Power Up with Business Satellite
We built the Business Satellite data source to tackle a real-world production challenge. It lets you pull native annotations and Alerts from local or remote Grafana instances, with flexible filtering options. See it in action in the tutorial above.
Prefer Reading? Check the Blog Post
If videos aren’t your thing, our blog post covers the same ground from a fresh perspective. Dig in!