Annotations
Annotations is an umbrella term that includes three Grafana artifacts:
- Native annotations
- Alerts
- Annotation queries
The schema below gives a comparative overview of these three.
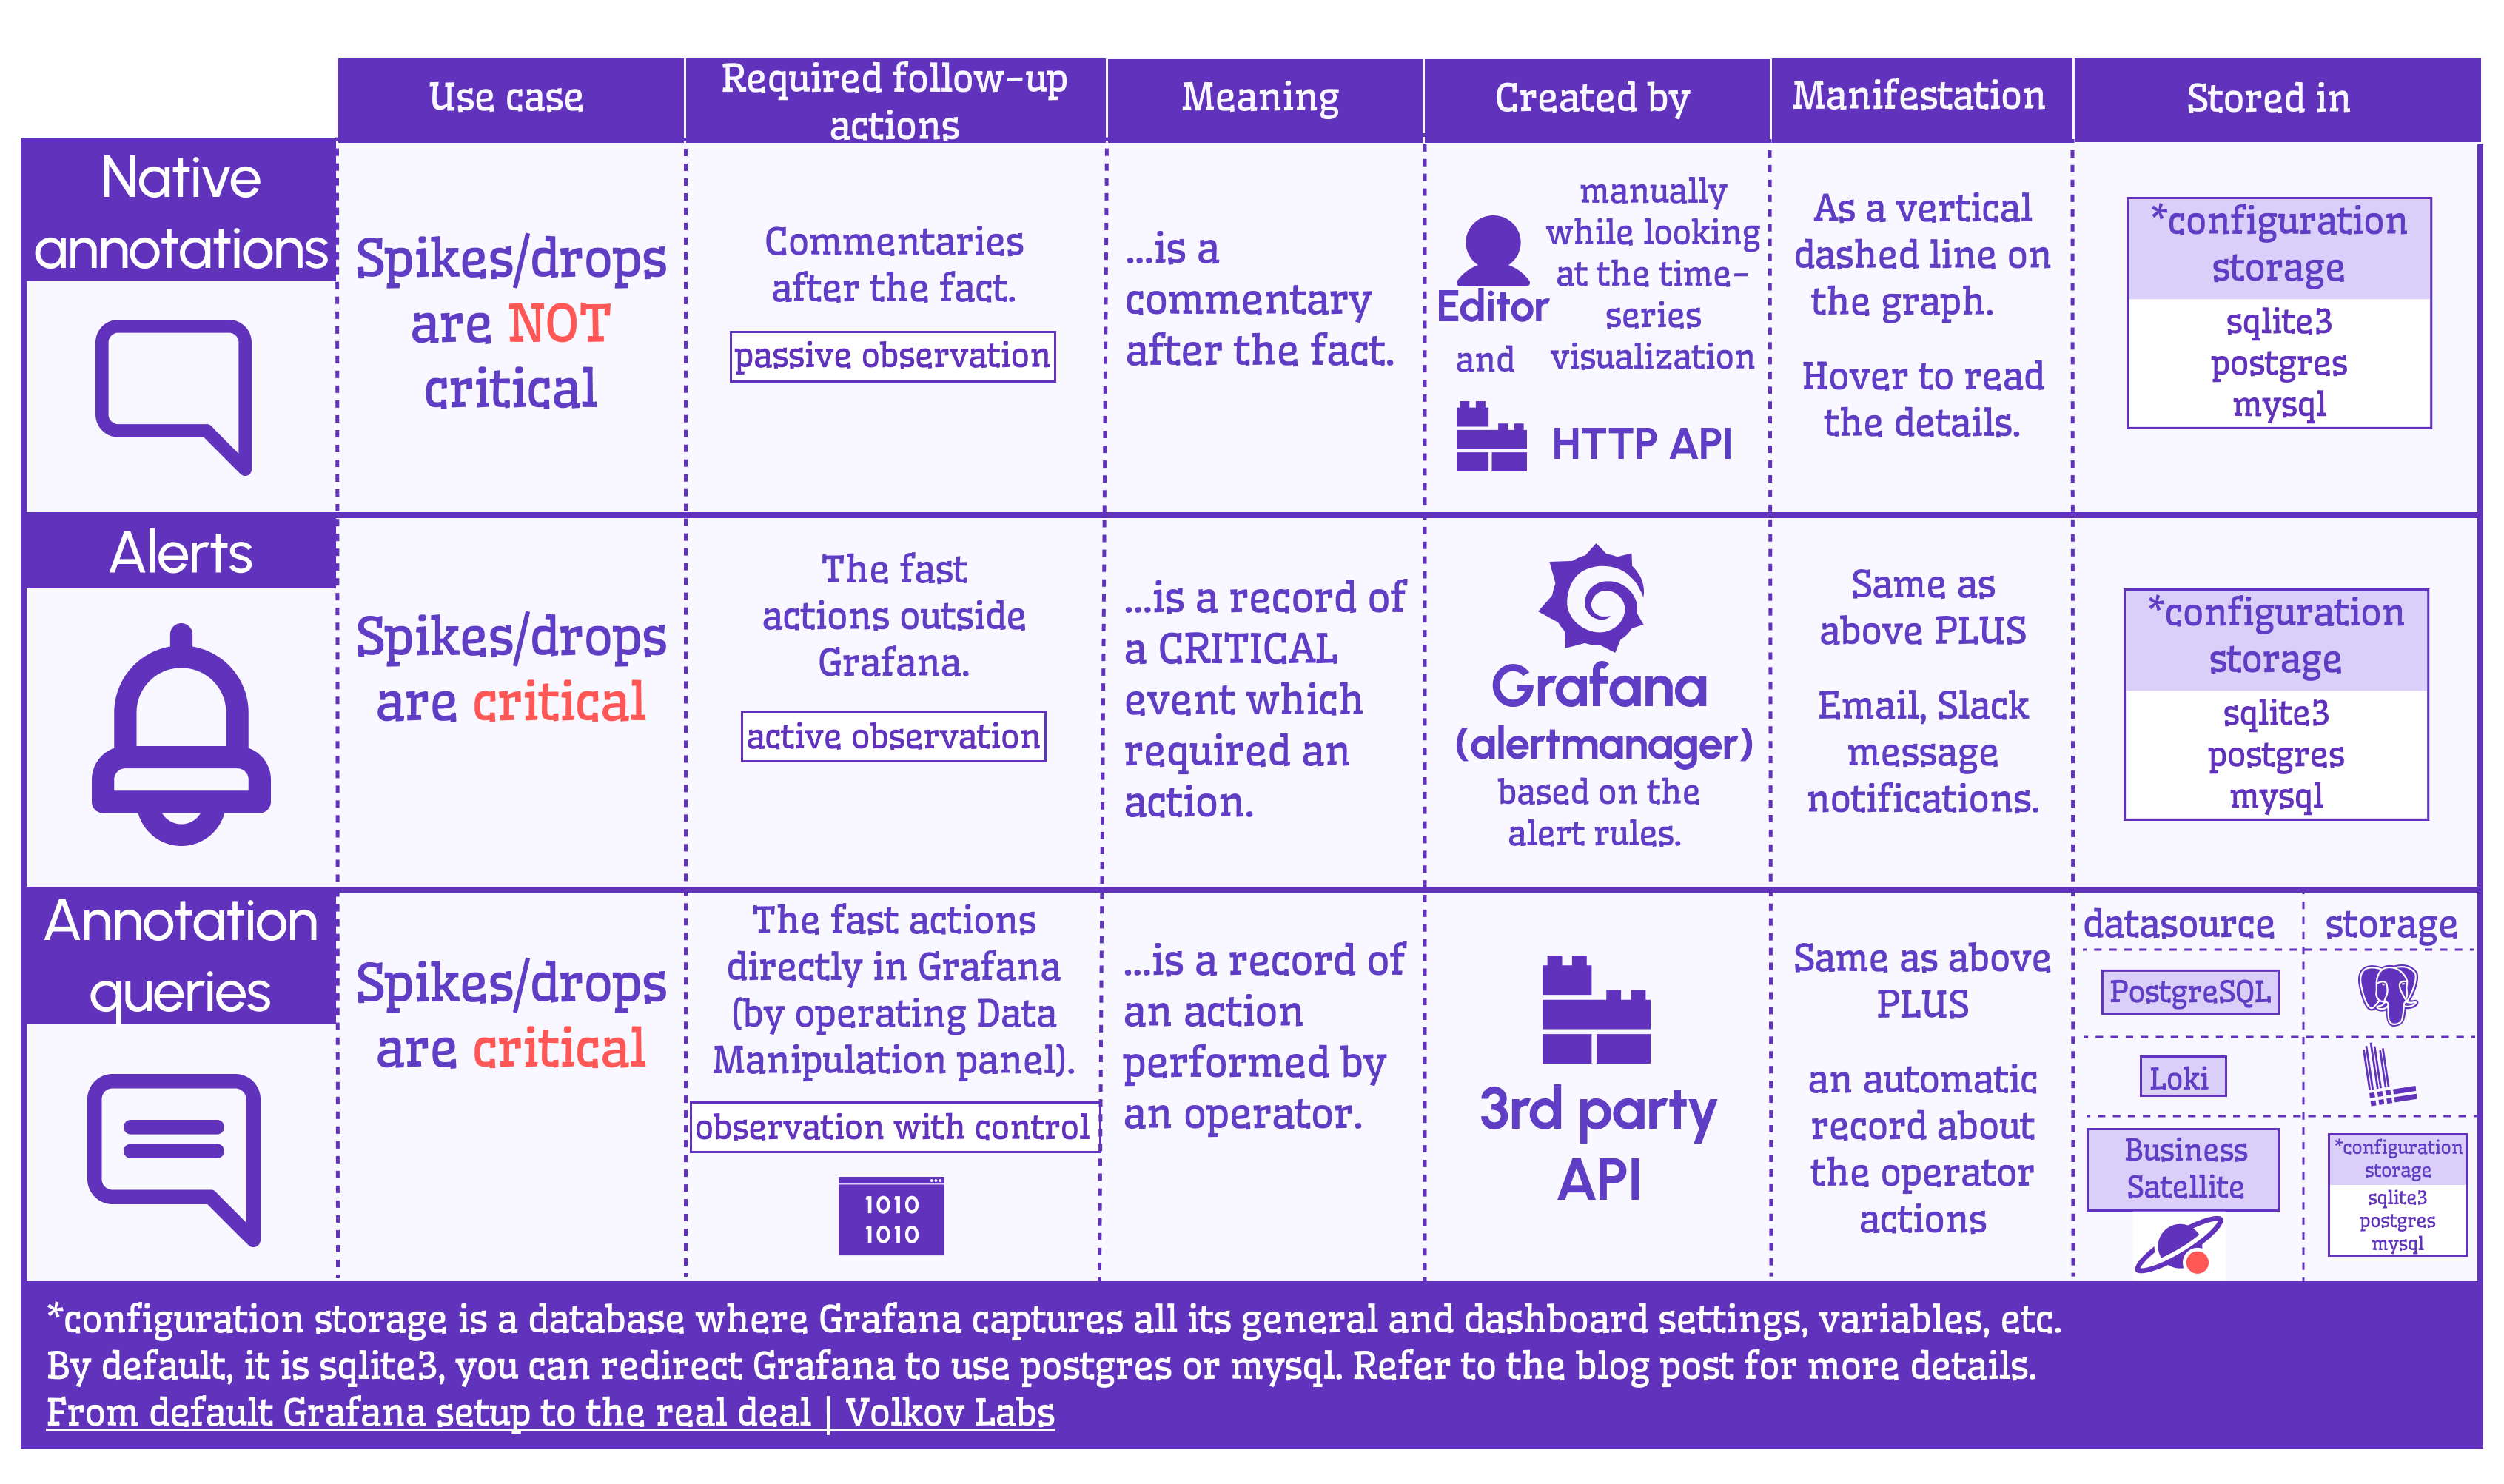
The difference between annotations queries and the other two:
- Native annotations and Alerts are records in the Grafana configuration database.
- Annotation queries are configured requests to retrieve native annotation and alerts to display them on the Grafana dashboard.
Annotation Query
The annotation queries could be further divided into two types:
- Built-in annotation queries.
- User-defined annotation queries.
Built-ins provide quite a limited functionality, while user-defined ones can work with a database of your choice or even with Grafana configuration storage. For the latter, you would need Business Satellite data source.
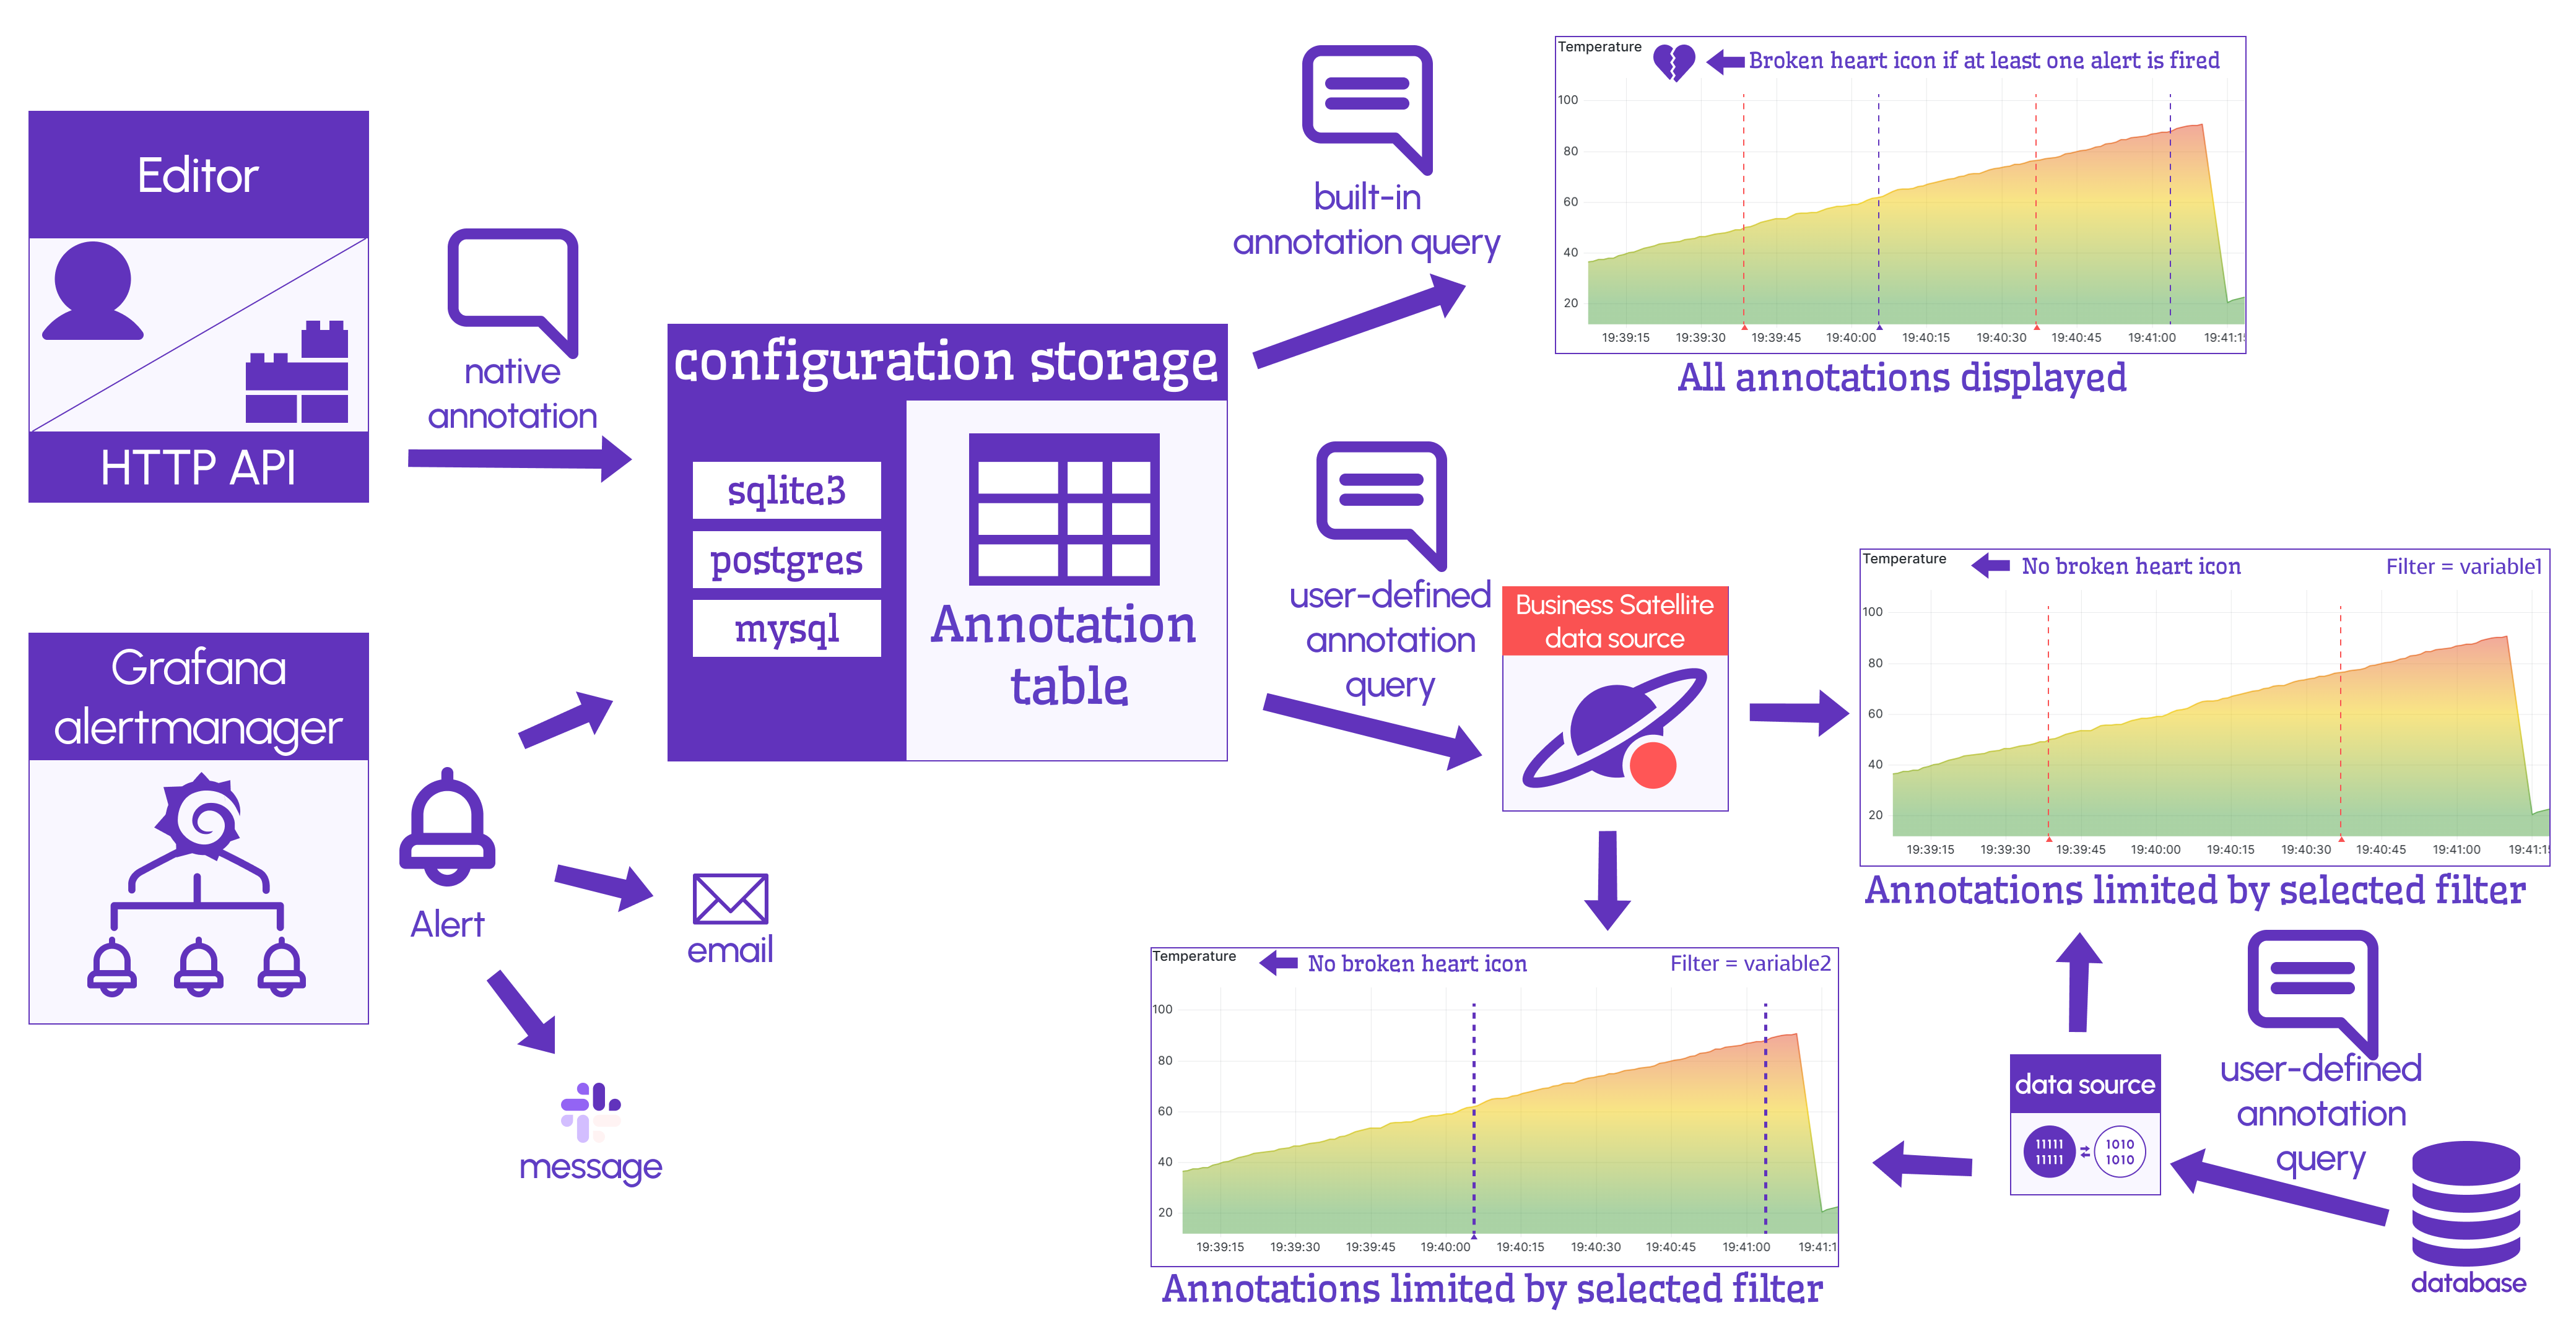
The name of native annotations might imply they are a different kind of animal than Alerts. However, under the hood, they are very similar.
With a bit of help from the Business Satellite data source, you can easily work with both simultaneously.
Annotation Types
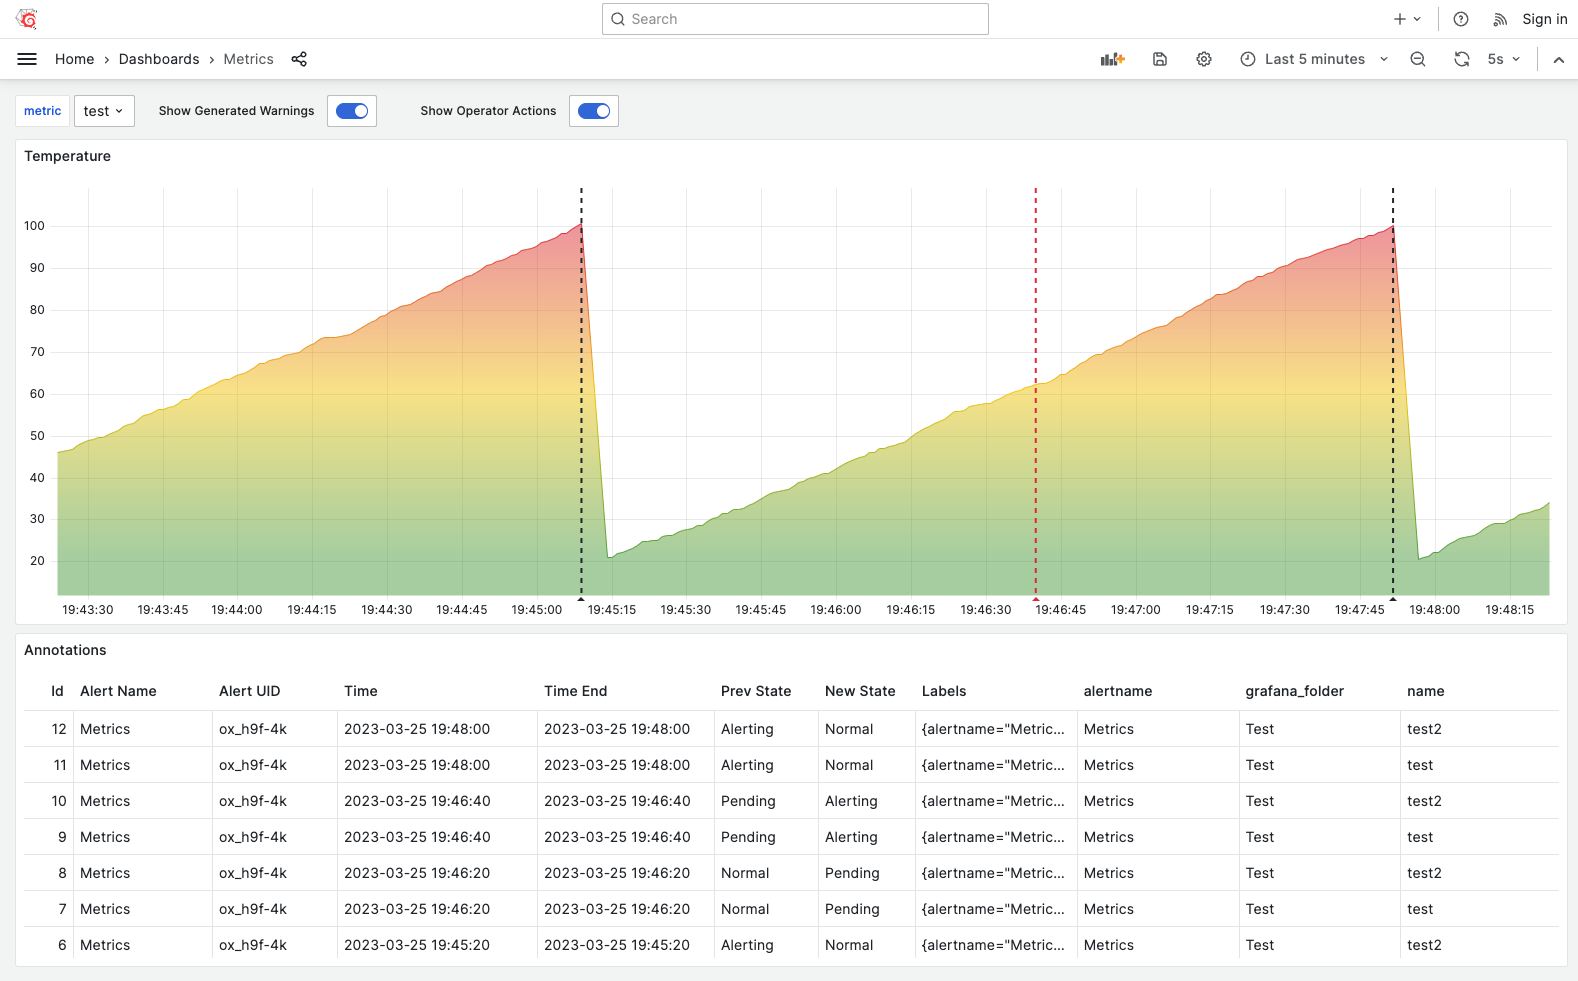
In the video below, I go over the comparative schema from above.
Annotations and Alerts tutorial with Timescale
I think this is the best tutorial about Grafana annotations. I go over the data flow schema while providing step-by-step instructions. You can follow my steps and learn as you go.
Business Satellite data source
We created this data source to solve one of the production problems. The idea is that Business Satellite data source supports retrieving annotations (native and alerts) to display them from local and remote Grafana instances. Various filters could be applied. The video above demonstrates it all.
Annotations, Alerts and Annotation Queries in Grafana
For those who prefer reading to watching videos, we prepared the blog post. It reiterates the same information from a slightly different angle.