Diving into Time Series
The Time Series panel is a cornerstone of Grafana—some even joke it’s hard to say which came first: Grafana or Time Series! Deeply woven into Grafana’s core, this panel defines much of its identity and power. Let’s explore what makes it tick.
Understanding Data Frames
In Grafana, "data frames" are the bridge between your data source and visualization panels. A data source pulls data from storage based on queries, and panels like Time Series expect it in a specific format. The image below lays out the basics.
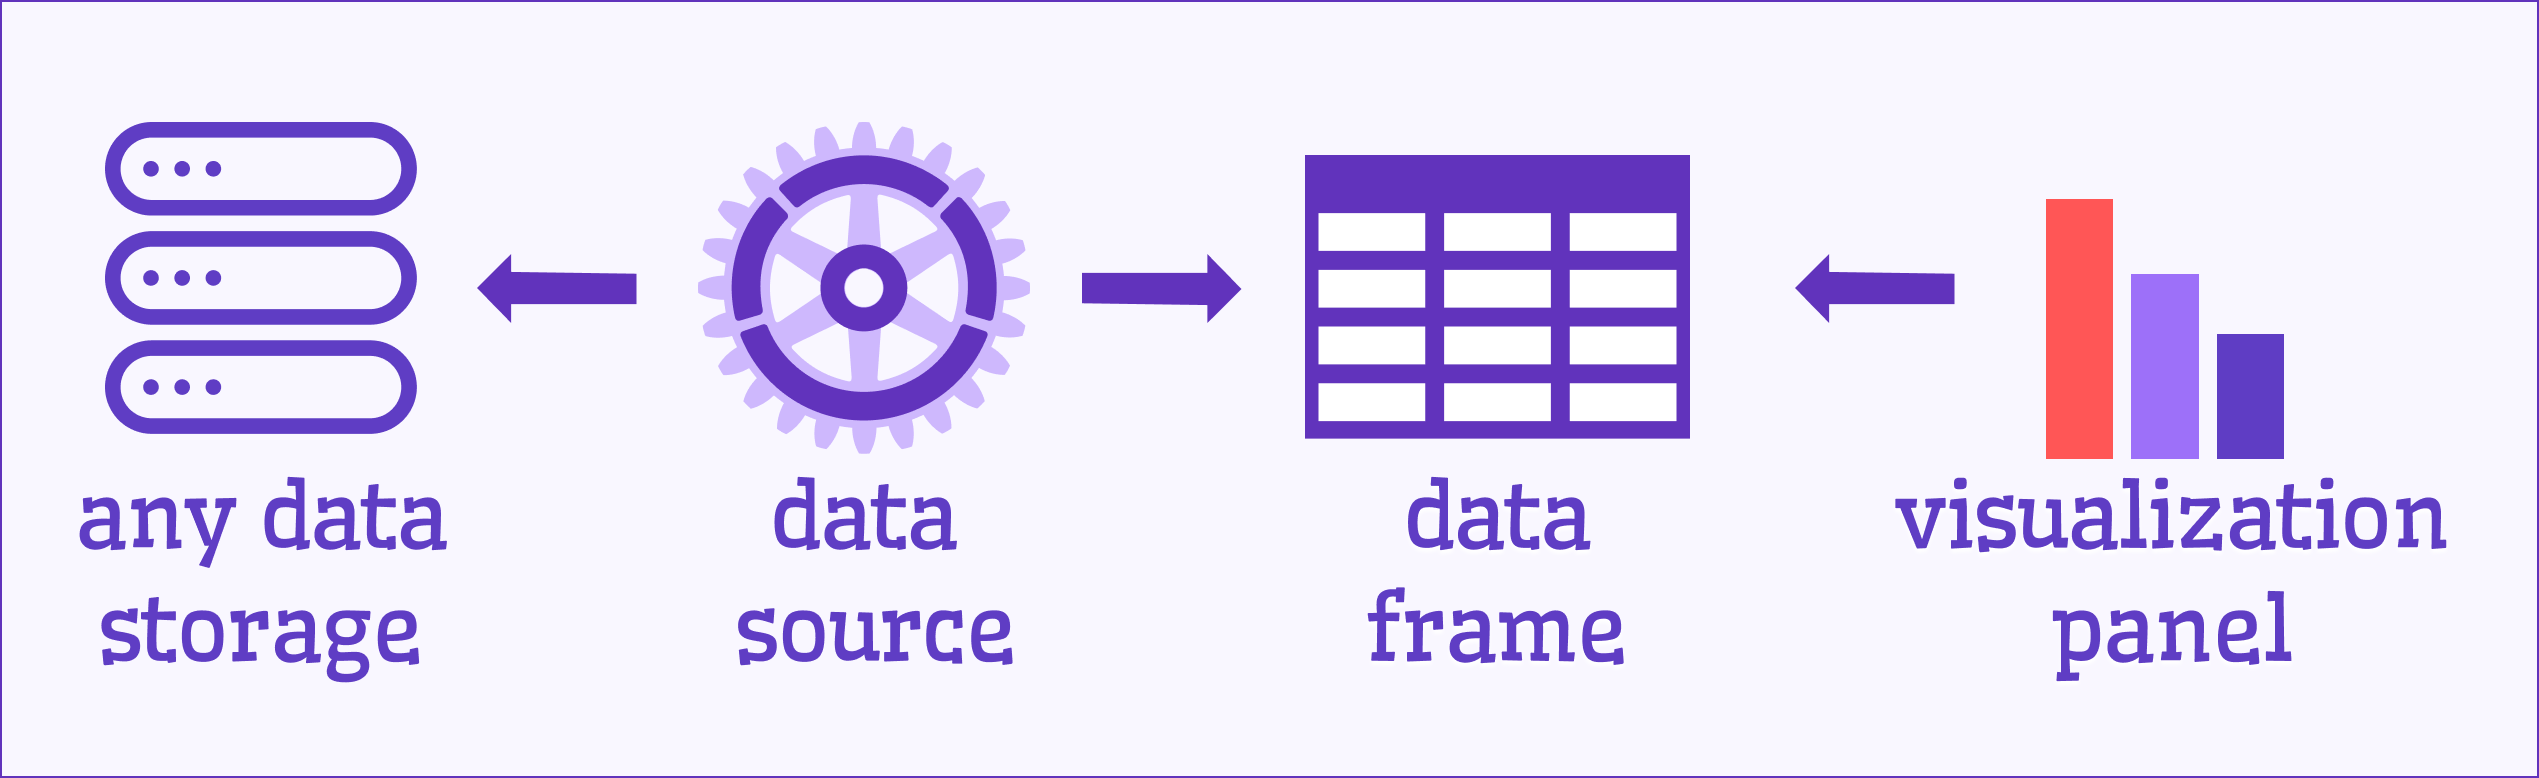
A data frame is essentially a table with typed columns, acting as the common language between retrieval and display. If your data source doesn’t deliver the right format, Grafana’s transformations (since v7.0) can step in—check out our Transformations section for more.
For Time Series to work its magic, at least one column must be in a time data format.
Here’s how Time Series likes its data frames:
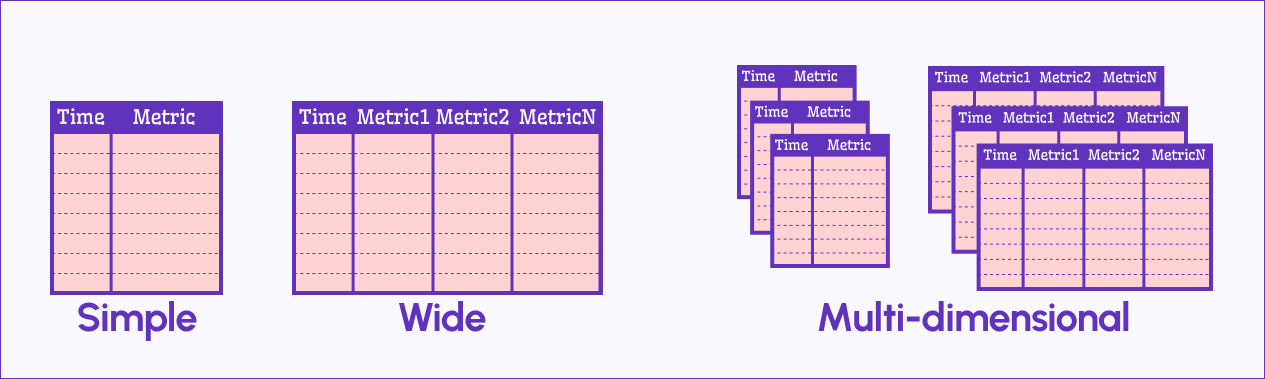
Simple Format
Two columns: one for time, one for numeric metric values. Each metric column becomes a data series on the chart.
Wide Format
Like Simple, but with multiple metric columns—each treated as its own data series.
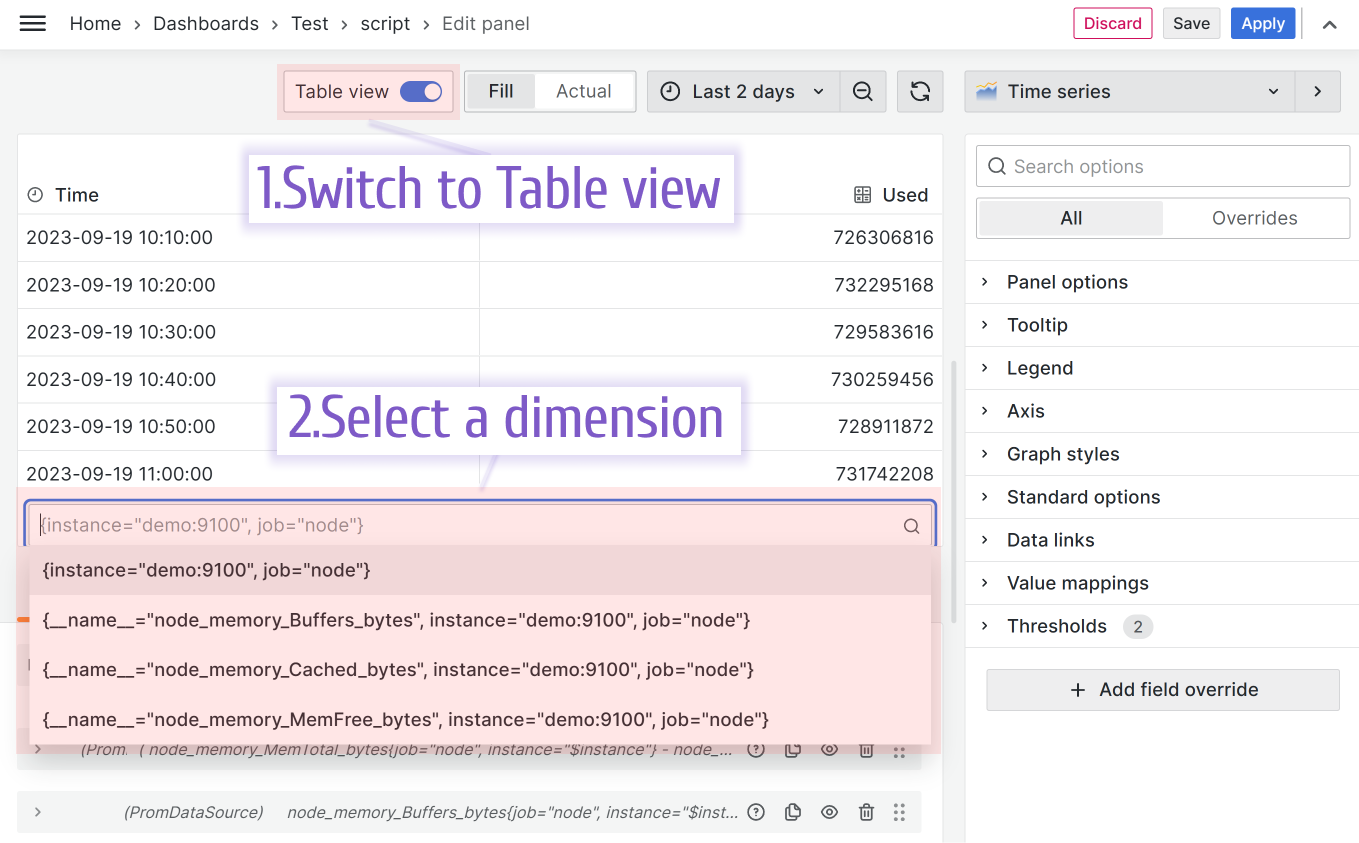
Multi-Dimensional Format
When a data source returns several Simple or Wide frames, each is a “dimension”. Switch between them using the dropdown above the query area.
Styling Your Time Series
Time Series can render lines, bars, dots—or mix them up however you like. Check out some styling examples below.
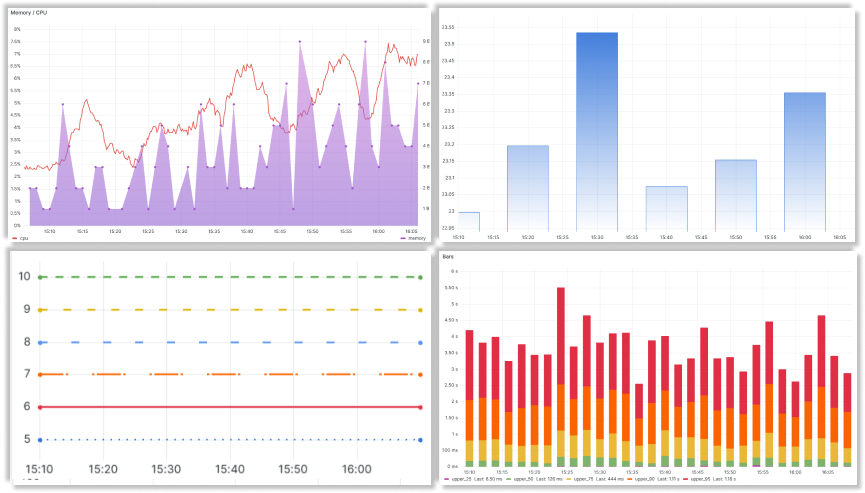
Overrides: Fine-Tune Your Series
With Wide or Multi-Dimensional data, the override feature shines. It lets you customize each data series individually—say, bars for one, a filled line for another. It’s a powerful way to highlight what matters.
Streaming Live Data
Time Series excels at showing live, streaming data—perfect for real-time insights. Your data source needs to support streaming, though. For examples, peek at our Business Charts plugin docs—they’re not Time Series-specific, but they’re the closest we’ve got for now!
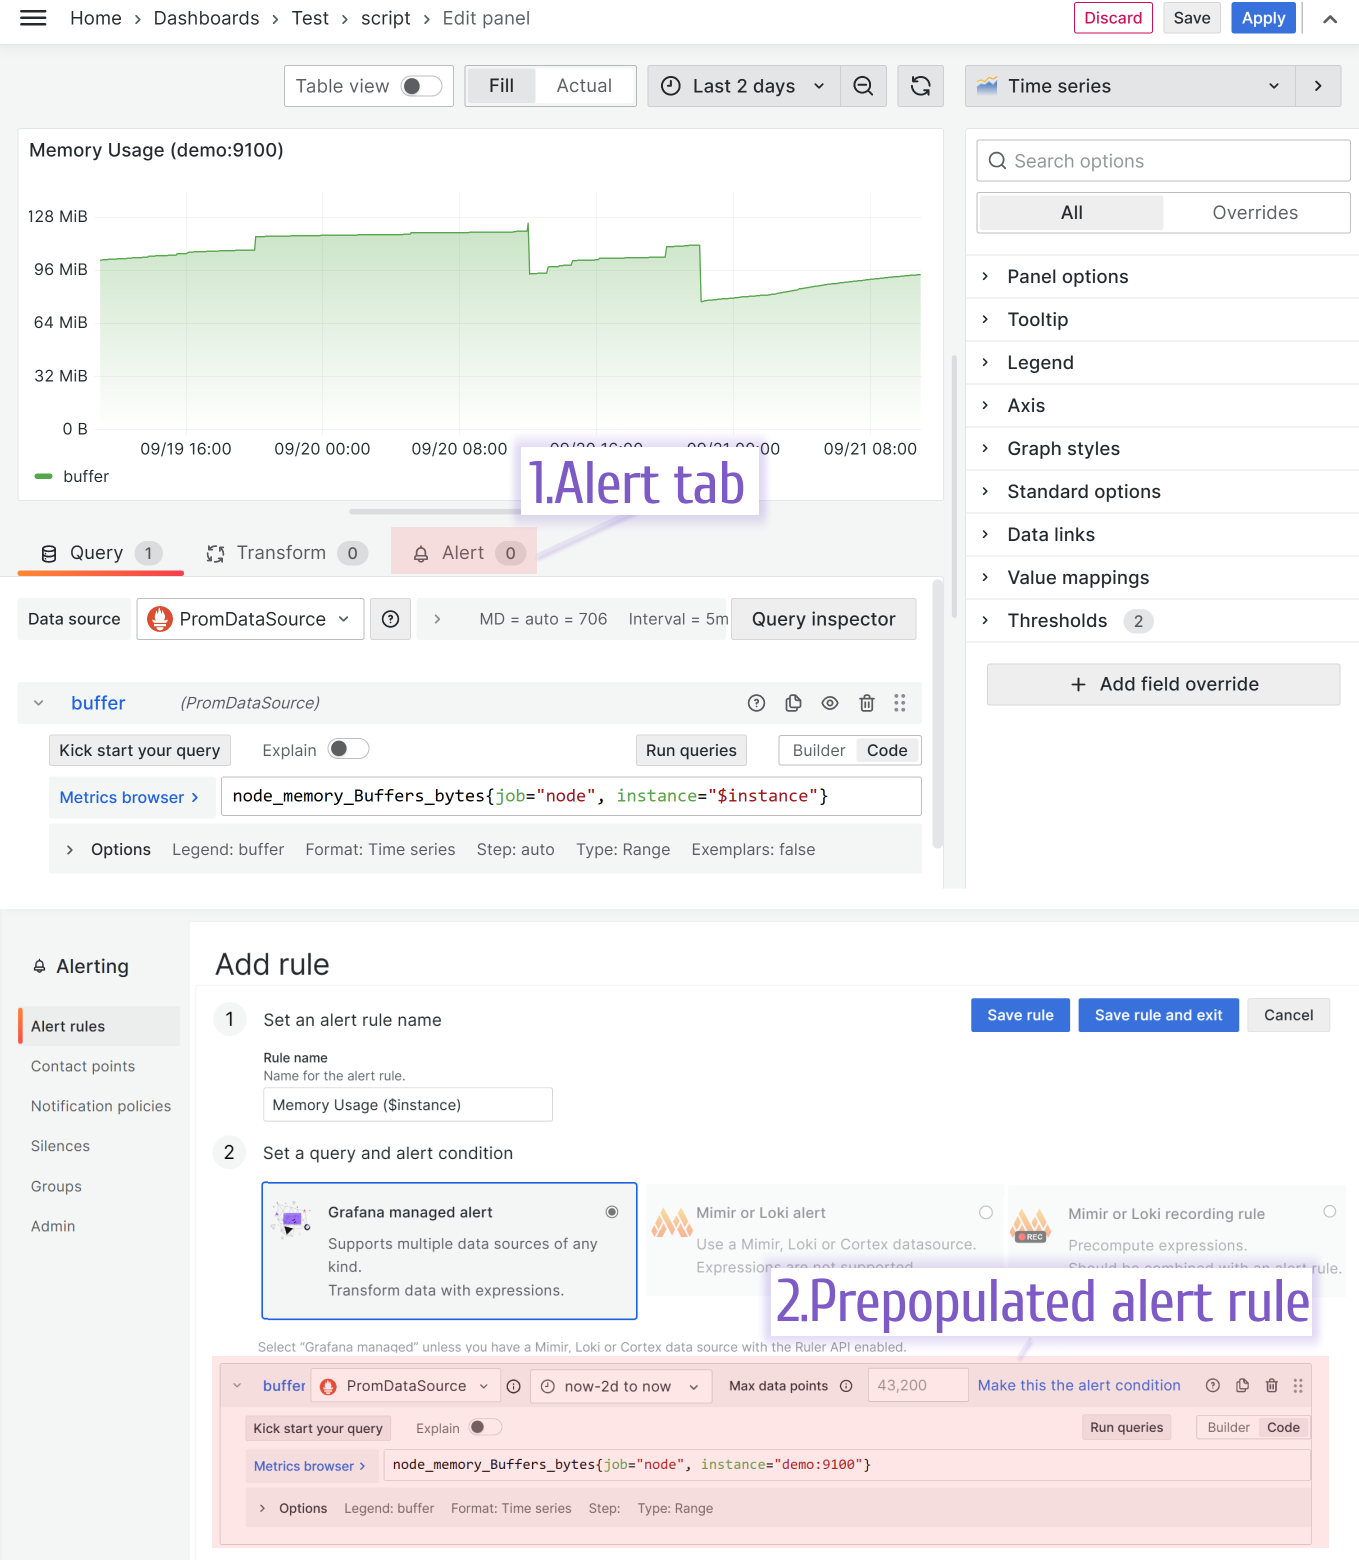
Annotations and Alerts
Time Series natively supports annotations and alerts. In edit mode, hit the Alerts tab to craft an alert rule—your queries auto-populate, saving you time.
Want more on this? Head to our Annotations section.
Video Walkthrough: Time Series Basics
Prefer seeing it in action? This video walks through Time Series with demos and step-by-step guidance—perfect for visual learners.
Monitor Linux Servers with Time Series
Need a quick win? Join me in this short tutorial to build a monitoring dashboard for Linux servers using Prometheus, Node Exporter, and Time Series—no manual slog required!
This page and the videos pair perfectly—some concepts shine on screen, others in text. For more, check out the blog below.