Website Analytics with Grafana
Over a weekend, we embarked on an exciting challenge to monitor and visualize key metrics for our website's content. The goal was to gain insights into user behavior, such as who is visiting our site, what content (blogs or documentation) they are most interested in, and where they are coming from geographically or through referral sources. The outcome of this project was a sleek, interactive Grafana dashboard that provides a comprehensive view of these metrics, powered by a robust data pipeline consisting of Nginx, Loki, and Promtail.
In this section, we'll walk you through the motivation behind this project, the tools we used, and a high-level overview of how we set up the analytics pipeline to track and visualize website traffic and content performance.

Why Website Analytics?
Understanding how users interact with our website is crucial for improving content, optimizing user experience, and identifying trends. Traditional analytics tools like Google Analytics provide great insights, but we wanted a custom, self-hosted solution that integrates seamlessly with our existing infrastructure and gives us full control over data privacy and visualization.
By leveraging open-source tools like Grafana, Loki, and Promtail, we were able to build a tailored analytics system that meets our specific needs.
Tools and Technologies Used
- Nginx: Acts as our web server and reverse proxy, handling incoming HTTP requests and logging detailed access information for each visitor.
- Loki: A log aggregation system by Grafana Labs, designed to store and query logs efficiently. We use Loki to centralize and process the logs generated by Nginx.
- Promtail: A lightweight agent that tails log files and sends them to Loki. It helps in collecting and forwarding Nginx access logs to Loki for further processing.
- Grafana: A powerful open-source platform for monitoring and observability. We use Grafana to create dynamic dashboards that visualize the website metrics extracted from Loki.
How We Built the Pipeline
- Nginx Configuration: We started by configuring Nginx to log detailed access information, including IP addresses, request URLs, user agents, referrers, and timestamps. These logs are written to a file in a structured format (e.g., JSON) for easier parsing.
- Log Collection with Promtail: Promtail was set up on the server to tail the Nginx access logs. It processes the logs, adds labels (e.g., for request type or source), and forwards them to Loki for storage.
- Log Storage in Loki: Loki aggregates and indexes the logs sent by Promtail, making them queryable via its powerful LogQL query language. This allows us to filter and analyze logs based on specific criteria, such as traffic by region or popular content.
- Visualization in Grafana: Finally, we connected Grafana to Loki as a data source. Using Grafana’s intuitive interface, we built a custom dashboard with panels displaying key metrics like total requests, unique visitors, top pages, geographic distribution, and traffic sources.
Dashboard Overview
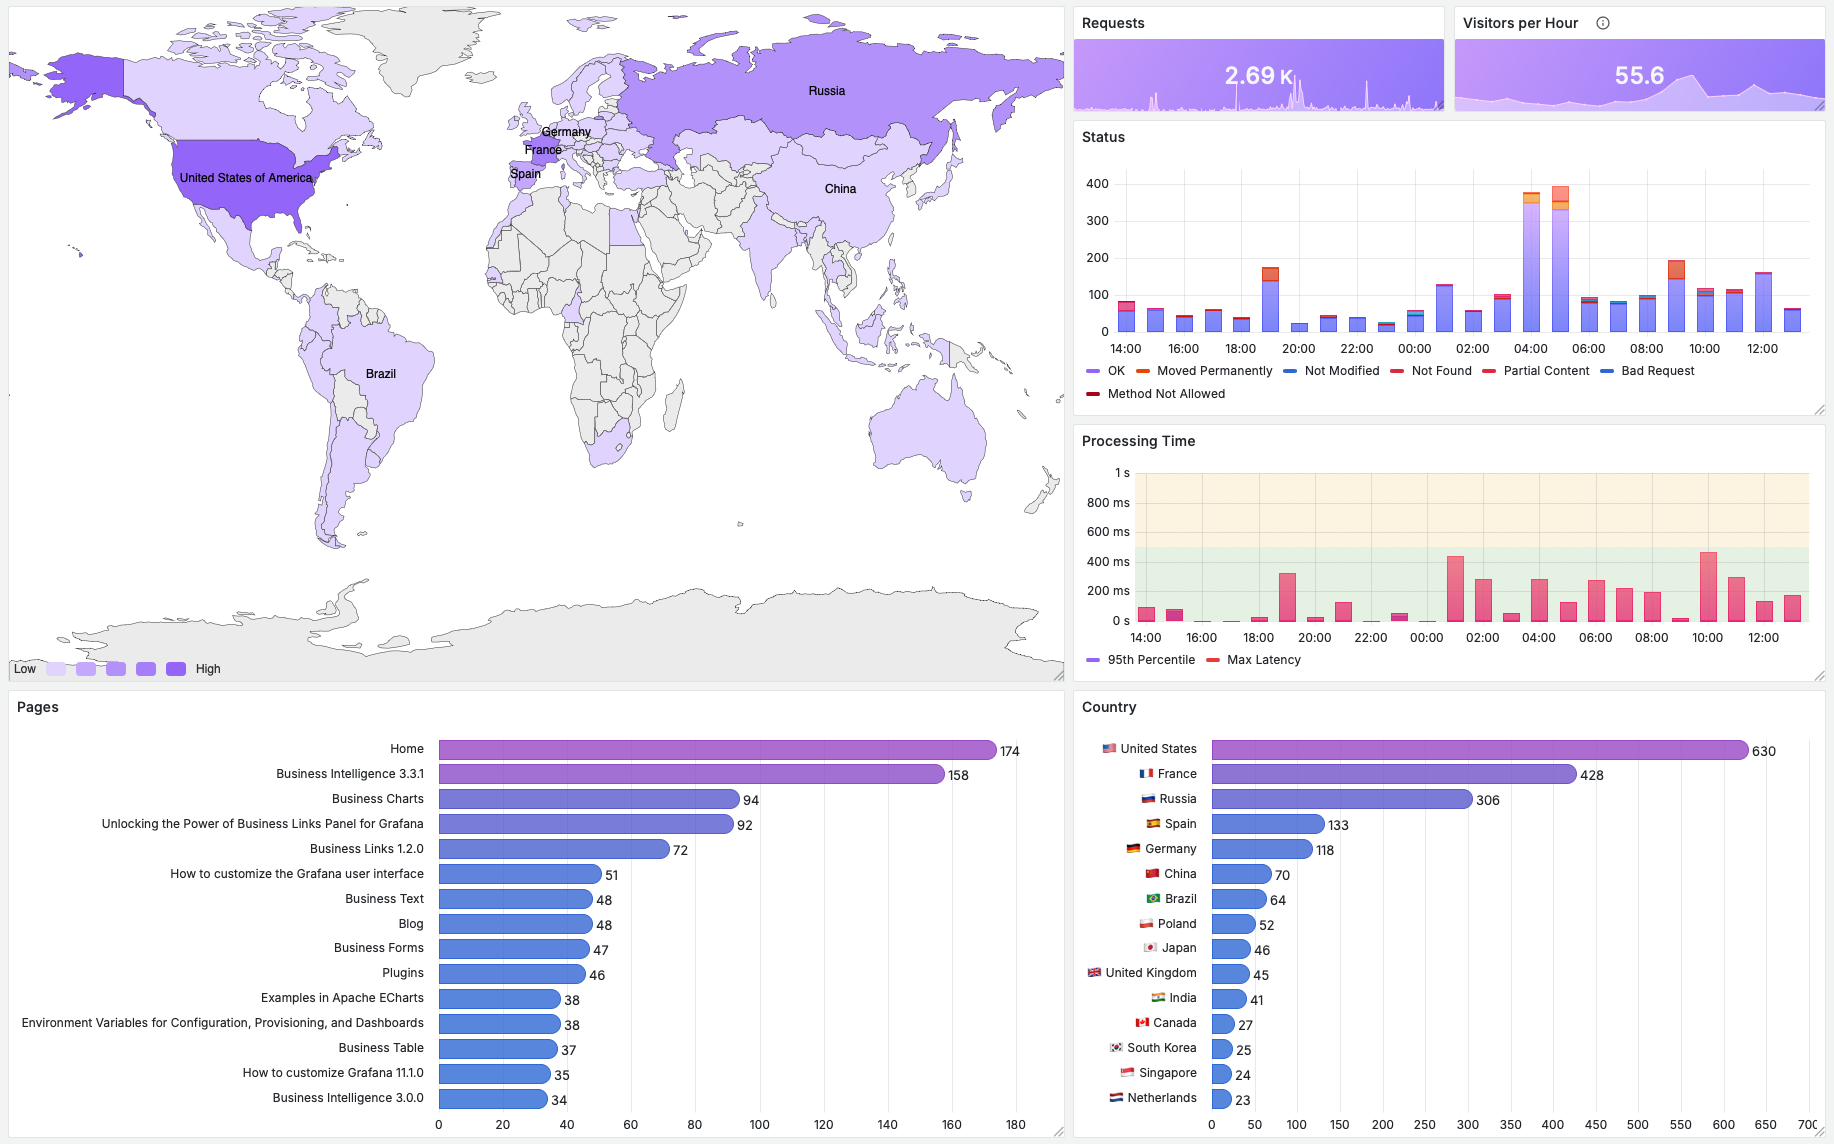
The resulting Grafana dashboard provides a real-time view of our website’s performance. Some of the key visualizations include:
- A time-series graph showing the number of requests over time.
- A heatmap of visitor locations based on IP geolocation data.
- A bar chart of the most visited pages or blog posts.
- A pie chart breaking down traffic sources (direct, referral, search engines, etc.).
Below is a snapshot of the dashboard showcasing the content metrics for website requests:
Challenges and Learnings
While setting up this pipeline, we encountered a few challenges, such as ensuring accurate log parsing and handling high log volumes without performance bottlenecks. We learned the importance of fine-tuning Promtail’s configuration and using Loki’s distributed mode for scalability.
Additionally, integrating IP geolocation data required an external service or database to map IPs to locations, which added an extra layer of complexity.