Exploring Variables
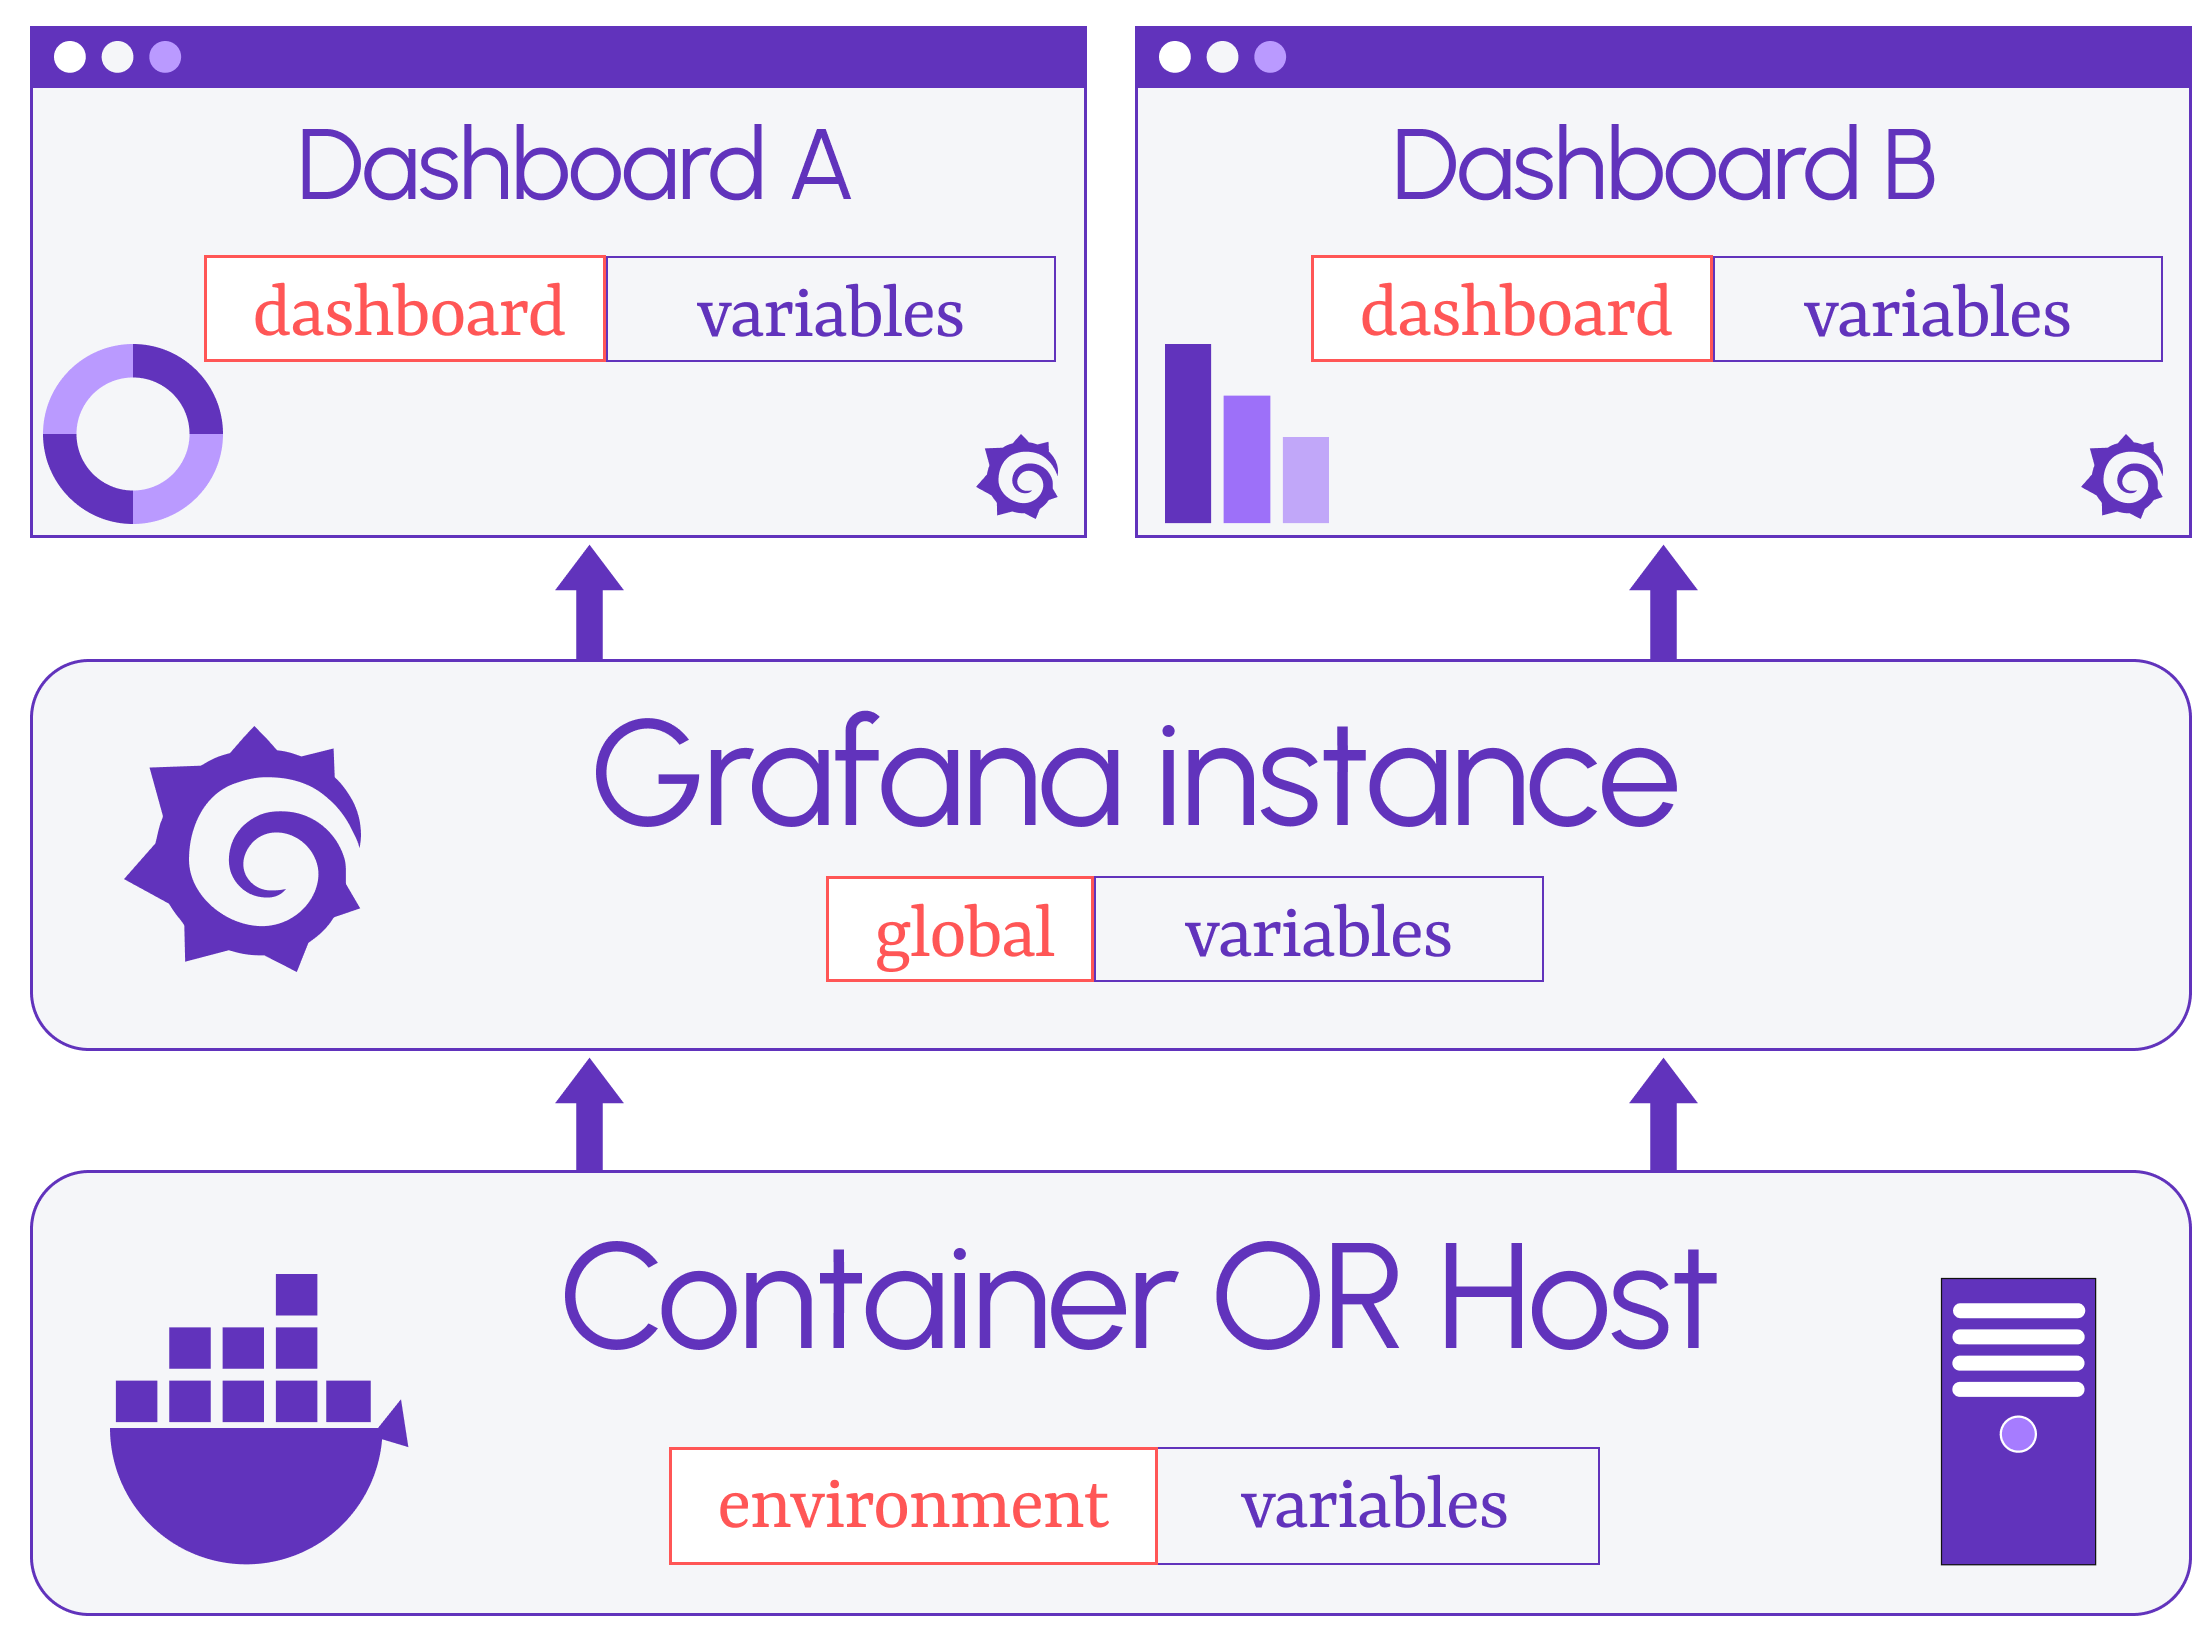
Variables in Grafana can spark a lot of questions—especially for newcomers. Simply put, they come in three flavors: Dashboard, Global, and Environment. Let’s break them down and see how they fit into Grafana’s world.
Your Video Guide to Variables
Want to fast-track your understanding? This video sorts out Dashboard, Global, and Environment variables with a clear, step-by-step rundown—perfect for Grafana fans eager to learn.
Dashboard Variables
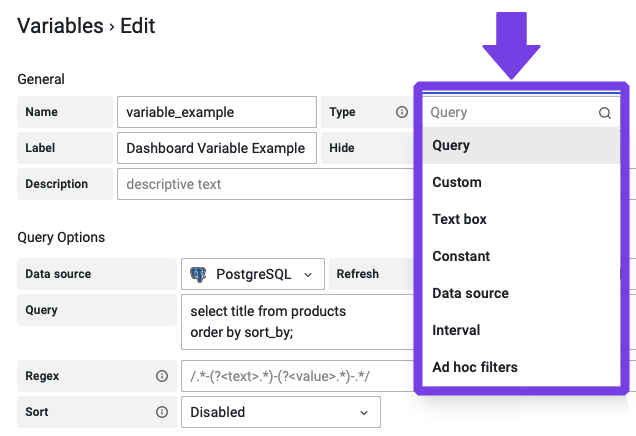
Dashboard variables live within a single dashboard, powering filters and dynamic controls. They’re your go-to for tailoring what users see.
Global Variables
Global variables tap into Grafana-wide settings, ready to use across your dashboards. Here’s a quick look at some handy ones:
| Variable | Description |
|---|---|
${__dashboard} | Name of the current dashboard |
${__from} | Start of the time range (epoch ms) |
${__interval} | Time grouping parameter |
${__org.name} | Name of the current organization |
${__org} | ID of the current organization |
${__to} | End of the time range (epoch ms) |
${__user.email} | Email of the current user |
${__user.id} | ID of the current user |
${__user.login} | Login handle of the current user |
For the full lineup, check out Grafana’s global variables docs.
Environment Variables
Environment variables pull from the system where Grafana runs—think operating system or device settings. Normally out of reach, they’re unlocked with the Environment data source. Learn how in this post.

Variables at a Glance
Need more examples? This blog post dives deeper into all three variable types and spotlights the Environment data source—your cheat sheet to mastering variables.