Unleashing Creativity with the Canvas Panel
The Canvas panel in Grafana isn’t fully polished yet, but it’s more than ready for prime time. A stunning demo—think house energy metrics paired with animated wind turbines—left us itching to dive in and build something ourselves.
Grafana’s a rockstar for Kubernetes observability, log monitoring, and tracing, no doubt. But at Volkov Labs, we love pushing its boundaries. Time and again, we’ve found it shines in unexpected places.
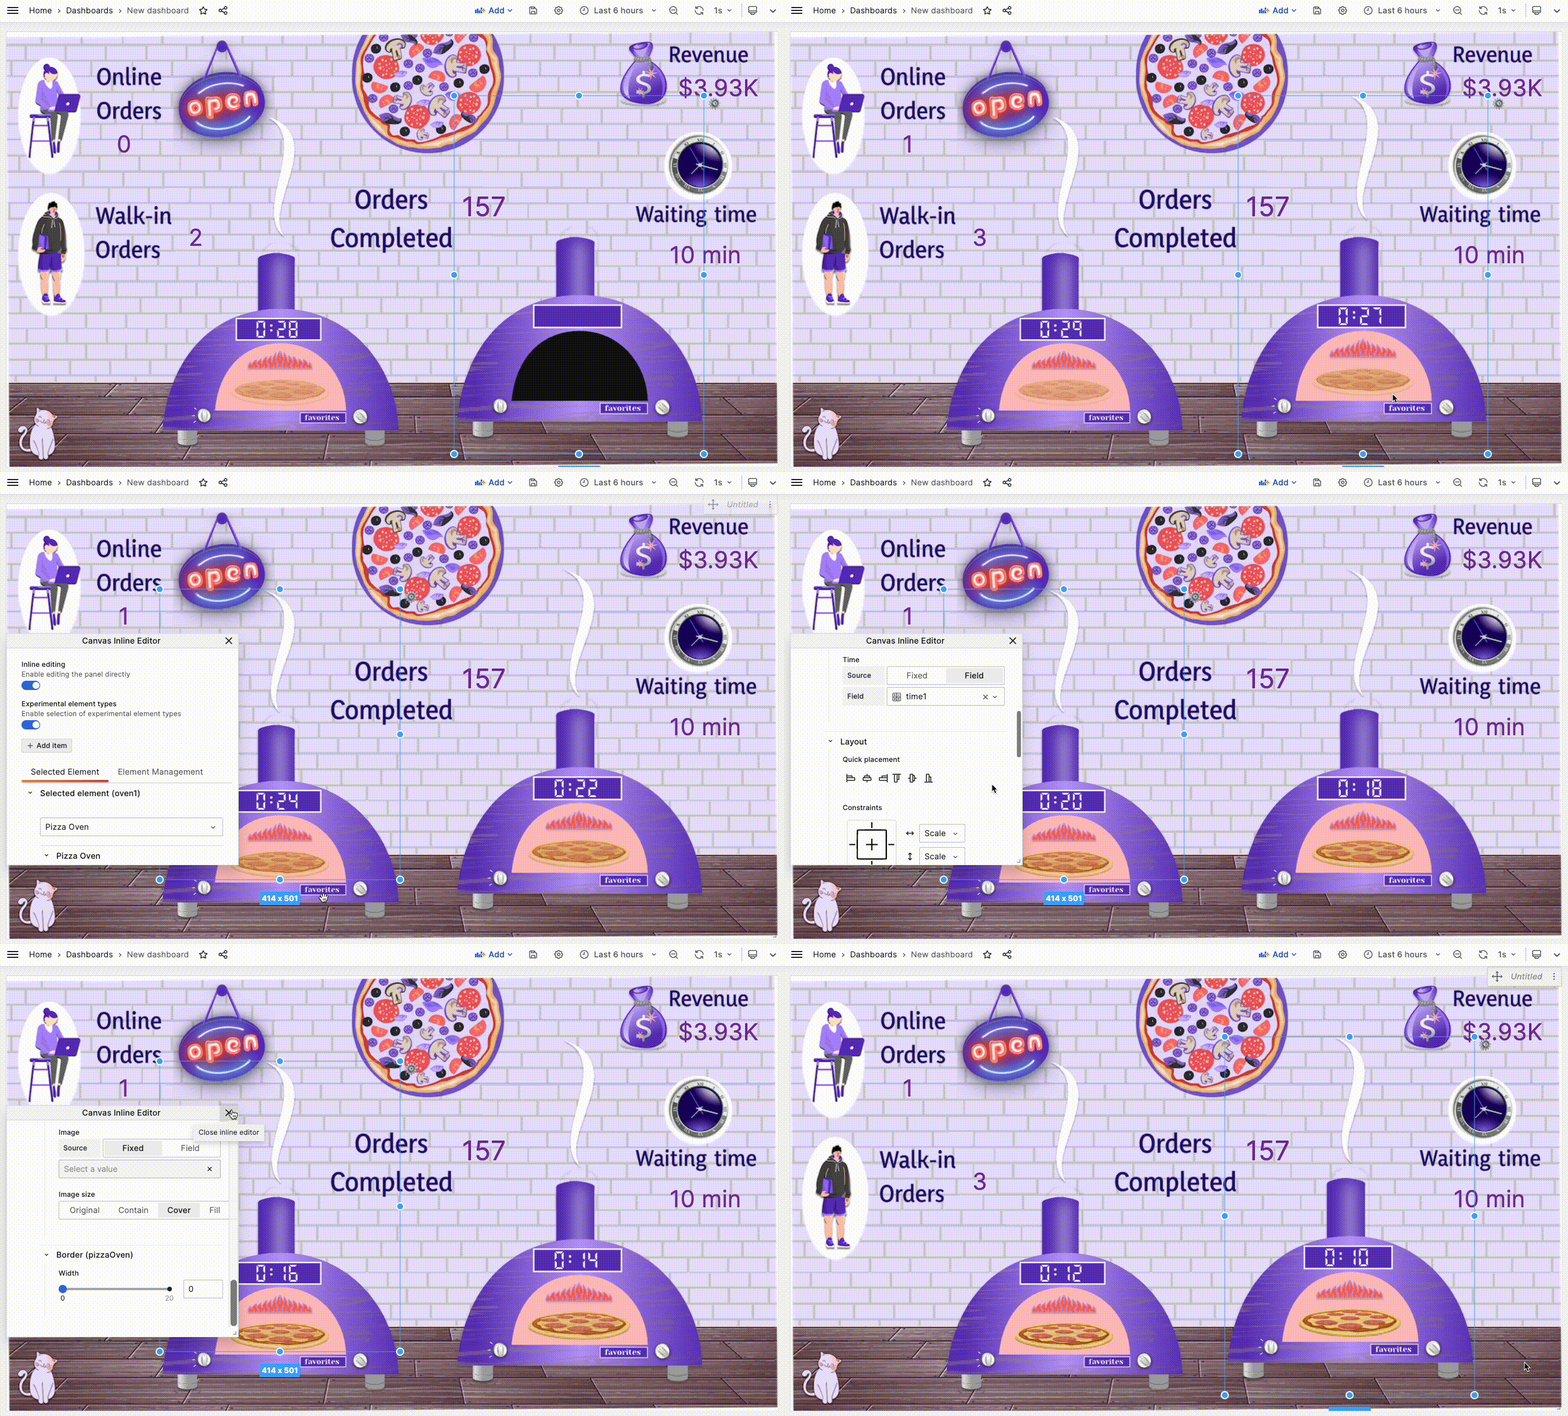
This time, our pizza obsession collided with the Canvas panel’s core release, inspiring us to whip up a pizzeria observability dashboard. Curious how it turned out? Check it out!

The canvas panel is awesome
The canvas panel can be used for a variety of use cases, pizzeria included.
