Grafana Events (EventBus)
Grafana leverages an EventBus to broadcast application events, enabling different parts of the system to respond when a user interacts with the interface. This mechanism facilitates real-time communication across components.
Here’s a simple example of subscribing to an event:
const subscription = eventBus.subscribe({ type: "data-hover" }, () => {
  console.log("Data hovered");
});

return () => {
  subscription.unsubscribe();
};
Predefined Events
The EventBus supports a variety of predefined events. Below is a list of key events and their purposes:
| Event | Description |
|---|---|
| absolute-time | Triggered when a user selects an absolute time range on the dashboard |
| annotation-event | Fired when an annotation is created, updated, or deleted |
| annotation-query-finished | Occurs after an annotation query completes |
| annotation-query-started | Occurs when an annotation query begins |
| copy-panel | Initiated to copy a panel’s JSON to local storage |
| dashboard-loaded | Fired when a dashboard finishes loading |
| dashboard-saved | Triggered after a dashboard is saved |
| data-hover | Occurs when hovering over a legend or data point with shared crosshair enabled |
| data-hover-clear | Fired when the user stops hovering over a data point with shared crosshair enabled |
| data-select | Triggered when a user selects a data point on a panel |
| datasource-updated-successfully | Fired when a datasource update succeeds |
| panel-edit-finished | Occurs when a user finishes editing a panel |
| panel-edit-started | Triggered when a user begins editing a panel |
| refresh | Fired when a dashboard is refreshed |
| render | Occurs when a dashboard is rendered |
| shift-time | Triggered when the dashboard’s time range shifts |
| theme-changed | Fired when the theme settings are modified |
| time-range-updated | Occurs when the time range is updated |
| variables-changed | Triggered when dashboard variable values change |
| variables-changed-in-url | Fired when variable values in the URL are updated |
| variables-time-range-process-done | Occurs when the time range processing for variables completes |
| zoom-out | Triggered when the user zooms out the time range |
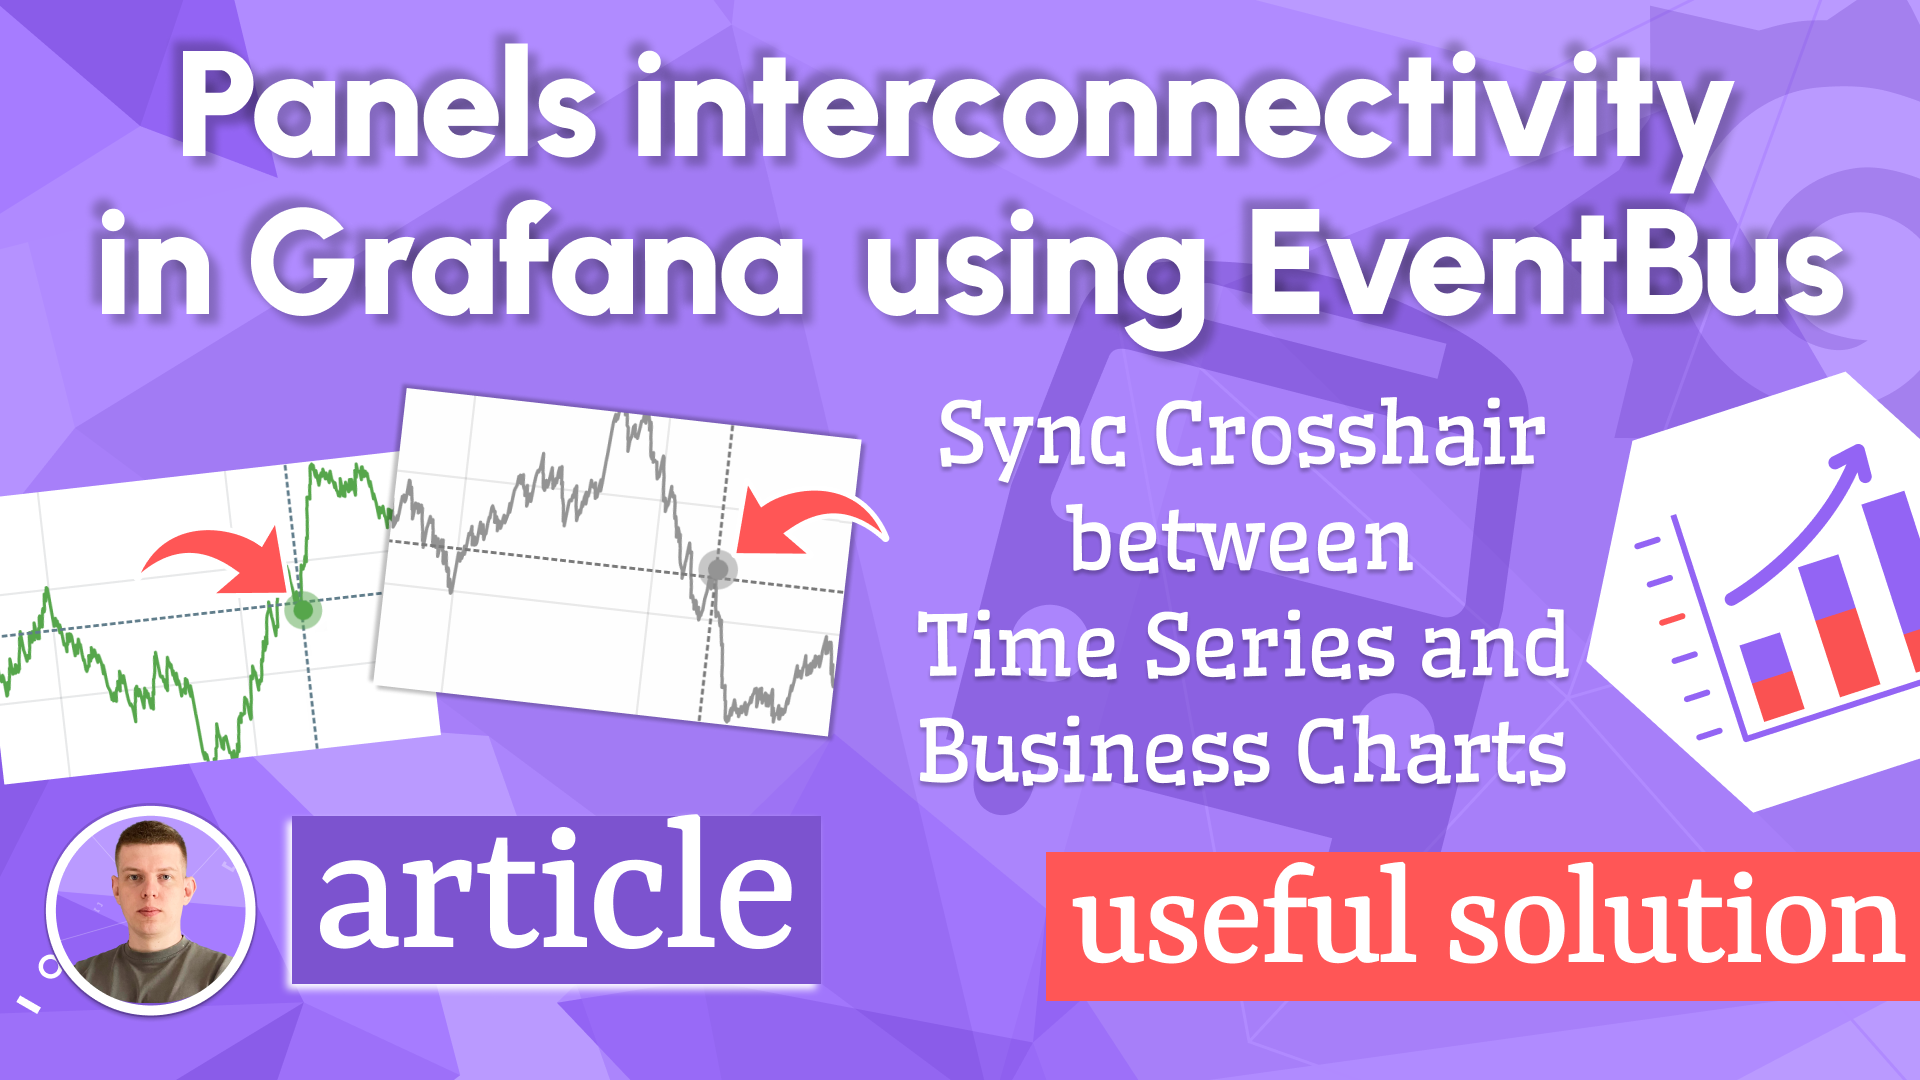
Panel Interconnectivity via EventBus
You can harness the EventBus to enable communication between panels in Grafana. For a practical example, the article below explores how to use Business Charts, Grafana Events, and Extended Result to send and receive events, enhancing panel interactivity.
Conclusion
The Grafana EventBus is a powerful tool for developers looking to create dynamic, responsive plugins. By subscribing to predefined events—or even defining your own—you can build interconnected dashboards that react instantly to user actions.
Whether you’re enhancing visualizations or enabling cross-panel communication, mastering the EventBus unlocks a new level of flexibility and control in Grafana development. Dive in, experiment, and see how far you can push the boundaries!