Dynamic Text Panel 4.1.0

We're excited to announce the release of the Dynamic Text Panel 4.1.0. This feature release includes the following updates:
- Added support for external JavaScript and CSS resources.
- Added the status field to display a background color.
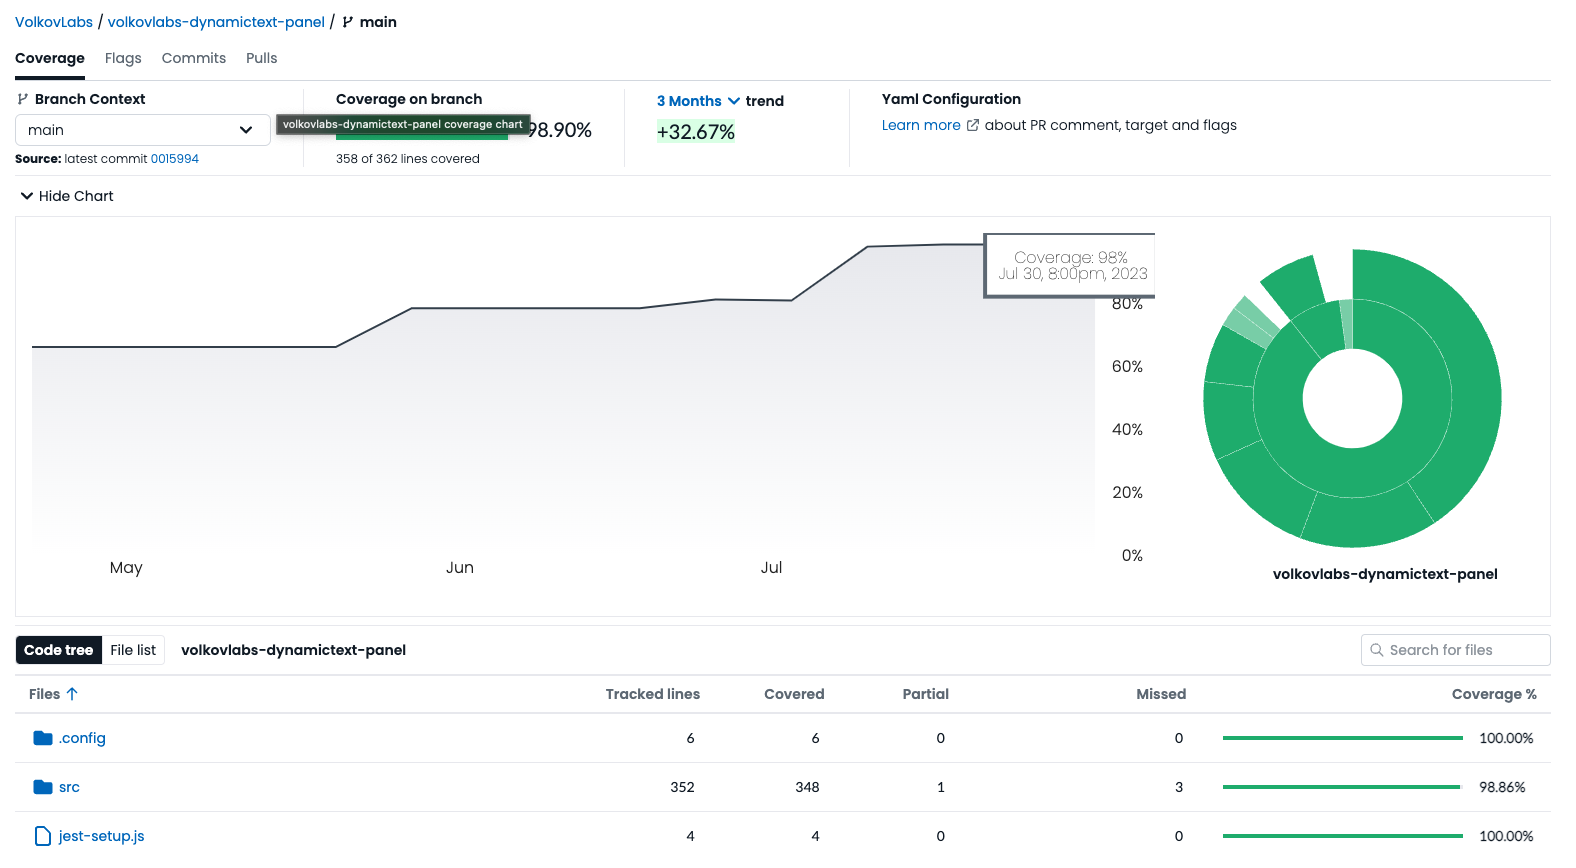
- Increased test coverage up to 99%.
The plugin was updated in the Grafana Plugins catalog on July 18, 2023.
External JavaScript and CSS resources
The Dynamic Text Panel plugin enables the loading of additional JavaScript and CSS resources from external URLs like CDN (Content Delivery Network). To prevent the loading of third-party URLs, you can store CSS and JS files on your Grafana instance in the public folder.
You need to disable sanitization in your Grafana instance to see external resources in the panel options.
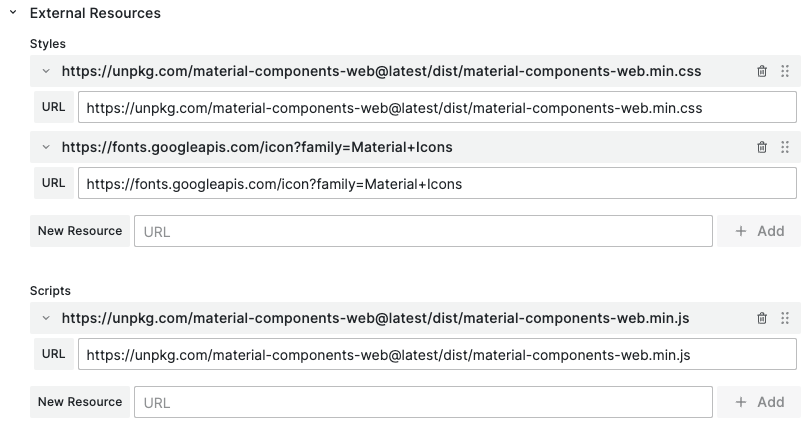
You can use external CSS and JS files to include additional visual elements and execute JavaScript functions from the JavaScript code editor.
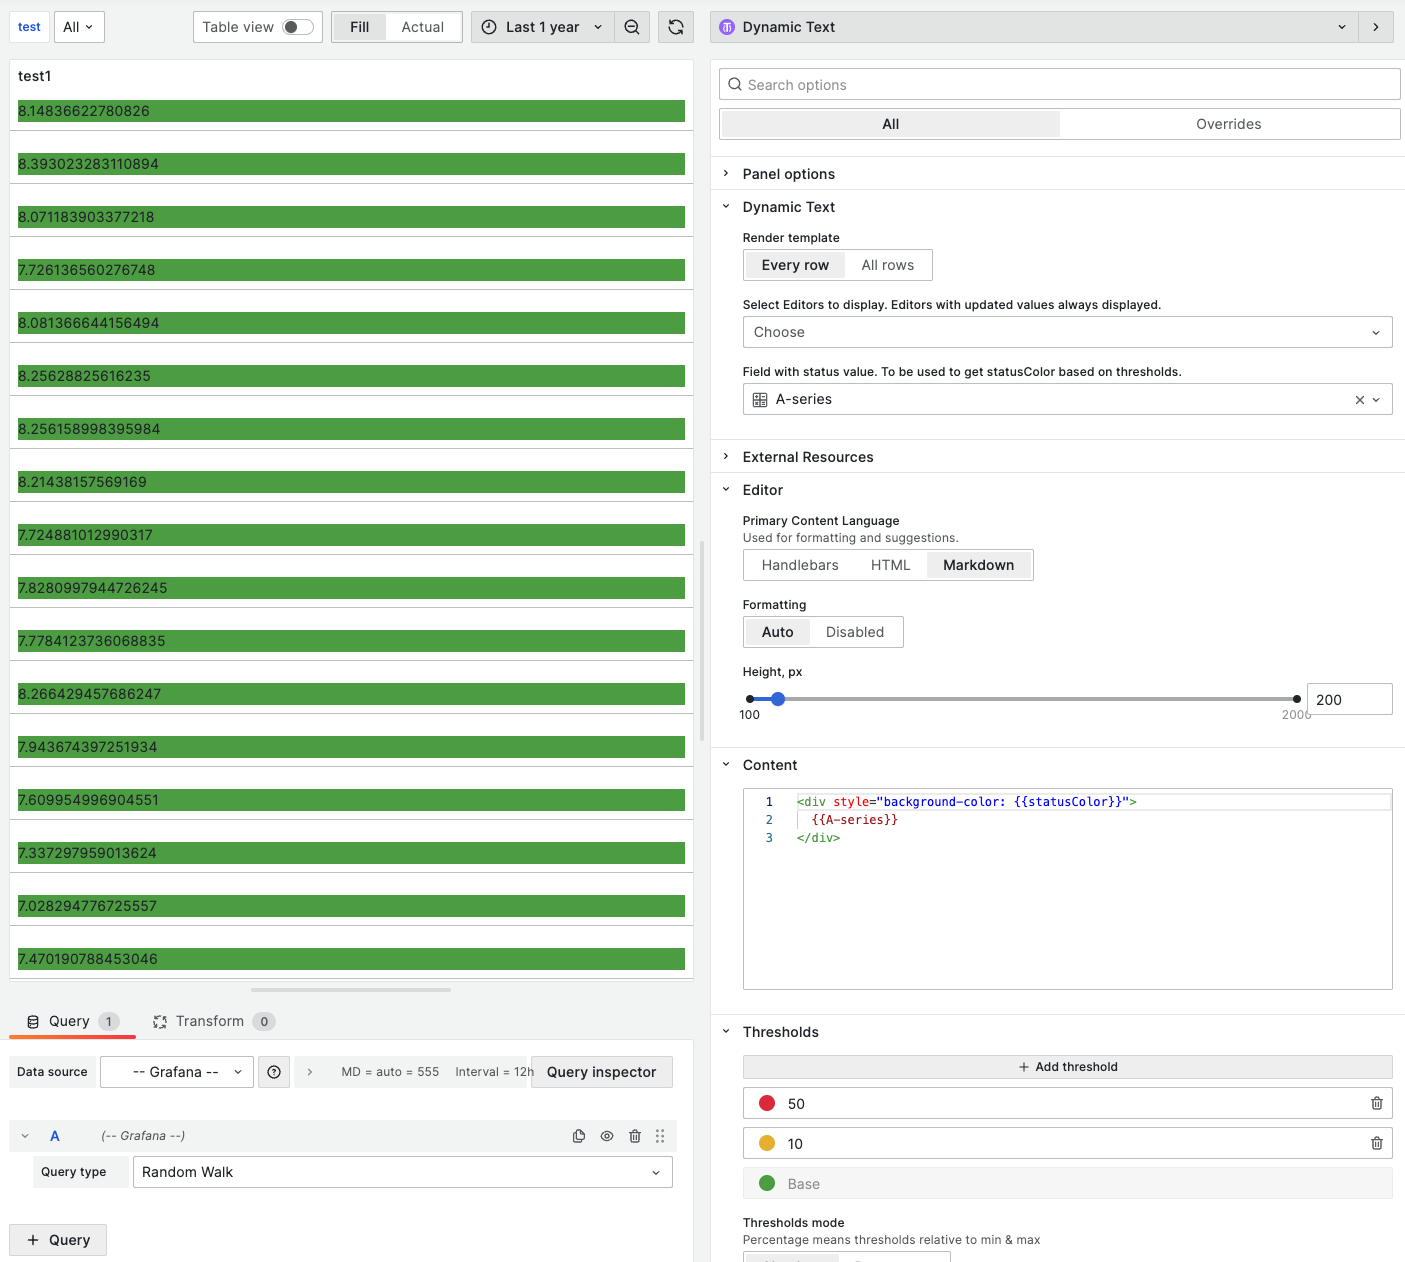
Status field
The statusColor variable can be used to set a background or foreground color of any HTML element based on the threshold ranges for the selected status field.
Example
Sophisticated solution from the community
Dynamic Text Panel enables the creation of the most comprehensive solutions without building additional panels.
Register the aggr_val Handlebars helper to aggregate values returned from a data source.
handlebars.registerHelper(
  "aggr_val",
  (
    data = my_data,
    key_value,
    aggr,
    key_to_filter1,
    val_to_filter1,
    key_to_filter2,
    val_to_filter2
  ) =>
    ((numbers) => {
      const result =
        numbers.length === 0
          ? 0
          : aggr === "sum"
          ? numbers.reduce((total, num) => total + num, 0)
          : aggr === "avg"
          ? numbers.reduce(
              (total, num, _, { length }) => total + num / length,
              0
            )
          : aggr === "min"
          ? numbers.reduce((min, num) => (num < min ? num : min), numbers[0])
          : aggr === "max"
          ? numbers.reduce((max, num) => (num > max ? num : max), numbers[0])
          : aggr === "first"
          ? numbers[0]
          : aggr === "last"
          ? numbers[numbers.length - 1]
          : (() => {
              throw new Error(
                "Invalid aggr. Supported aggr are: sum, avg, min, max, first, last"
              );
            })();
      return Number.isInteger(result) ? result : result.toFixed(2);
    })(
      data
        .filter(
          (item) =>
            item[key_to_filter1] === val_to_filter1 &&
            item[key_to_filter2] === val_to_filter2
        )
        .map((item) => item[key_value])
    )
);

handlebars.registerHelper(
  "sel_val",
  (
    data = my_data,
    key_value,
    key_to_filter1,
    val_to_filter1,
    key_to_filter2,
    val_to_filter2
  ) => {
    return data
      .filter(
        (item) =>
          item[key_to_filter1] === val_to_filter1 &&
          item[key_to_filter2] === val_to_filter2
      )
      .map((item) => item[key_value]);
  }
);
Display aggregated values based on any rules, which the native Grafana transformations do not support.
Code Coverage
With our plugins installed on thousands of Grafana instances, we recognize that our users do not experience any unexpected changes, thus we increased Dynamic Text Panel's test coverage up to 99% and refactored its legacy components.
Getting Started
You can install Dynamic Text Panel from the Grafana Plugins catalog or using the Grafana command line tool.
For the latter, please use the following command:
grafana-cli plugins install marcusolsson-dynamictext-panel
YouTube Tutorial
Dynamic Text Panel is a Grafana visualization plugin that converts plain text and table data into visually appealing, easy-to-read information cards. You can use variables, Markdown, and Handlebars to customize the look of the outputted cards.
The Dynamic Text Panel plugin allows you to construct a text visualization template from the values of a dataset returned by a data source query.
Release Notes
Features / Enhancements
- Updated ESLint configuration (#192).
- Increased test coverage for the plugin's functionality (#194).
- Added the status field (#196).
- Added support for external JavaScript and CSS resources (#197).
- Added compatibility with Grafana 10.0.2 (#201).
Feedback
We're looking forward to hearing from you. You can use different ways to get in touch with us.
- Ask a question, request a new feature, or report an issue at GitHub issues.
- Subscribe to our YouTube Channel and leave your comments.
- Sponsor our open source plugins for Grafana through GitHub.