Statistical and Data Mining
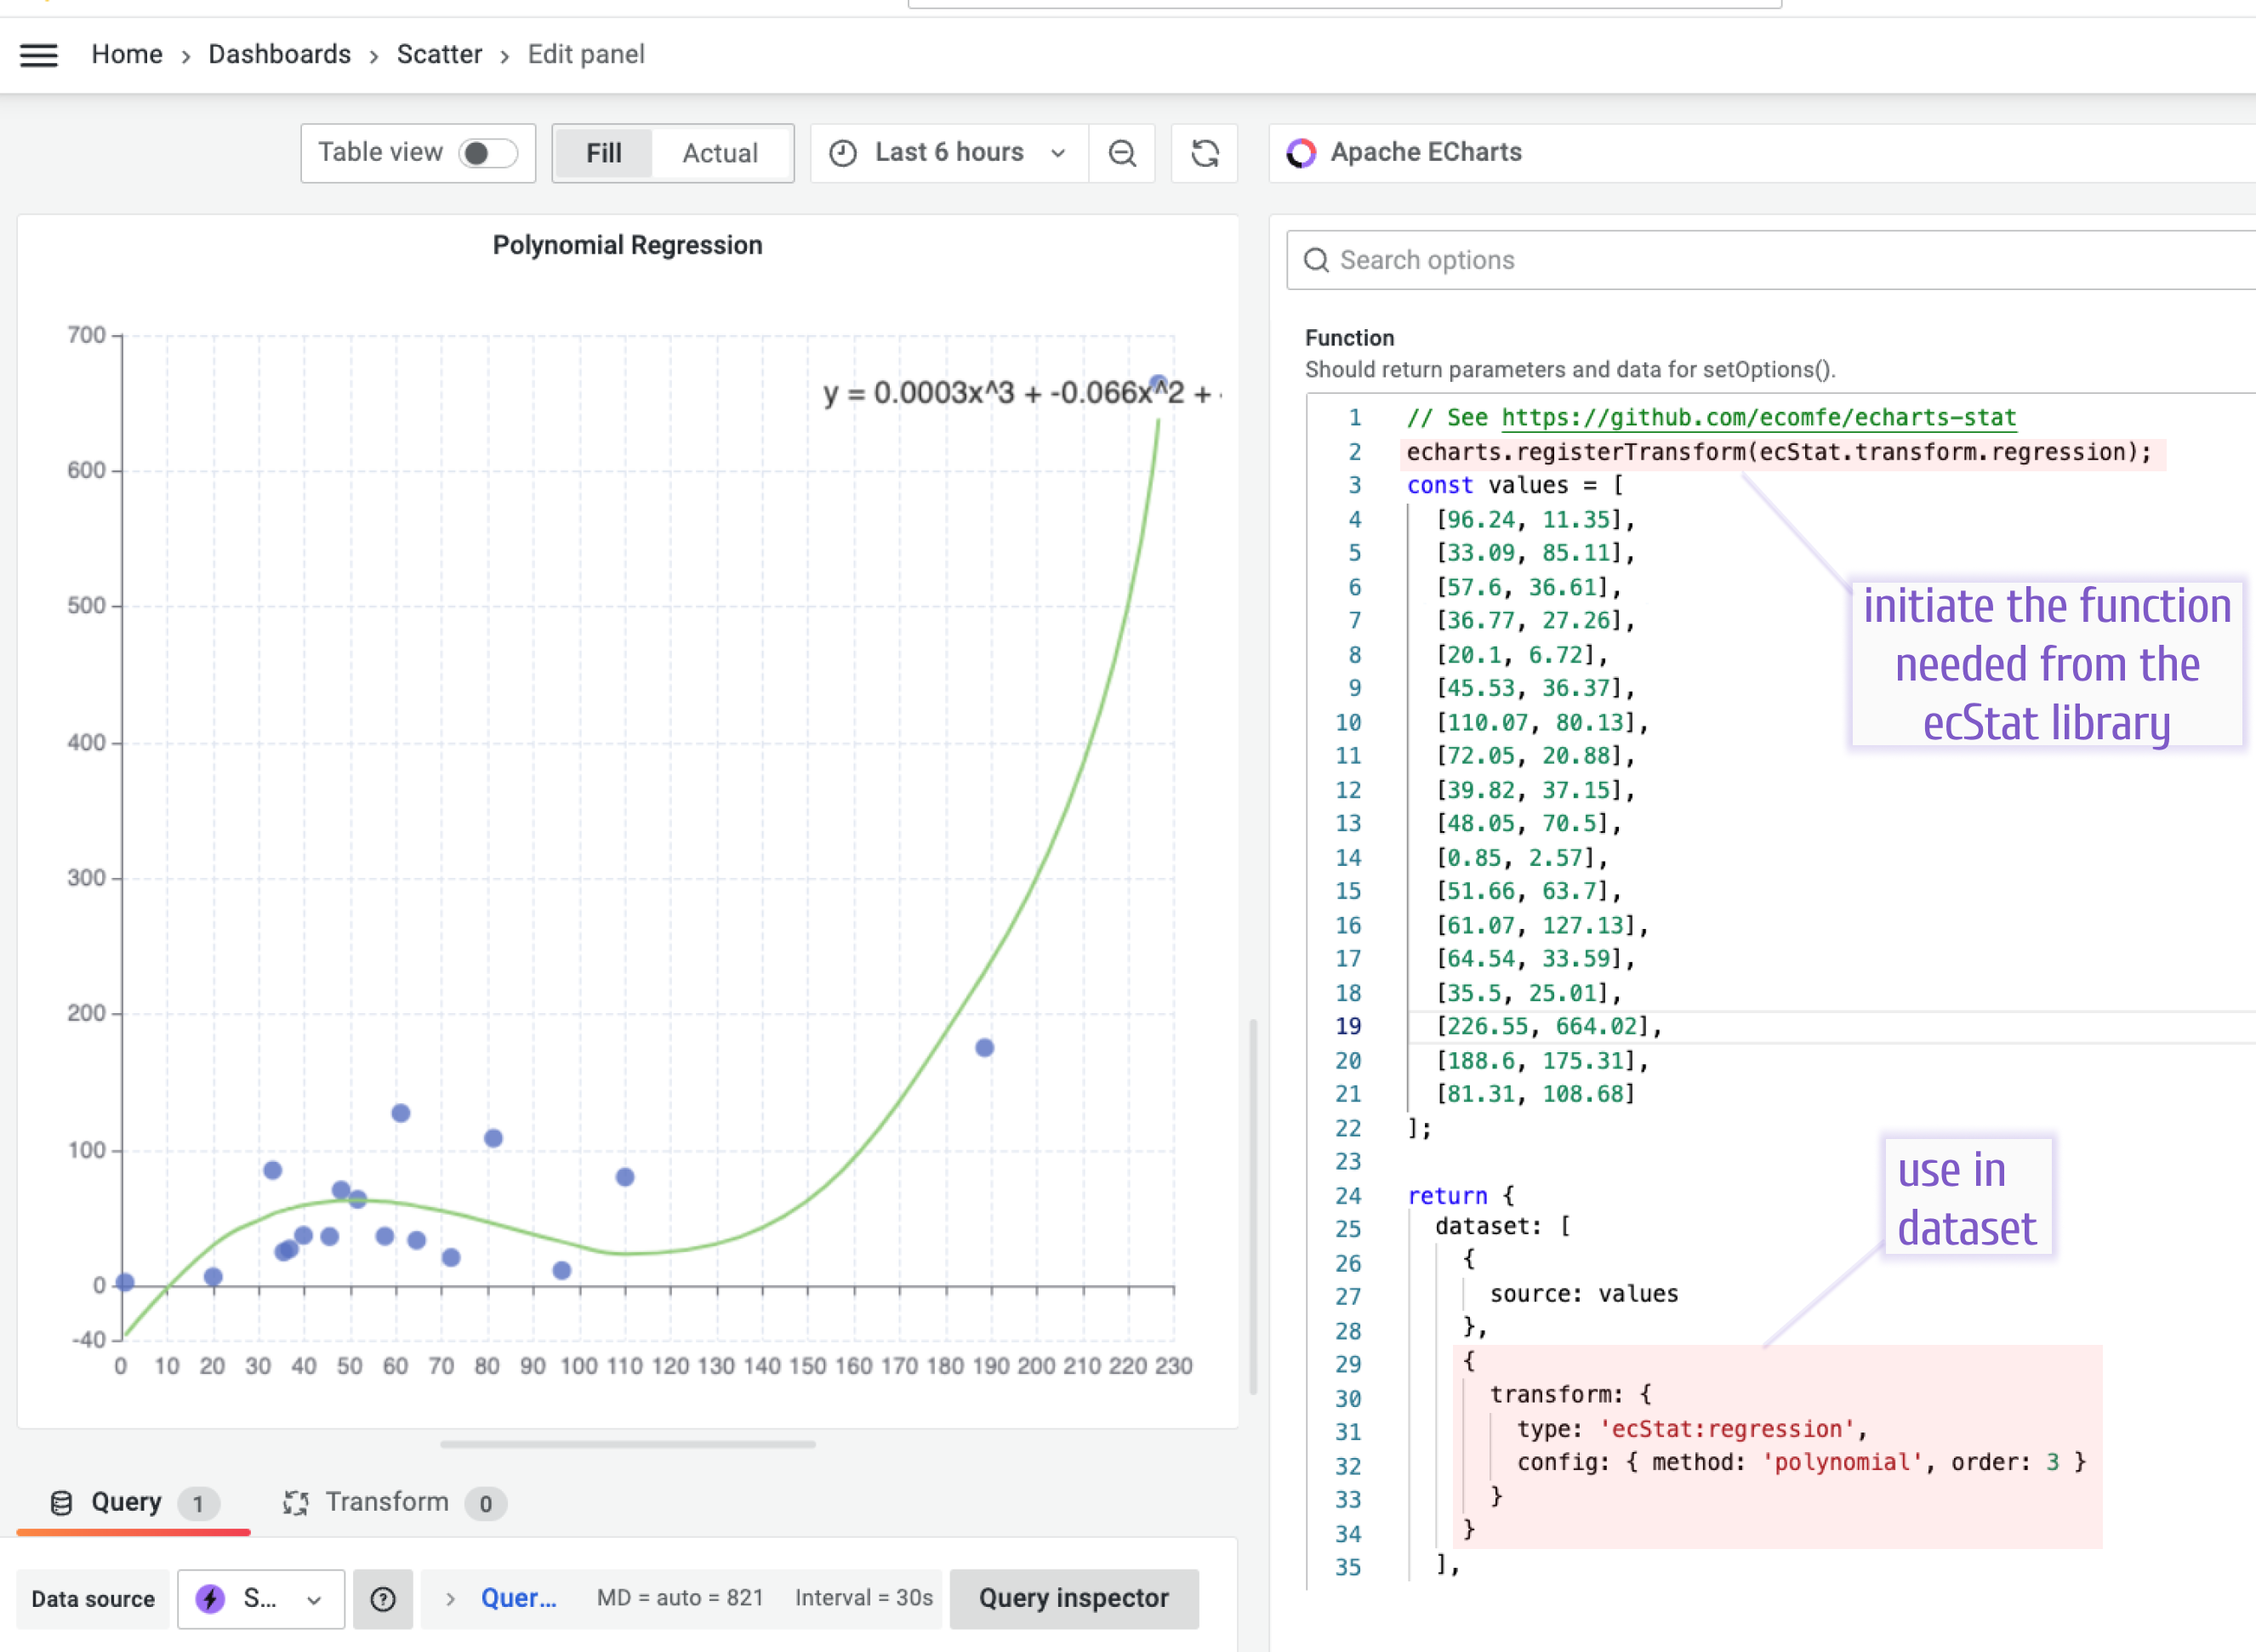
The ecStat library integrates statistical and data mining capabilities of the Apache ECharts library into the chart generation within the Business Charts panel.
Tutorial
Watch our tutorial for a detailed guide on using three data mining functions provided by ecStat:
- Clustering
- Histograms
- Regression
Additionally, the ecStat library provides basic statistical tools like
- Deviation
- Maximum
- Mean
- Median
- Minimum
- Quantile
Example
You can find an example at echarts.volkovlabs.io. Feel free to copy the code and modify it for your use case.