Alert Management panel
The alert management panel is set to simplify the alert rule creation. We designed it to be intuitive and business-oriented users friendly. You specify all parameters in a one-screen form.
Alert rule parameters
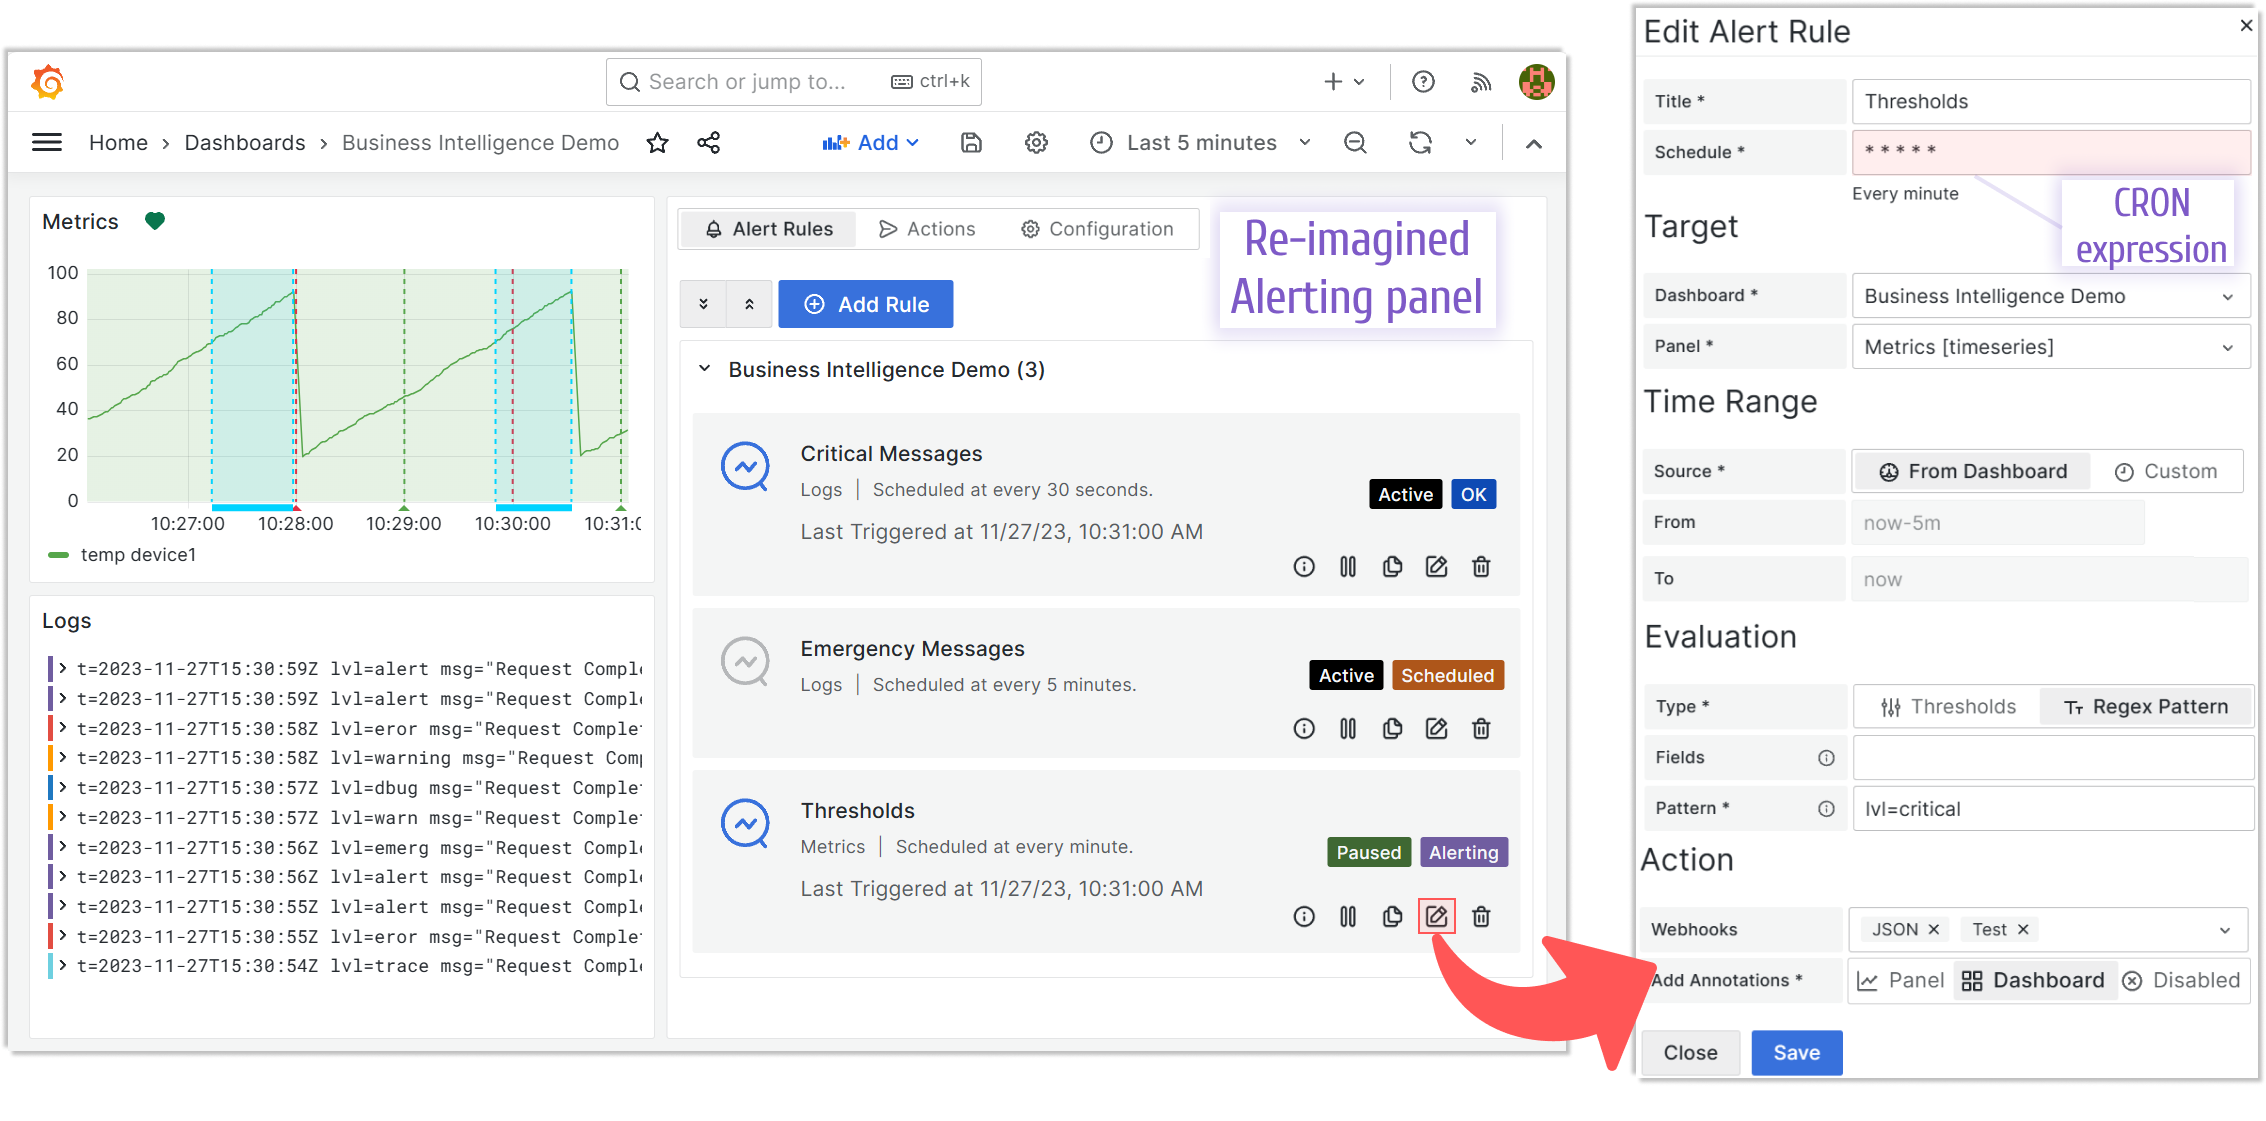
The new alert rule/edit mode has the following configuration elements to specify:
- Title is an alert name.
- Schedule is a frequency of how often the rule should run. With CRON expressions your schedule can be as complex as needed.
- Target Dashboard and Target Panel are drop-downs to select from the existing ones. The alert rule will take queries and thresholds from there automatically.
- Time Range could be either taken from the dashboard and specified custom.
- The alert evaluation could be set to Thresholds or Regex Pattern.
- For the Thresholds, the alert examines the data against thresholds set in the panel options.
- For the Regex Pattern, the alert examines the specified fields (optional) and searches the specified pattern.
- For the alert action, select from the drop-down list of the existing, pre-configured action APIs.
- Add Annotation option.
- specify Panel to create and attach an annotation to a panel,
- specify Dashboard to create and attach an annotation to a dashboard (i.e. all panels of this dashboard),
- specify Disabled to disable the creation of any annotation following the alert rule breach.
We target to have the Alert Management UI panel work with hundreds or even thousands of alerts with grouping and filtering to ensure easy navigation and control.
Alert card
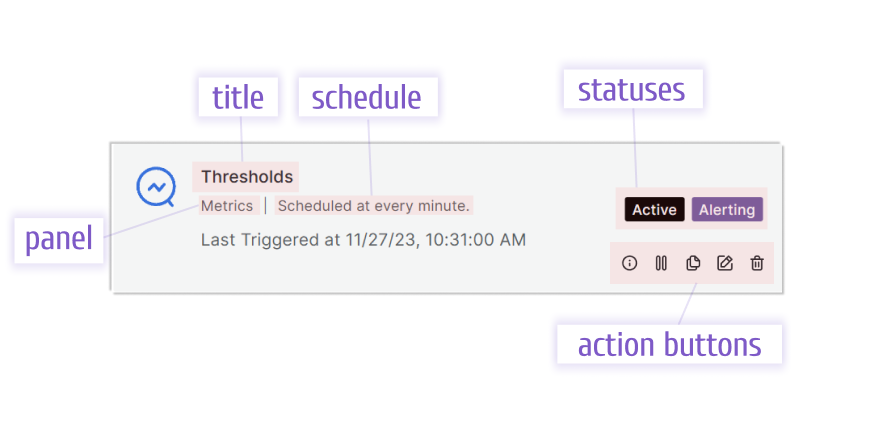
Every alert on the Alerting panel has a sleek card with the title, the panel name it evaluates, schedule details, statuses and action buttons.
Statuses
There are two statuses for each alert. One indicates whether the alert is Active or has been Paused.
And the other status might be one of the four values:
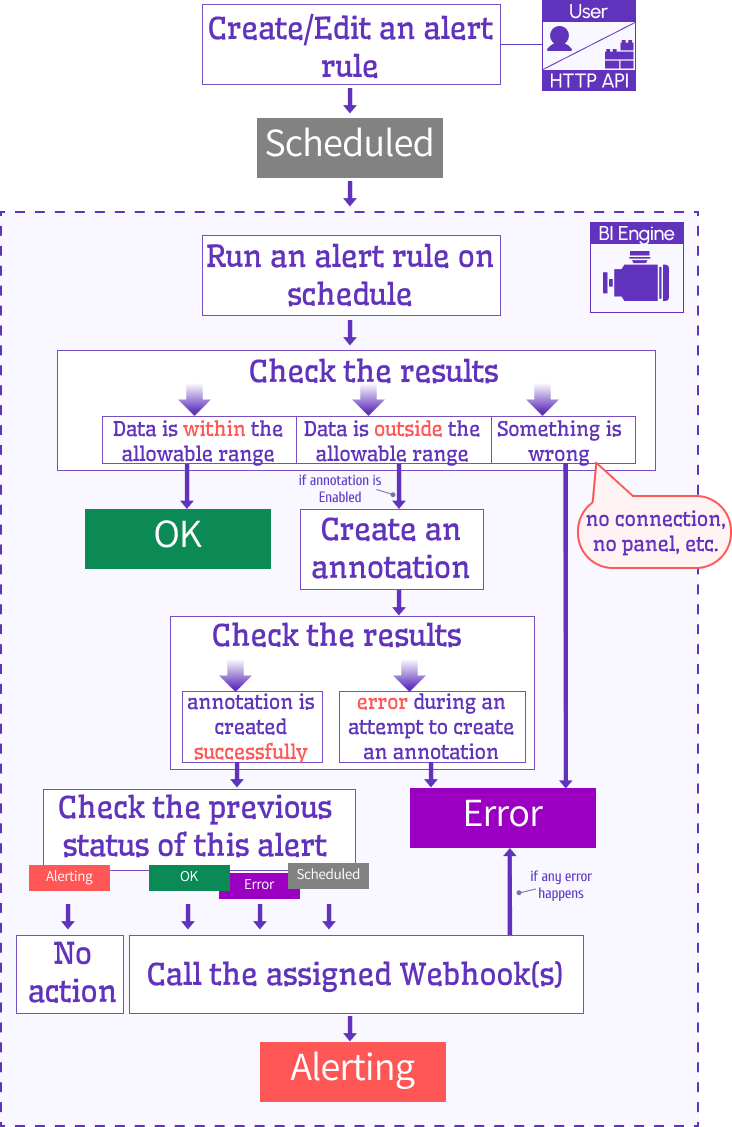
- Scheduled. The alert is scheduled, but never run yet. This status is assigned right after the alert is created or modified by the user and API.
- OK. The alert has been run and the thresholds are NOT breached and the Regex pattern is NOT found.
- Alerting. The alert has been run and the thresholds are being breached or the Regex pattern is found.
- Error. Something is wrong which could be the query, annotation or action.
Right after an alert is created it becomes Active and Scheduled. Any active alert could be paused. After any modification, the alert status changes to Scheduled.
Reference the flow schema to get a better understanding of how statuses change in the BI Engine.
Action buttons
Four action buttons are available:
- Details. Opens the drawer with the alert details. For the alert rules in the Alerting and Error statuses, the BI App also adds the Event Details section with all necessary information for troubleshooting.
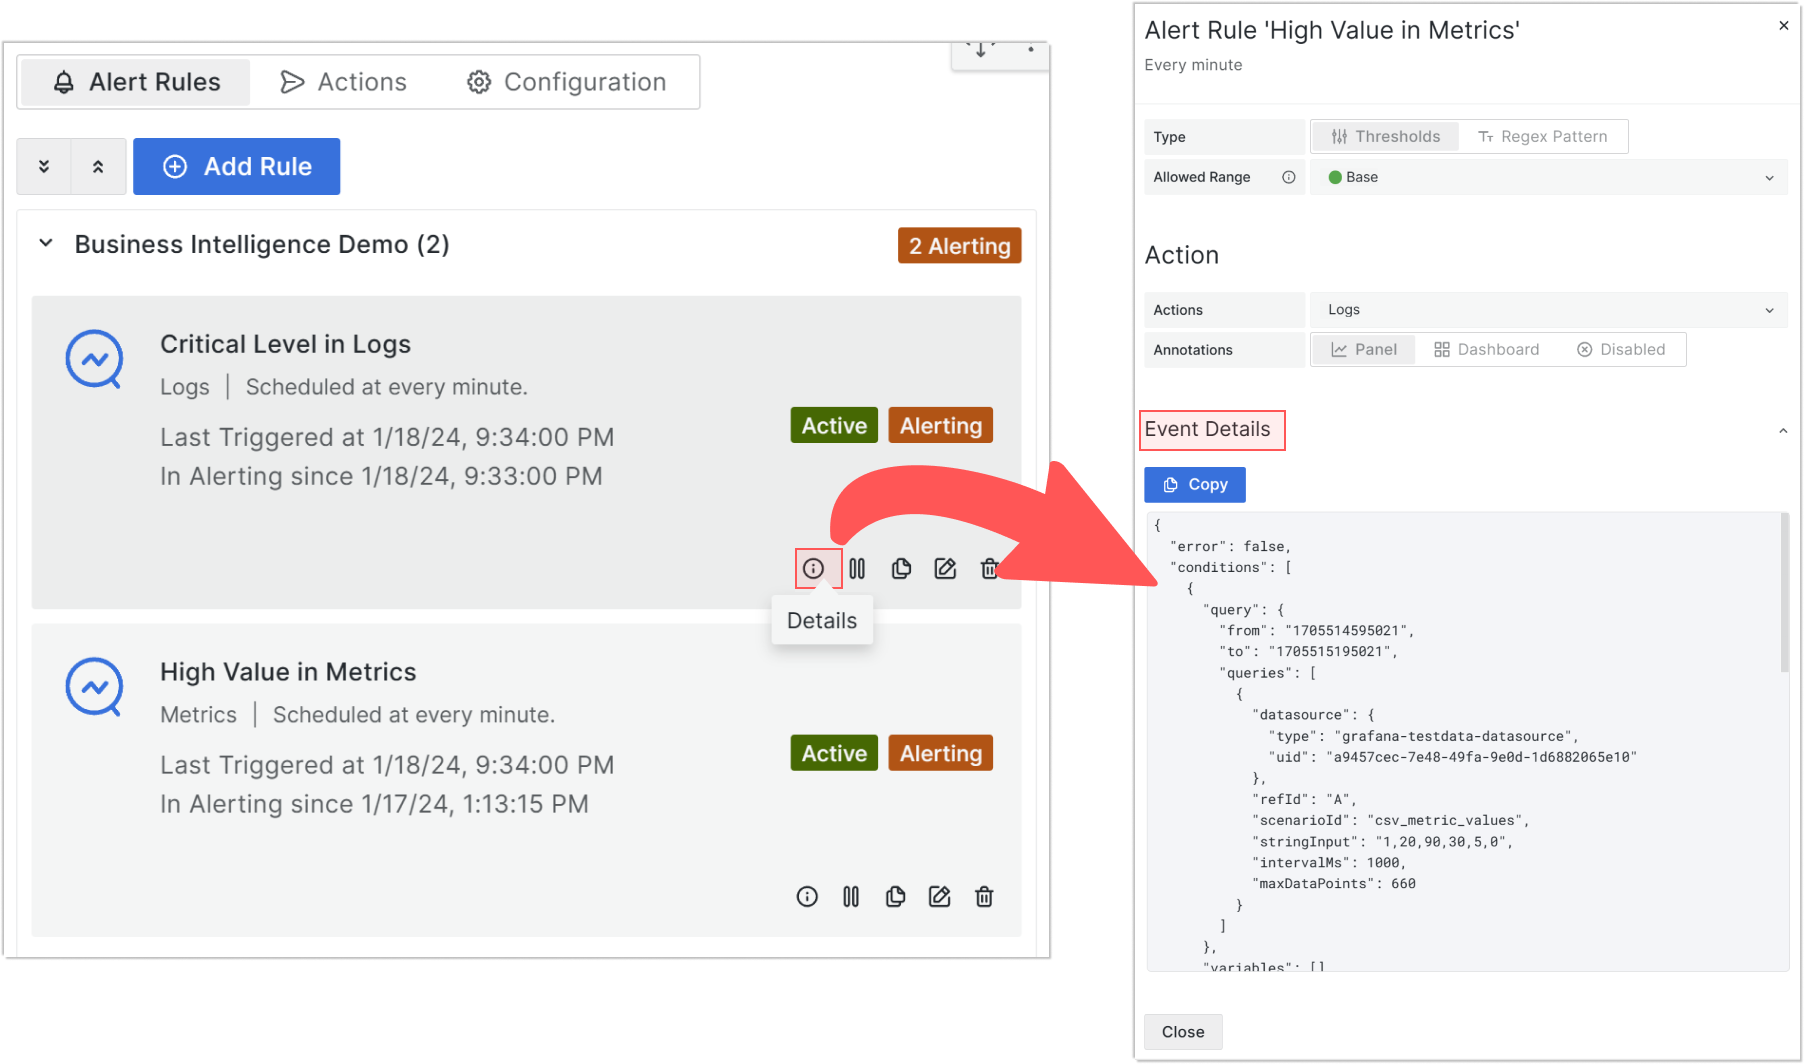
- Pause/Active. Sets the alert to pause or active mode.
- Duplicate. Create an alert rule based on the existing one.
- Edit. Opens the Edit drawer (scroll up to find the illustrating image). When you save in the Edit drawer, the alert status changes to Scheduled.
- Delete. Deletes the alert after the user's confirmation.
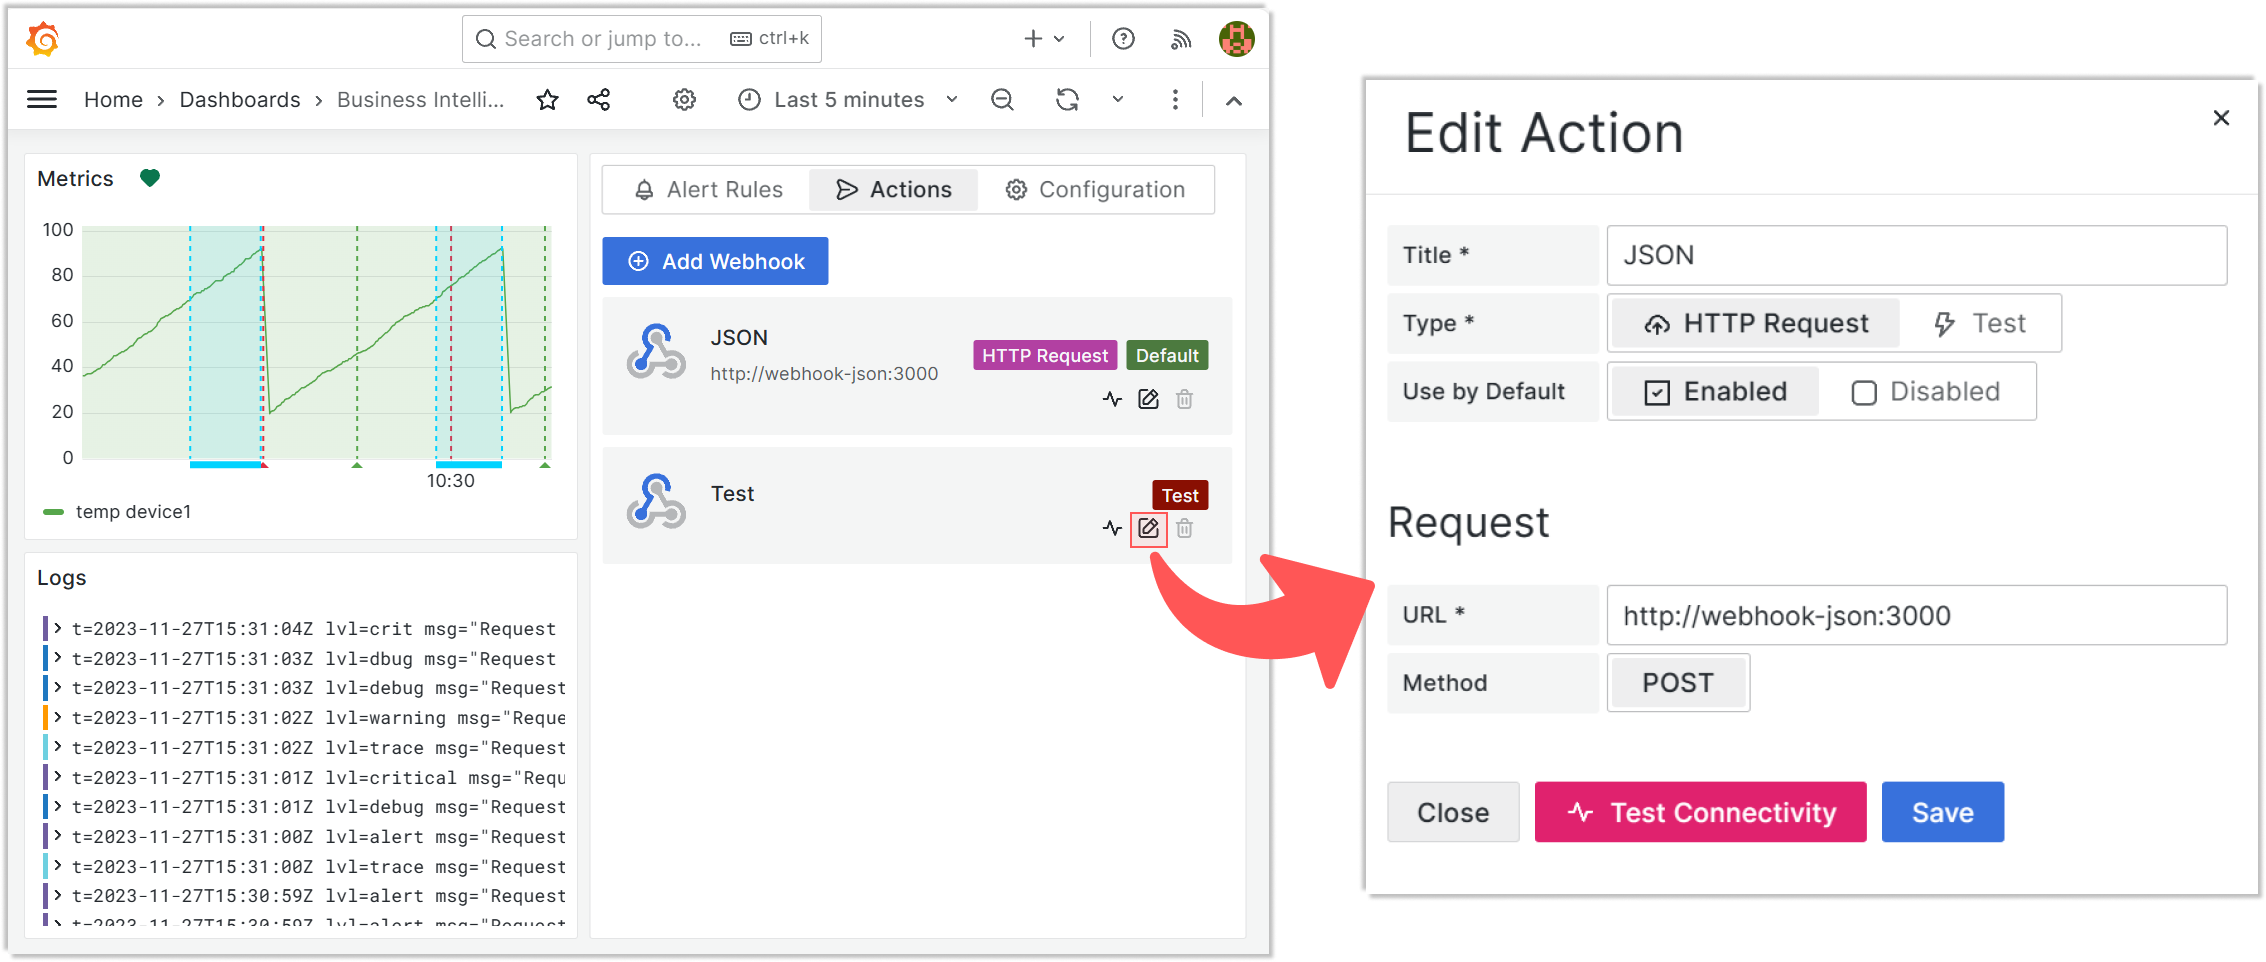
Alert action parameters
This tab lists all configured actions. In the edit mode, you specify a title, type (HTTP or Logs), request URL and request method.
Any action could be configured as a default one by setting the Use by Default parameter to Enabled.
You can use the Test Connectivity button to check REST API endpoint availability.
User roles in the Alerting panel
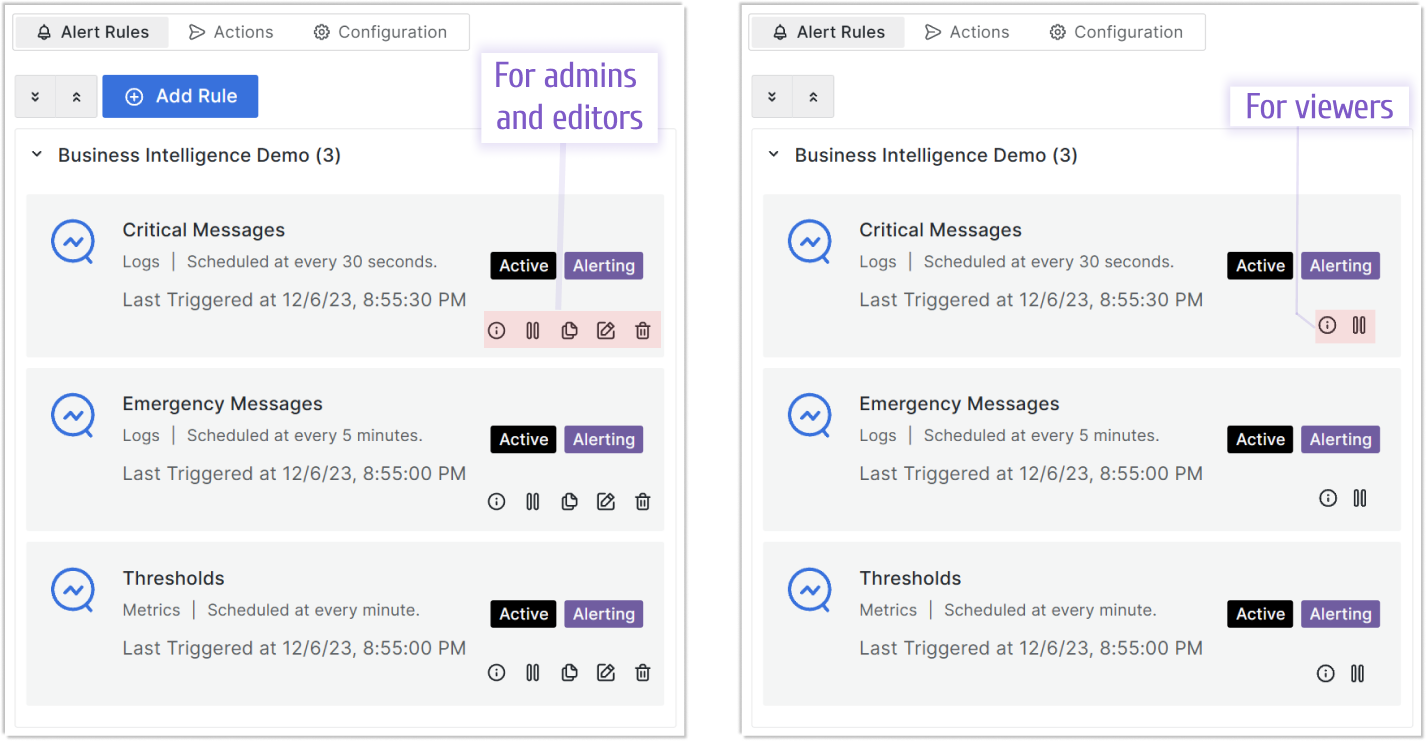
Alert rules tab
For Admins and Editors, all five action buttons are available: info, pause/resume, duplicate, edit, delete. For Viewers, only two action buttons are available: info, pause/resume.
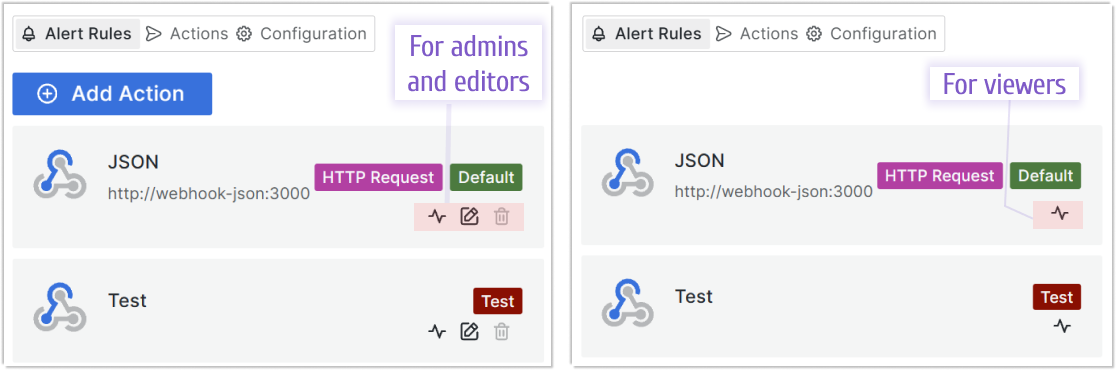
Actions tab
For Admins and Editors, all three action buttons are available: test, edit, delete. For Viewers, only one action button is available: test.
A greyed-out delete button in the Actions tab means the alert rule with this action is currently active and can not be deleted.